USDCADPrice is already at the drawn out supply zone.
Aggressive entry taken. Wait for ltf setup for confirmation
Trade ideas

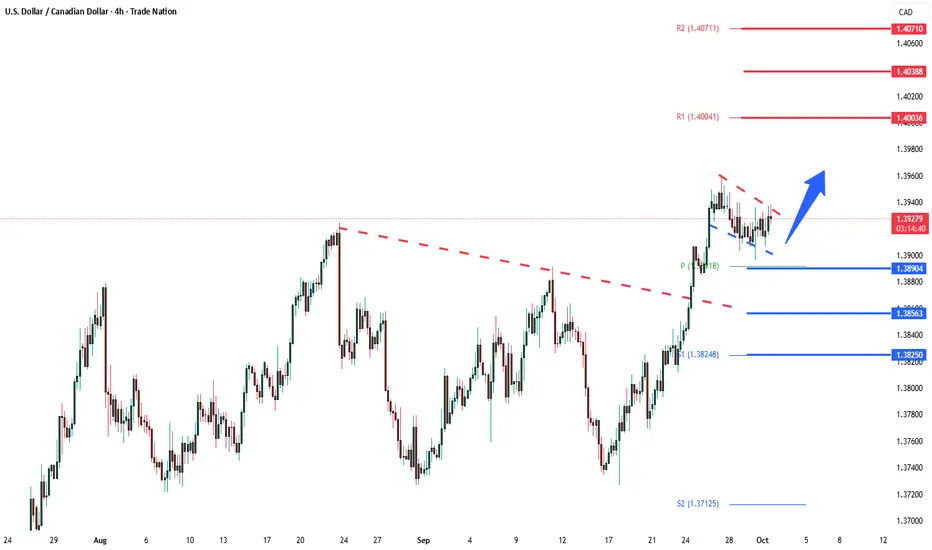
USDCAD Bullish Flag developing?The USDCAD remains in a bullish trend, with recent price action showing signs of a corrective pullback within the broader uptrend.
Support Zone: 1.3890 – a key level from previous consolidation. Price is currently testing or approaching this level.
A bullish rebound from 1.3890 would confirm ongoing upside momentum, with potential targets at:
1.4000 – initial resistance
1.4040 – psychological and structural level
1.4070 – extended resistance on the longer-term chart
Bearish Scenario:
A confirmed break and daily close below 1.3890 would weaken the bullish outlook and suggest deeper downside risk toward:
1.3856 – minor support
1.3825 – stronger support and potential demand zone
Outlook:
Bullish bias remains intact while the USDCAD holds above 1.3890. A sustained break below this level could shift momentum to the downside in the short term.
This communication is for informational purposes only and should not be viewed as any form of recommendation as to a particular course of action or as investment advice. It is not intended as an offer or solicitation for the purchase or sale of any financial instrument or as an official confirmation of any transaction. Opinions, estimates and assumptions expressed herein are made as of the date of this communication and are subject to change without notice. This communication has been prepared based upon information, including market prices, data and other information, believed to be reliable; however, Trade Nation does not warrant its completeness or accuracy. All market prices and market data contained in or attached to this communication are indicative and subject to change without notice.

Could we see a drop from here?The Loonie (USD/CAD) is reacting off the pivot, which is a pullback resistance that aligns with the 138.2% Fibonacci extension and could reverse to the 1st support.
Pivot: 1.3940
1st Support: 1.3793
1st Resistance: 1.4015
Disclaimer:
The above opinions given constitute general market commentary, and do not constitute the opinion or advice of IC Markets or any form of personal or investment advice.
Any opinions, news, research, analyses, prices, other information, or links to third-party sites contained on this website are provided on an "as-is" basis, are intended only to be informative, is not an advice nor a recommendation, nor research, or a record of our trading prices, or an offer of, or solicitation for a transaction in any financial instrument and thus should not be treated as such. The information provided does not involve any specific investment objectives, financial situation and needs of any specific person who may receive it. Please be aware, that past performance is not a reliable indicator of future performance and/or results. Past Performance or Forward-looking scenarios based upon the reasonable beliefs of the third-party provider are not a guarantee of future performance. Actual results may differ materially from those anticipated in forward-looking or past performance statements. IC Markets makes no representation or warranty and assumes no liability as to the accuracy or completeness of the information provided, nor any loss arising from any investment based on a recommendation, forecast or any information supplied by any third-party.

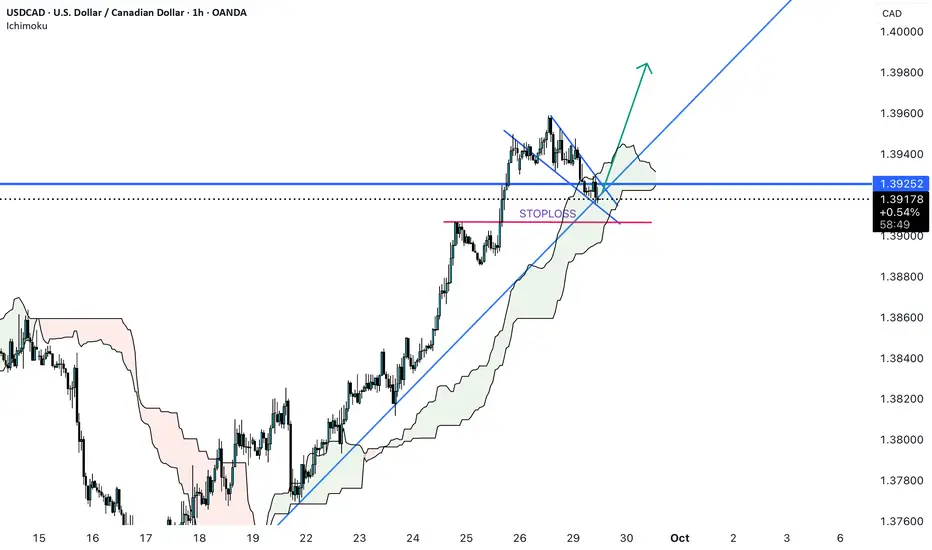
USDCAD: Uptrend ContinuationThis trade is not near a major daily level, but I think it does have potential.
Daily Timeframe
Price made a very clean break above the HTL
Bearish move only lasted two days, which is an indication of weak momentum
H1 Timeframe
Price crosses above EMA20 and continues accelerating away
EMA20 is accelerating away from EMA60
Price also crossed DTL, but caution that this was not a clean break

USDCAD BUY TRADE PLAN🔥 USDCAD – Trade Plan (2025-09-30)
🆔 Plan ID: USDCAD_2025-09-30_v1
Bias: BUY (Continuation)
⸻
📋 Overview Table
Type Direction Confidence R:R (to TP2) Status
Swing / Intra-day BUY 75% (valid) ~1:3.1 Pending
⸻
🏦 Market Bias
• D1: Higher-lows intact, clear bullish continuation above 1.3860 support.
• H4: Current pullback into prior demand; rejection wicks show absorption of sellers.
• H1: Sideways consolidation, but maintaining structure above 1.3890 HL.
➡️ Bias locked = WITH HTF trend (Buy).
⸻
⚒️ Levels Card (Quick Action)
Primary Setup (High Probability Buy Zone)
• Entry 01: 1.3890 – 1.3905 (H1 demand + H4 OB + fib 38.2%)
• Stop Loss: 1.3865 (below H4 swing low, safe but not overly wide)
• TP1: 1.3960
• TP2: 1.4010
• TP3: 1.4080 (D1 supply extension)
• Order: Pending – Pre-validated ✅
• Session Focus: London/NY
Alternate Setup (Deeper Demand Retest – if flushed)
• Entry 02: 1.3840 – 1.3855 (D1 demand zone)
• Stop Loss: 1.3805
• TP1: 1.3925
• TP2: 1.4000
• TP3: 1.4075
⸻
📰 Fundamentals & Sentiment
• USD: Market awaits US ISM + NFP week, dollar bid tone persists on strong data expectations. Fed speakers cautious but not dovish.
• CAD: Oil volatility (WTI near $70) is weakening CAD slightly. BoC stance neutral, no hawkish drive.
• Risk Sentiment: Stable; equities firm, no strong risk-off yet.
➡️ Macro favors USD strength vs CAD.
⸻
✅ Final Notes
• A+ Zone: Entry 01 (1.3890–1.3905) = ~87% confluence (H1 demand + H4 OB + fib + trend).
• Stops chosen = safe but proper (not overly wide).
• Plan valid only if price respects 1.3865 HL base.
• No trades if breakdown below 1.3805 → plan invalidated.

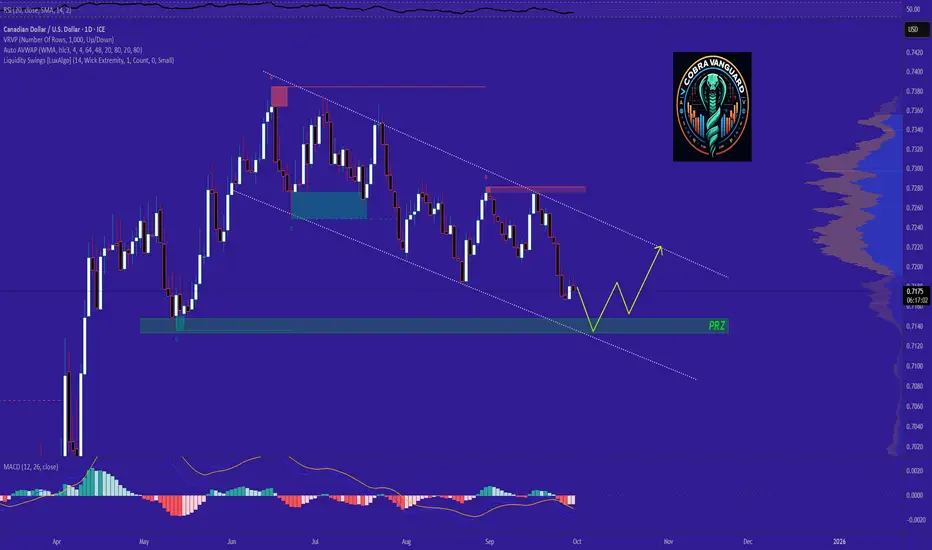
CADUSD → Bearish 𝐏𝐫𝐞𝐬𝐬𝐮𝐫𝐞 !!!As you can see, the price could drop to the bottom of the descending channel and then turn bullish. The PRZ (Potential Reversal Zone) is a good area for an upward move.
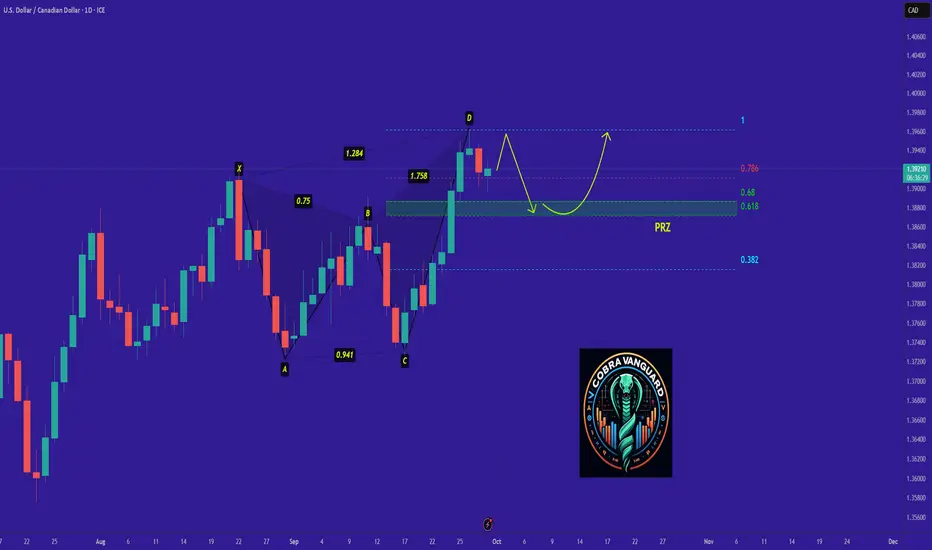
Be careful with USDCAD !!!The price could rise by about 300 pips and then become bearish at the PRZ (Potential Reversal Zone).
USDCADNo comment on the trade. Just structure, timing, and conviction. Let the market do the talking.

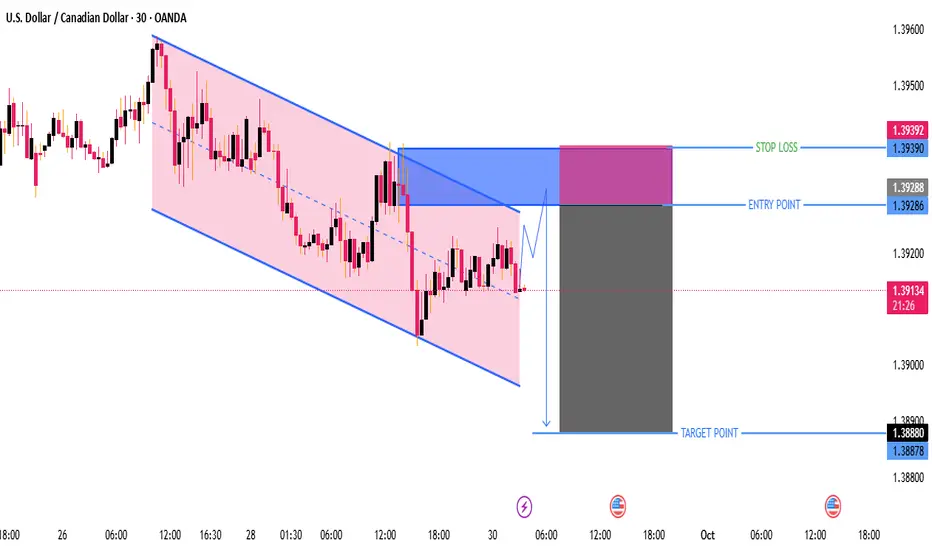
USD/CAD Bearish Channel Breakout – Short SetupThis chart is for USD/CAD (30-min timeframe) and shows a clear bearish setup.
Here’s the breakdown:
---
1. Pattern
Price is moving inside a downward channel (highlighted in pink).
Currently near the midline of the channel with potential to retest the upper boundary.
The plan here seems to be a sell setup after a small bullish pullback.
---
2. Key Levels
Entry Point: 1.39286 (after price pulls back into the blue zone).
Stop Loss: 1.39392 (just above the channel and resistance zone – good risk management).
Target Point: 1.38880 (near the lower channel boundary, aligning with previous support).
---
3. Risk-to-Reward Ratio (RRR)
This setup offers a favorable RRR (roughly 1:3), meaning potential reward is about 3x the risk.
---
4. Bias
Bearish bias – expecting continuation of the downtrend after price retests resistance.
The market is respecting the descending channel, and unless price breaks above 1.3940, sellers remain in control.
---
5. Confirmation to Watch
Look for rejection candles or bearish engulfing in the blue zone before taking entry.
If price breaks and closes above 1.3940, this setup becomes invalid (bullish breakout likely).
---
✅ Summary:
This is a well-planned short (sell) setup. Wait for price to pull back to 1.3928 – 1.3930, then sell with stop above 1.3940 and target near 1.3888.
uptrend The correction trend is expected to advance to the specified support level. Then there is a possibility of a trend change and the beginning of an upward trend.
USD/ CAD) Bullish Analysis Read The captionSMC Trading point update
Technical analysis of USD/CAD (1H timeframe) chart analysis:
---
Bullish USD/CAD Setup
Support Zone: Price is respecting the support level (yellow box around 1.3920 – 1.3930).
Moving Averages:
50 EMA (red) is below current price, providing short-term bullish support.
200 EMA (blue) is also trending upward, confirming overall bullish bias.
Market Structure: Higher highs and higher lows suggest continuation to the upside.
Projection: Price is expected to bounce from the support zone and push toward the next resistance/target.
---
Target Point
1.3998 (near 1.4000 psychological level).
This aligns with the measured move projection from the last impulsive rally.
Mr SMC Trading point
---
Trading Idea
Bias: Bullish.
Entry Zone: Around 1.3920 – 1.3930 (support level retest).
Target: 1.3998.
Invalidation: A sustained break below 1.3900 would invalidate the bullish scenario.
---
Please support boost 🚀 this analysis

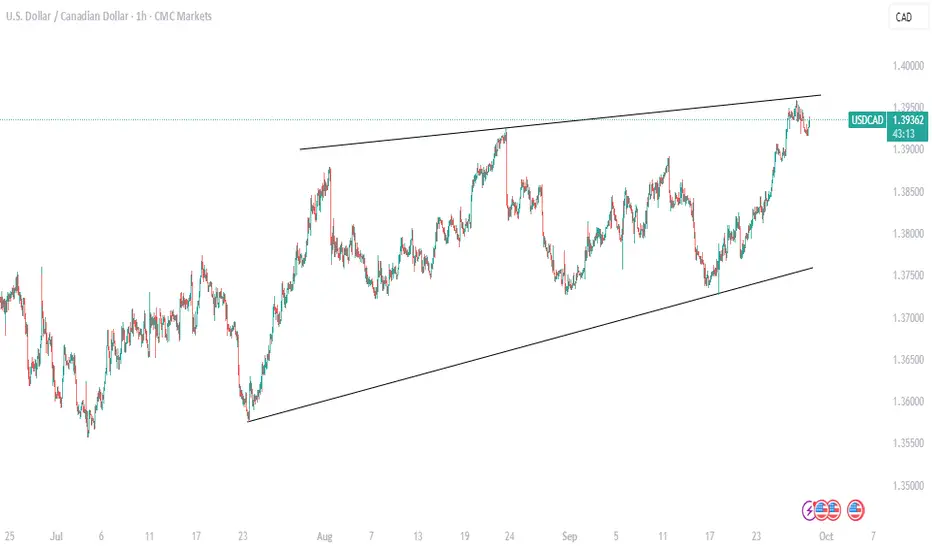
USDCAD Pullback Before Uptrend ResumesA while ago I posted a bullish setup for USDCAD on the Daily TF.
That plan is still ongoing and price is moving according to plan.
But right now it has hit a resistance, and a pullback to a demand zone is in order before the push-up continues.

USDCAD bullish Wedge at Major support Long USDCAD on 30 min chart formed a bullish wedge pattern price likely will go up . Reversal to higher level possible .

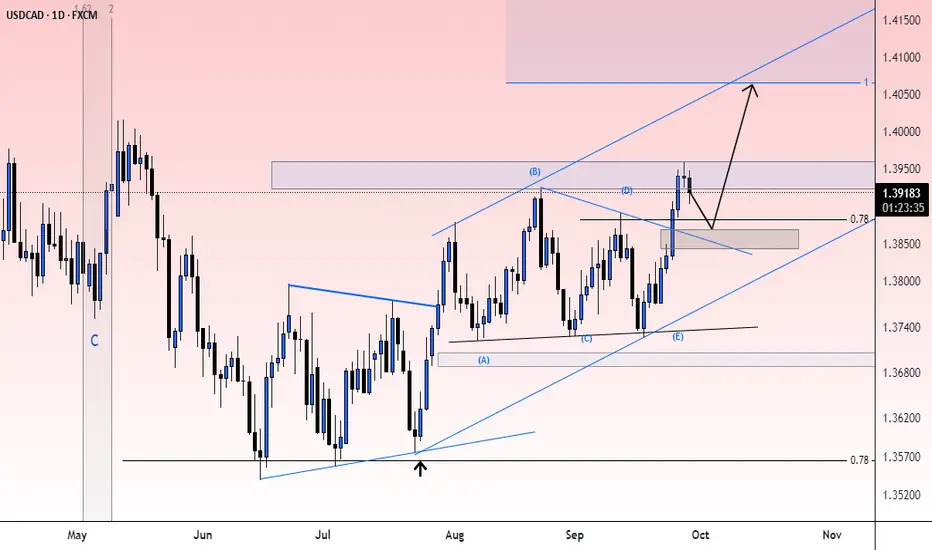
USDCAD: Impulse Wave Points to Higher LevelsUSD/CAD Price is showing the early stages of a bullish (C) leg after a large corrective sequence. The chart labels show a completed corrective (B) low at the horizontal support and an impulsive 1–2 sequence unfolding for the new upward leg. Bias: bullish while price holds above the demand zone/wave-2 low.
The market completed an ABC correction that found support on the horizontal lower boundary. That corrective phase looks finished; we should now be in wave (C) up, the final leg of the correction.
Short-term momentum has flipped, with buyers stepping in at support. This favors trend-following longs into the extension leg (wave 3 → 5)
Target 1 (T1): 1.38408
Target 2 (T2): 1.38810
Stop-Loss (SL): 1.37195

USDCAD; A Confirmed Reversal ?USDCAD have fulfilled our review on this pair, if you had followed our previous analysis on this structure you would have see where we anticipated and highlighted this movement.
However the breakout above the resistance zone refuses to hold which trigger the reversal. markets always respects its zone especially the major resistance and support.
Meanwhile should we go on short at this point or anticipate a breakout above ?
Happy trading week
Thanks for reading.
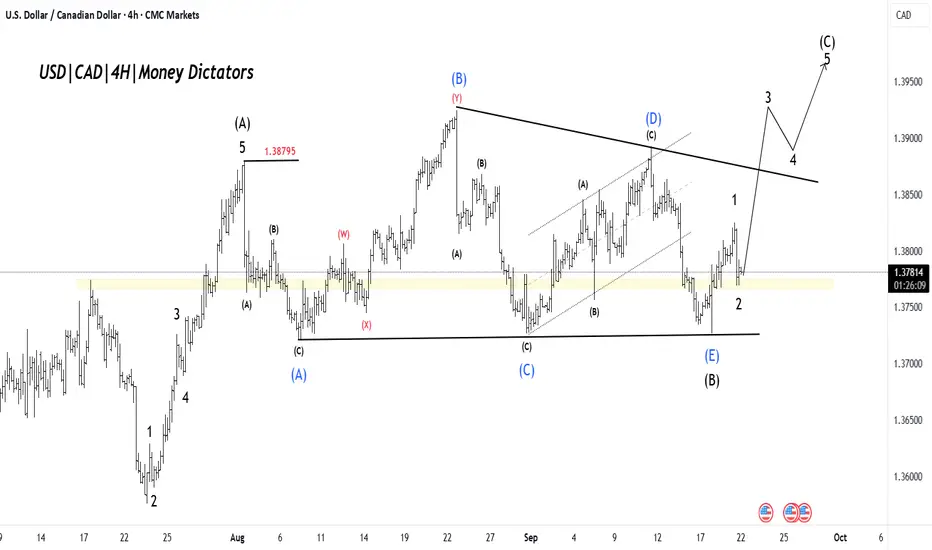
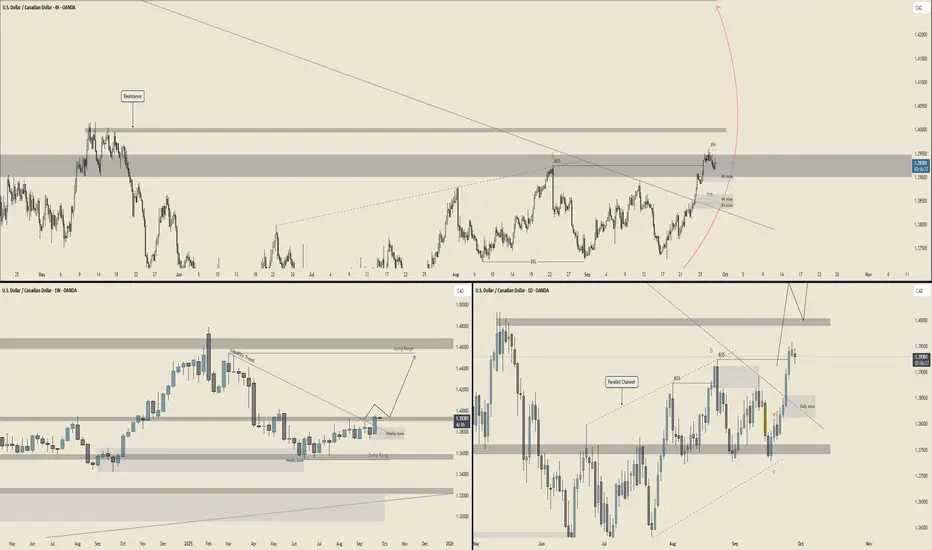
USD/CAD - Multi Timeframe Analysis🚀 USD/CAD Forecast – Multi-TF Breakdown 🚀
Alright fam, let’s break this pair down clean and simple 👇
🕰 Weekly Outlook
Big picture: USD/CAD is pressing right into that juicy weekly supply zone around 1.39 – 1.40. Price has been riding the liquidity trend, and structure suggests there’s still room to climb into the 1.42 – 1.44 swing range before any major rejection.
Bias : Bullish until we see rejection from the 1.40s.
📆 Daily Structure
On the daily, we just had a Break of Structure (BOS) to the upside. Price tapped into a clean daily demand zone near 1.38 – 1.385 and bounced hard. Now we’re marching toward that daily supply at 1.40 – 1.405.
If buyers hold momentum, expect a sweep into that zone before deciding whether we get:
🐂 A clean breakout → continuation to 1.42+.
🐻 A rejection → deeper pullback back toward 1.38 – 1.375.
⏱ 4H Play
Zooming in, the 4H shows an impulse-retracement-impulse cycle. Price just tagged resistance near 1.395. Short-term, we could get a pullback into the discount zones (1.388 – 1.384) before another leg up.
The 71% fib retrace aligns with demand — that’s where buyers likely reload for a push back at the highs.
🎯 Summary
Bias : Bullish to neutral.
Upside Target: 1.405 → 1.42 (weekly supply).
Downside Risk: 1.384 (4H demand). Lose that → deeper flush into 1.375.
Gameplan: Wait for a pullback into 1.388-1.384 for longs, or fade rejection at 1.405 for shorts.
🔥 USD/CAD is heating up — the real fight will be in that 1.40 supply zone. Will bulls break it, or will bears smack it back down?
USDCAD – Sell Zone Identified on 15M ChartPrice has reacted multiple times from the 1.3966 – 1.3950 resistance zone, forming lower highs and showing signs of exhaustion.
Currently, the pair is approaching the sell zone (1.3943 – 1.3948) where sellers are likely to defend.
🔎 SNR Breakdown:
Resistance: 1.3966 (Major Supply Zone)
Sell Zone: 1.3943 – 1.3948
Support: 1.3888 (Target Level)
📉 Expecting rejection from the marked sell zone and continuation towards support at 1.3888. A clean break above 1.3966 would invalidate this bearish outlook.
Plan: Short entries in sell zone with SL above 1.3966, TP around 1.3888.

USD/CAD Support at 1.3897: Volume Cluster + Fair Value Gap SetupUSD/CAD has a strong support at 1.3897, created by a heavy volume cluster during the recent uptrend. At the start of this cluster, buyers defended the level and formed a Fair Value Gap, adding strength to it. I’m waiting for a pullback to this level to go long, despite the minor risk of a weak low nearby. The setup still offers a solid opportunity for buyers.

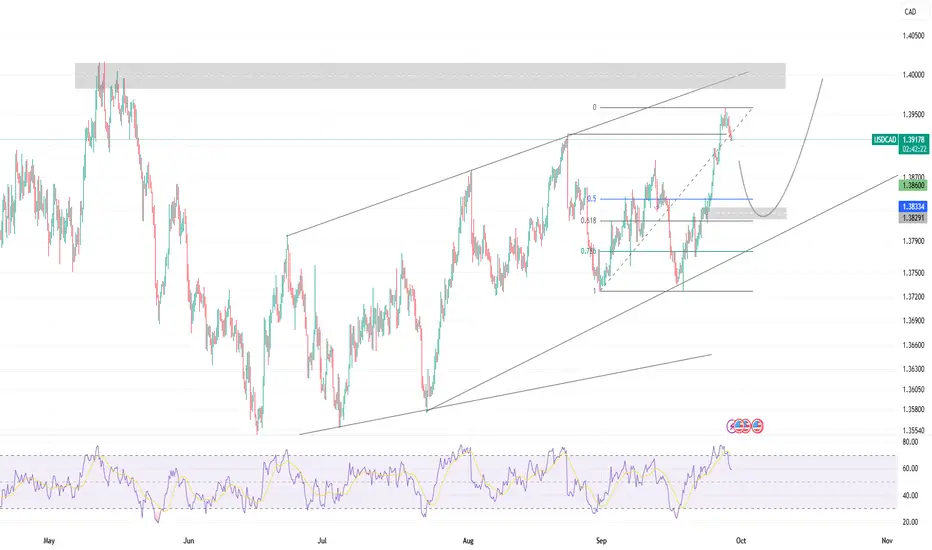
USDCAD possible scenarioKey Observations:
Price is at the top of the ascending channel – suggesting potential resistance.
Strong supply zone (gray box) around 1.3950 – 1.4000 – price has reacted from here previously.
RSI is near overbought territory – showing possible short-term exhaustion.
Fibonacci retracement levels are marked (0.5, 0.786), hinting at potential pullback targets.
Projected move (curved arrow) suggests a retracement toward 1.3860 – 1.3830 zone (demand/support), before resuming bullish momentum.
🧠 Technical Bias:
Short-term: Bearish correction likely (pullback from resistance zone).
Medium-term: Still bullish while staying inside ascending channel and above 1.3820 – 1.3830 support.
📌 Possible Trading Plan:
Sell setup: Watch for rejection candles or bearish confirmation near current price for a short toward 1.3860 – 1.3830 zone.
Buy setup: Look for bullish reversal signals at the demand zone to ride the next leg higher toward 1.3950 – 1.4000.
USD/CAD Maintains Bullish ConsolidationUSD/CAD Maintains Bullish Consolidation
USD/CAD is showing positive signs and might aim for more gains above 1.3960.
Important Takeaways for USD/CAD Analysis Today
- USD/CAD rallied above 1.3880 and 1.3920 before the bears appeared.
- There is a connecting bullish trend line forming with support at 1.3915 on the hourly chart.
USD/CAD Technical Analysis
On the hourly chart of USD/CAD, the pair formed a strong support base above the 1.3770 level. The US Dollar started a fresh increase above 1.3820 against the Canadian Dollar.
The pair cleared the 50-hour simple moving average and climbed above 1.3900. Finally, it tested the 1.3960 zone before the bears appeared. The pair traded below 1.3940 and the 50-hour simple moving average.
Initial support is near a connecting bullish trend line at 1.3915. It coincides with the 23.6% Fib retracement level of the upward move from the 1.3768 swing low to the 1.3958 high.
A downside break below the trend line might send the pair toward 1.3885. The next major area on the same USD/CAD chart could be the 50% Fib retracement at 1.3865. A close below 1.3865 could push the pair further lower. In the stated case, the bears might aim for a test of 1.3815.
On the upside, initial resistance sits near 1.3930 and the 50-hour simple moving average. The main breakout zone could be 1.3960. A clear upside break above 1.3960 could start another steady increase. The next major stop for the bulls might be 1.4000. Any more gains could open the doors for a test of 1.4050.
This article represents the opinion of the Companies operating under the FXOpen brand only. It is not to be construed as an offer, solicitation, or recommendation with respect to products and services provided by the Companies operating under the FXOpen brand, nor is it to be considered financial advice.
