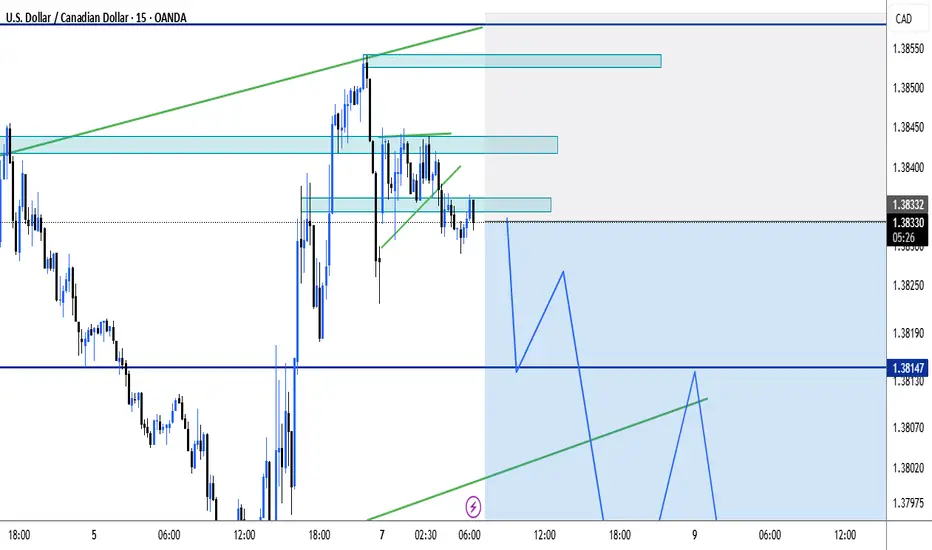
Canadian dollar target highsThe cad chases highs after bias trends to bull , the CAD targets liquidity, CAD will liquidise all highs 🚀 which contains money install the price movements start after bear is balanced for the bullish move 🚀🚀🚀
Trade ideas

09-09-2025 USDCADAs shown in the figure: 15M Bearish Cypher
The market is not always chaotic and disorderly, and there is a precise geometric beauty hidden in price fluctuations. The harmonic form long strategy is a powerful tool for accurately identifying potential market reversal points based on the Fibonacci ratio. When the form forms perfectly at the key support level, it often indicates the depletion of bearish momentum and the initiation of bullish trends.

USDCAD Technical & Order Flow AnalysisOur analysis is based on a multi-timeframe top-down approach and fundamental analysis.
Based on our assessment, the price is expected to return to the monthly level.
DISCLAIMER: This analysis may change at any time without notice and is solely intended to assist traders in making independent investment decisions. Please note that this is a prediction, and I have no obligation to act on it, nor should you.
Please support our analysis with a boost or comment!

USDCADUSD/CAD is losing momentum at resistance, suggesting sellers may drive the pair lower
#fxutrading
#usdcad
#dxy

USD/CAD – Breakout Opportunity AheadThe market is painting a clear picture: Canada’s labor data is weakening (unemployment jumping to 7.1%), while the USD still holds an advantage thanks to investor safe-haven demand. This tilts the balance strongly in favor of buyers on USD/CAD – and if timed right, this could be a golden trading setup.
On the 4H chart, price has tested the 1.3780 support multiple times without breaking it, proving this level to be a solid “launchpad.” At the same time, EMA34 and EMA89 are converging around 1.3800, adding strength to the bullish outlook. If price breaks above 1.3870, get ready – the door towards 1.3920–1.3950 will open wide.
Strategy: Buy on dip around 1.3780–1.3800, with SL just below 1.3750. First TP at 1.3870, extended TP at 1.3920+. This is a setup backed by both fundamentals and technicals, giving bulls the upper hand.

Bearish setup in play?The Loonie (USD/CAD) has rejected off the pivot and could drop to the 1st support, which acts as a multi-swing low support.
Pivot: 1.3828
1st Support: 1.3729
1st Resistance: 1.3920
Disclaimer:
The above opinions given constitute general market commentary, and do not constitute the opinion or advice of IC Markets or any form of personal or investment advice.
Any opinions, news, research, analyses, prices, other information, or links to third-party sites contained on this website are provided on an "as-is" basis, are intended only to be informative, is not an advice nor a recommendation, nor research, or a record of our trading prices, or an offer of, or solicitation for a transaction in any financial instrument and thus should not be treated as such. The information provided does not involve any specific investment objectives, financial situation and needs of any specific person who may receive it. Please be aware, that past performance is not a reliable indicator of future performance and/or results. Past Performance or Forward-looking scenarios based upon the reasonable beliefs of the third-party provider are not a guarantee of future performance. Actual results may differ materially from those anticipated in forward-looking or past performance statements. IC Markets makes no representation or warranty and assumes no liability as to the accuracy or completeness of the information provided, nor any loss arising from any investment based on a recommendation, forecast or any information supplied by any third-party.

Trade todayEntry
USDCAD A plus 08/09/2025 - 9am NY
Head and shoulders H4 3pin
Fibs 78.6
FVG at 9am
BOS above taken
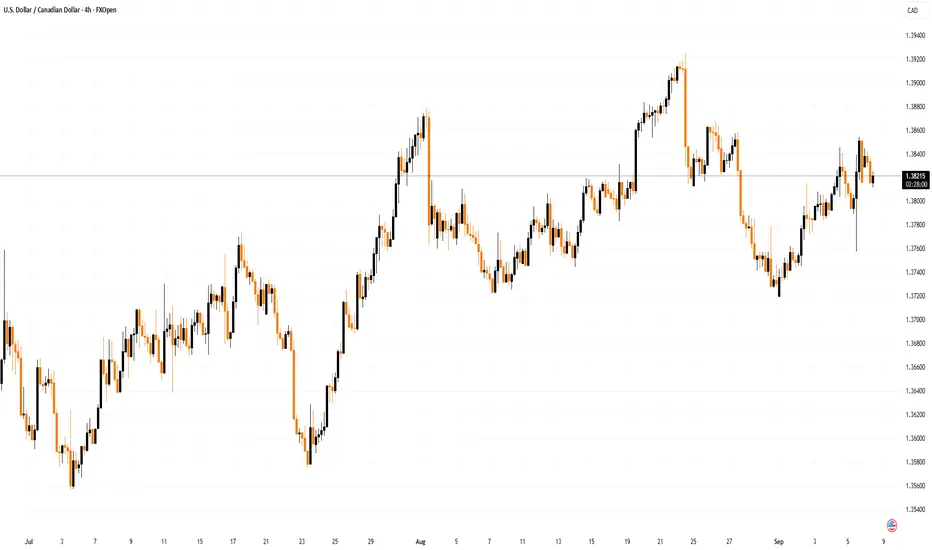
The USDCAD moved lower alongside broader U.S. dollar weakness today, but buyers stepped in at a familiar support zone. The pair tested the 200-bar moving average on the 4-hour chart near 1.37844 (green line) before bouncing higher. Recall that on Friday, following the U.S. jobs report, price slipped below this same 200-bar average but found willing buyers near the 100-day moving average at 1.37626 (lower blue line on the chart above).

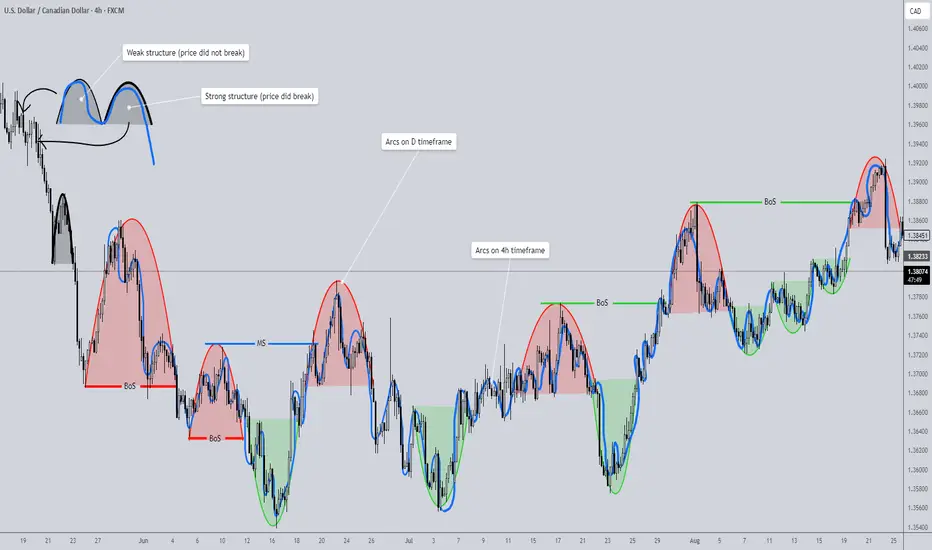
Market Structure is Actually EASY- Hear me outUnderstanding Market Structure Through Arcs
Market structure always seems simple when explained on YouTube. But open up a chart, and suddenly it feels puzzling, inconsistent, even frustrating. Imagine this: you’re analyzing the structure of a forex pair, confidently tracking highs and lows. Everything makes sense. Then you switch to a different pair—or even just a different date on the same chart—and suddenly it feels like your skill vanished. Yesterday you “understood” market structure, but today you don’t. So, what’s happening?
The truth is, when this confusion sets in, it’s usually because you’re looking for the wrong signs. Traders often get caught up searching for zigzags, breaks of structure (BoS), market shifts, supply and demand zones, or liquidity sweeps. But the key to truly understanding market structure comes down to one core skill: identifying strong and weak structures.
Redefining Market Structure
Market structure is not simply a zigzag. It’s not just supply and demand. Market structure is a collection of structures that, when viewed together, naturally form zigzags, supply/demand areas, and BoS/market shift levels.
And here’s the important part: not all structures are created equal. But don’t worry—you don’t need to memorize dozens of “types.” There are only two: strong structures and weak structures.
How to Identify Structures
This is where things get surprisingly simple. To identify structure, look for arcs. Yes—the charting tool no one ever uses. An arc represents price dipping and then returning to its prior high or low.
• If price closes beyond the previous high/low, the structure is strong.
• If price fails to break the previous high/low and closes within it, the structure is weak.
That’s it. Look at the chart example provided—you’ll see how clear this becomes once you train your eye. The Red/Green arcs represent arcs that were identified on the D timeframe (HTF). The blue squiggly line represents a collection of arcs identified on the 4h timeframe (LTF).
Multi-Timeframe Power
Here’s where arcs become even more powerful. A structure on one timeframe (say, the 4H) is essentially a supply/demand zone. Drop down to a lower timeframe (4H → 1H), and that same structure becomes a full swing move. This allows you to navigate multiple timeframes seamlessly—simply by plotting structures on the higher timeframe.
The Arc as the Foundation
Once you learn to spot arcs, everything clicks into place. An arc is supply and demand. It is liquidity boundaries. It defines strong/weak highs and lows. It creates the zigzag. In short: structure identification is the only skill you need to master market structure—and it’s surprisingly quick to learn.
Additional Notes
• A valid arc requires at least three candles. Anything less is not structure.
• Two candles may represent a reaction to supply/demand or a liquidity sweep, but they don’t form a structure.
• Why? Because structure requires balance—a brief pause where price enters, slows, stabilizes, and then reverses. That balancing process cannot be captured in one or two candles.
My Advice
For now, set aside the broader concept of “market structure” and focus only on arcs.
1. Practice identifying arcs in live price action—don’t worry about backtesting yet.
2. Mark them on your chart, and classify them as strong or weak.
3. Once you’re comfortable spotting them, move into backtesting. Watch arcs unfold in motion.
4. With enough practice, you’ll be able to recognize them instantly and without hesitation.
That’s when you return to market structure as a whole. With the skill of arc recognition in place, you’ll finally see how everything ties together—and your understanding will be unshakable.
Previous Post; Complete Market Structure: Order Flow and Multiple Timeframes
Although I felt that this was a great take on market structure, the indicator provided falls short in a sense that market it relies on alternating internal shifts, when in market structure shifts can happen consecutively instead of strictly alternating. I have developed a different tool that will help identify structural levels without missing a single arc. It is called Supply/Demand Zones (Synthetic SMA Candles). I will provide a link below. It identifies arcs and classifies them as supply/demand zones. It also provides alerts which can be helpful if you are the type of trader that likes to trade passively without being glued to the charts.
Arc Identifying Indicator (Supply/Demand)
Possible SHORT on USDCADSo, there's kind of a Bearish Flag pattern break and it has broken out so I'm expecting a minor Sell. 🤞🏾
Canadian Dollar Falls After Labour Market Data ReleaseCanadian Dollar Falls After Labour Market Data Release
On Friday, disappointing figures showed that in August the Canadian economy lost 65,500 jobs (the forecast had been for an increase of 10,000), while the unemployment rate rose to 7.1%. This is the highest level of unemployment since May 2016, excluding the pandemic period.
It is believed that:
→ the deterioration in the labour market (primarily in manufacturing) is a consequence of the trade war with the United States;
→ the fall in employment in Canada has increased the likelihood that the Bank of Canada will resume its monetary easing campaign.
As a result, the CAD weakened sharply against other currencies. However, the depreciation against the US dollar was less pronounced, as the USD itself is under pressure from various factors.
Technical Analysis of USD/CAD
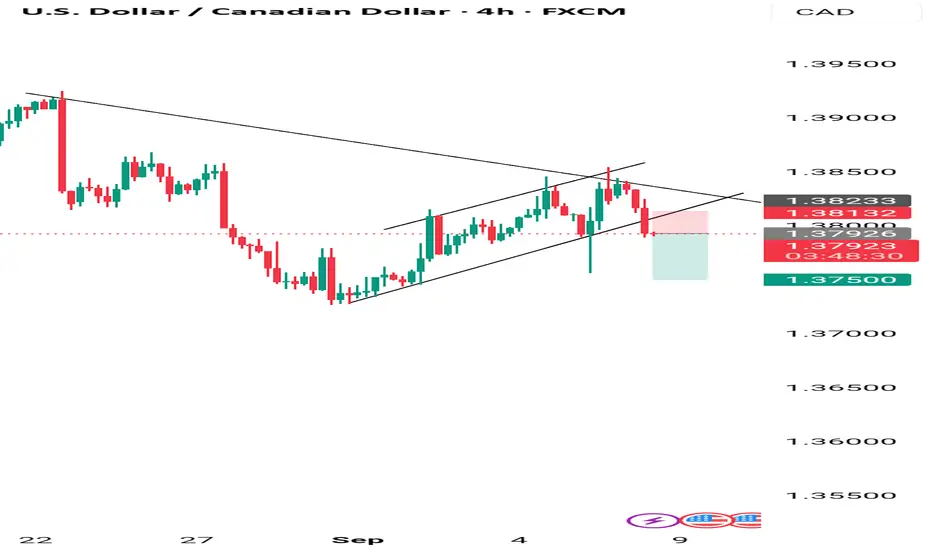
From a long-term perspective, the USD/CAD pair remains within a downward trend, highlighted by a red descending channel.
From a medium-term perspective, since July the rate has risen from the 1.3550–1.3600 support zone, forming an ascending channel (shown in blue).
Price action (indicated by arrows) shows that:
→ sellers are aggressive, pushing the price down from the upper boundary of the red channel;
→ buyers are aggressive, driving the price up from the lower boundary of the blue channel. Its median line acts as resistance.
This is compressing USD/CAD fluctuations into a pattern resembling a symmetrical narrowing triangle (shown in black), with recent overbought (1) and oversold (2) conditions on the RSI marking price reversals back into the triangle from its boundaries.
Thus, we could assume that supply and demand forces will keep USD/CAD in a state of temporary balance while awaiting key news next week:
→ 16 September – Canada CPI report;
→ 17 September – interest rate decisions from both the Bank of Canada and the Federal Reserve.
This article represents the opinion of the Companies operating under the FXOpen brand only. It is not to be construed as an offer, solicitation, or recommendation with respect to products and services provided by the Companies operating under the FXOpen brand, nor is it to be considered financial advice.

Rising ChannelSell opportunity on a rising channel with a symmetrical bear flag supported by higher time. Stop loss a little wide to give the trade more room.
USDCAD Will Go Down From Resistance! Short!
Here is our detailed technical review for USDCAD.
Time Frame: 1D
Current Trend: Bearish
Sentiment: Overbought (based on 7-period RSI)
Forecast: Bearish
The market is on a crucial zone of supply 1.383.
The above-mentioned technicals clearly indicate the dominance of sellers on the market. I recommend shorting the instrument, aiming at 1.373 level.
P.S
The term oversold refers to a condition where an asset has traded lower in price and has the potential for a price bounce.
Overbought refers to market scenarios where the instrument is traded considerably higher than its fair value. Overvaluation is caused by market sentiments when there is positive news.
Disclosure: I am part of Trade Nation's Influencer program and receive a monthly fee for using their TradingView charts in my analysis.
Like and subscribe and comment my ideas if you enjoy them!

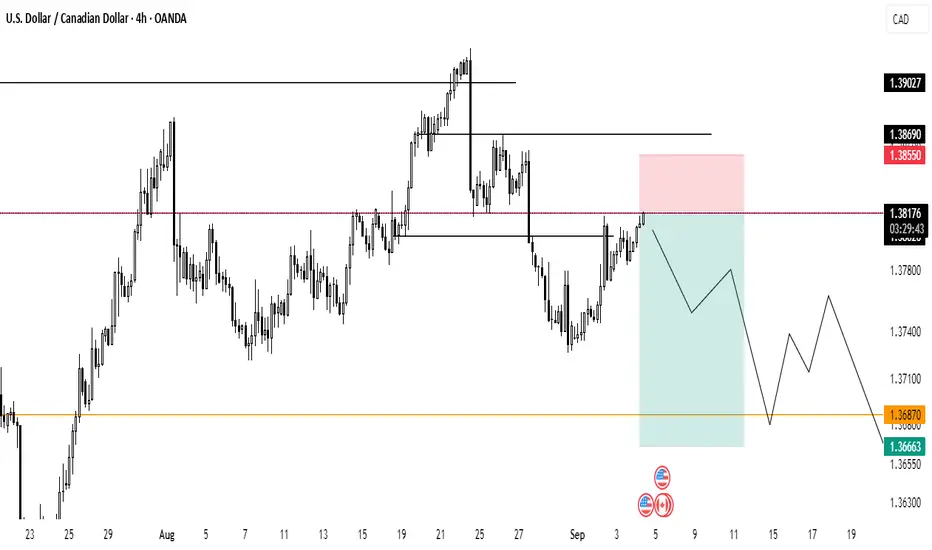
USDCAD Double Top Signals a Potential BreakdownUSDCAD pair is testing a critical resistance area near 1.3830 after a strong rebound. But the price structure is beginning to flash signs of exhaustion. With repeated rejections and a clear double-top pattern forming, the setup favors a bearish move. If momentum turns, we could see a meaningful correction toward the 1.3730 support zone, with deeper downside risk into mid-September.
Current Bias
Bearish rejection at resistance, structure favors downside continuation.
Key Fundamental Drivers
Canada: Weak August jobs report (unemployment 7.1%, wages cooling) raised BoC cut expectations, pressuring CAD. But oil prices (Brent ~$65) limit the downside risk, giving CAD some commodity support.
U.S.: Weaker jobs (+142k NFP, unemployment 4.3%) keeps Fed cuts on the table, capping USD upside. Core PCE sticky at 2.9%, but inflation trend is moderating.
Macro Context
Interest Rates: Fed expected to cut in coming months; BoC markets price ~90% chance of a September cut.
Economic Growth: U.S. slowing but still resilient, Canada contracting (Q2 GDP −0.4% q/q).
Commodities: Oil’s soft rebound provides CAD with some stability.
Geopolitics: Trade tensions (U.S. tariffs, China-Russia bond coordination) keep USD supported as a defensive hedge.
Primary Risk to the Trend
A sharp oil sell-off would weaken CAD and trigger USD/CAD upside.
U.S. CPI surprise to the upside could reprice Fed expectations, boosting USD.
Most Critical Upcoming News/Event
U.S. CPI (this week): Will decide Fed cut timing.
BoC September rate decision: High probability of a cut, market focus on forward guidance.
Leader/Lagger Dynamics
USD/CAD is typically a lagger — following USD direction (via Fed expectations) and CAD flows (via oil). It often mirrors oil price action and diverges from USD/JPY, reflecting risk sentiment shifts.
Key Levels
Support Levels: 1.3732, 1.3585
Resistance Levels: 1.3830, 1.3875
Stop Loss (SL): 1.3875
Take Profit (TP): 1.3732 (first), 1.3585 (extended)
Summary: Bias and Watchpoints
USD/CAD is leaning bearish after failing to break cleanly above 1.3830. Fundamentals point to a tug-of-war between dovish BoC expectations and weaker U.S. data, but the chart structure favors downside into 1.3732 and potentially 1.3585. My stop loss sits above 1.3875 to protect against a breakout. Watch U.S. CPI as the key driver: a hotter print could revive USD strength, while a softer read could accelerate CAD gains. Oil’s stability remains a secondary but important factor for CAD resilience.

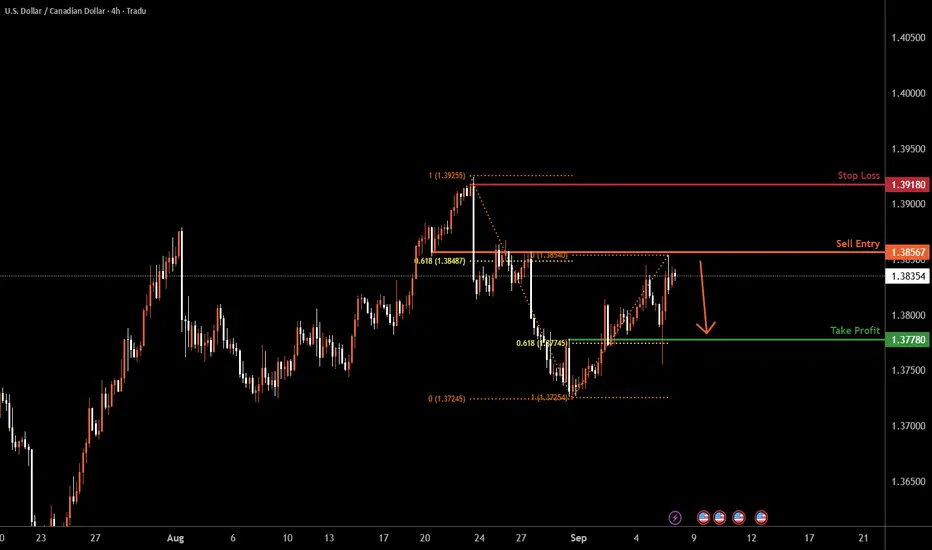
USDCAD H4 | Bearish reversal at key resistanceLoonie (USD/CAD is reacting off the sell entry, which is an overlap resistance that lines up with the 61.8% Fibonacci retracement and could reverse from this level to the downside.
Sell entry is at 1.3828, which is an overlap resistance that aligns with the 61.8% Fibonacci retracement.
Stop loss is at 1.3918, a swing high resistance.
Take profit is at 1.3778, which is an overlap support that aligns with the 61.8% Fibonacci retracement.
High Risk Investment Warning
Trading Forex/CFDs on margin carries a high level of risk and may not be suitable for all investors. Leverage can work against you.
Stratos Markets Limited (tradu.com ):
CFDs are complex instruments and come with a high risk of losing money rapidly due to leverage. 65% of retail investor accounts lose money when trading CFDs with this provider. You should consider whether you understand how CFDs work and whether you can afford to take the high risk of losing your money.
Stratos Europe Ltd (tradu.com ):
CFDs are complex instruments and come with a high risk of losing money rapidly due to leverage. 66% of retail investor accounts lose money when trading CFDs with this provider. You should consider whether you understand how CFDs work and whether you can afford to take the high risk of losing your money.
Stratos Global LLC (tradu.com ):
Losses can exceed deposits.
Please be advised that the information presented on TradingView is provided to Tradu (‘Company’, ‘we’) by a third-party provider (‘TFA Global Pte Ltd’). Please be reminded that you are solely responsible for the trading decisions on your account. There is a very high degree of risk involved in trading. Any information and/or content is intended entirely for research, educational and informational purposes only and does not constitute investment or consultation advice or investment strategy. The information is not tailored to the investment needs of any specific person and therefore does not involve a consideration of any of the investment objectives, financial situation or needs of any viewer that may receive it. Kindly also note that past performance is not a reliable indicator of future results. Actual results may differ materially from those anticipated in forward-looking or past performance statements. We assume no liability as to the accuracy or completeness of any of the information and/or content provided herein and the Company cannot be held responsible for any omission, mistake nor for any loss or damage including without limitation to any loss of profit which may arise from reliance on any information supplied by TFA Global Pte Ltd.
The speaker(s) is neither an employee, agent nor representative of Tradu and is therefore acting independently. The opinions given are their own, constitute general market commentary, and do not constitute the opinion or advice of Tradu or any form of personal or investment advice. Tradu neither endorses nor guarantees offerings of third-party speakers, nor is Tradu responsible for the content, veracity or opinions of third-party speakers, presenters or participants.
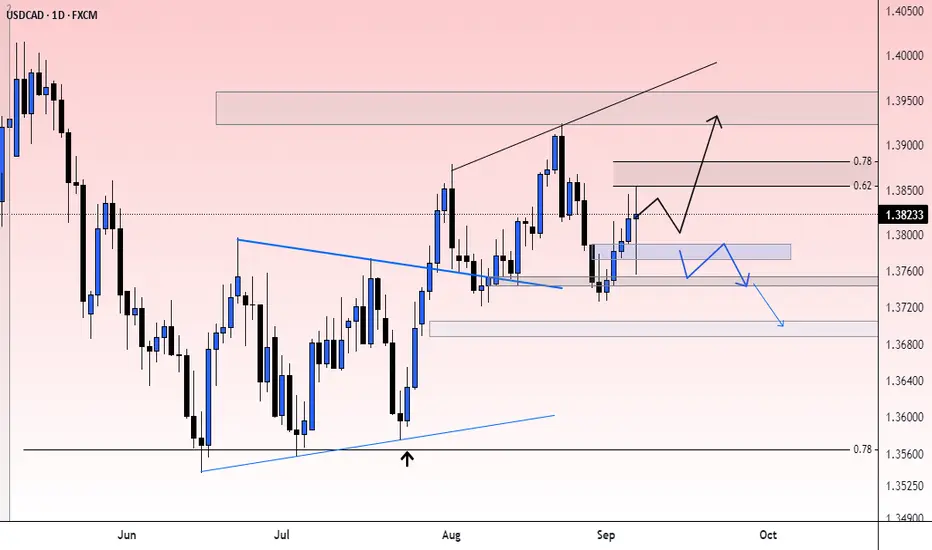
possibility of uptrend It is expected that after some resistance levels will be broken and we will witness the start of the upward trend. If the support range is broken, the correction and fluctuation trend will continue.
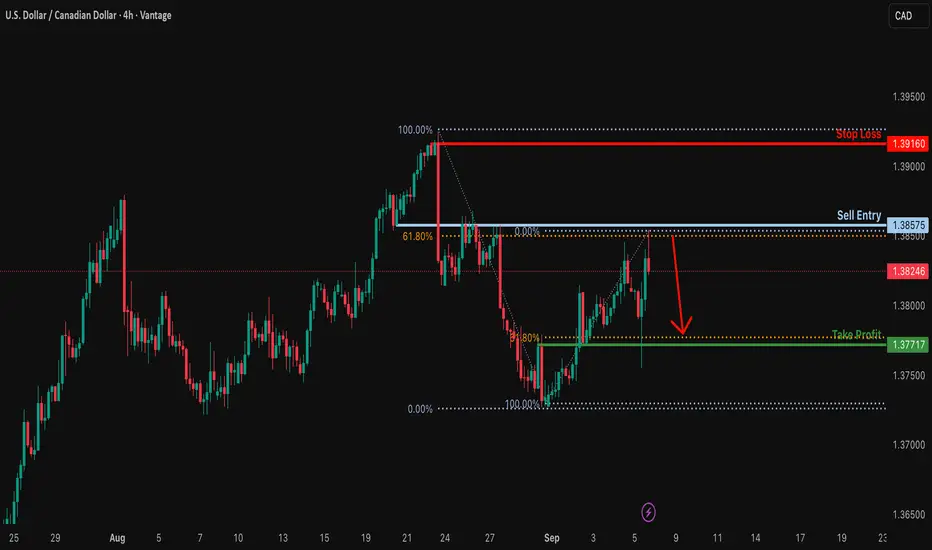
Bearish reversal setup?USD/CAD has rejected off the resistance level which is an overlap resistance that lines up with the 61.8% Fibonacci retracement and could drop from this level to our take profit.
Entry: 1.3857
Why we like it:
There is an overlap resistance level that aligns with the 61.8% Fibonacci retracement.
Stop loss: 1.3916
Why we like it:
There is a swing high resistance.
Take profit: 1.3771
Why we like it:
There is a pullback support that aligns with the 61.8% Fibonacci retracement.
Enjoying your TradingView experience? Review us!
Please be advised that the information presented on TradingView is provided to Vantage (‘Vantage Global Limited’, ‘we’) by a third-party provider (‘Everest Fortune Group’). Please be reminded that you are solely responsible for the trading decisions on your account. There is a very high degree of risk involved in trading. Any information and/or content is intended entirely for research, educational and informational purposes only and does not constitute investment or consultation advice or investment strategy. The information is not tailored to the investment needs of any specific person and therefore does not involve a consideration of any of the investment objectives, financial situation or needs of any viewer that may receive it. Kindly also note that past performance is not a reliable indicator of future results. Actual results may differ materially from those anticipated in forward-looking or past performance statements. We assume no liability as to the accuracy or completeness of any of the information and/or content provided herein and the Company cannot be held responsible for any omission, mistake nor for any loss or damage including without limitation to any loss of profit which may arise from reliance on any information supplied by Everest Fortune Group.
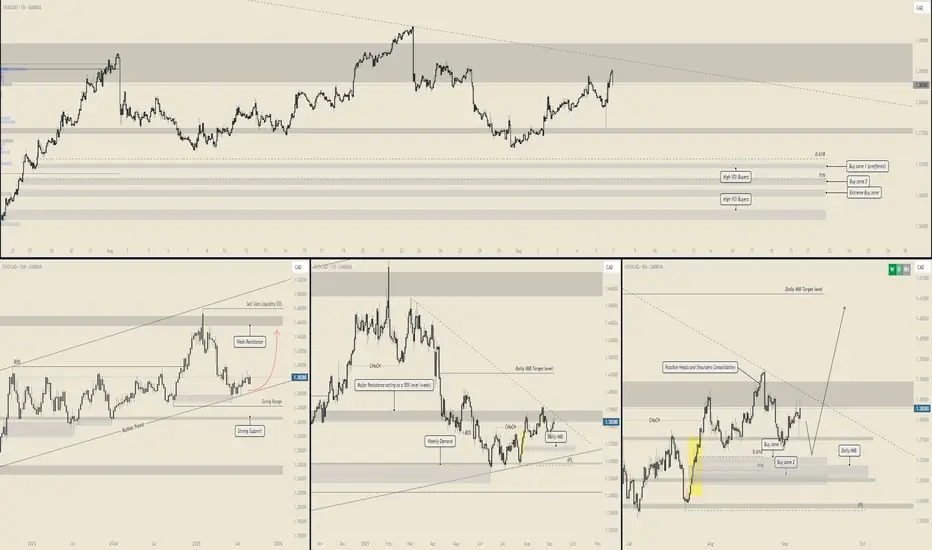
USD/CAD - Clean price actions with LTF consolidation📈 USD/CAD – Coiling for the Next Expansion
🕰 Weekly View
Price remains in a long-term bullish trend, holding above strong support.
Weekly structure shows resistance overhead at 1.50–1.52, but liquidity is building toward that level.
Current zone is mid-range, rejecting weekly supply.
📊 Daily Structure
Recent CHOCH + BOS confirm buyers stepping back in after tapping weekly demand.
Price consolidating near 1.38, building energy.
Daily IMB target sits at 1.41, aligning with upside liquidity.
Below, two strong buy zones line up with fib 0.618–0.71 retracement:
Buy Zone 1 (preferred): 1.37–1.3720
Buy Zone 2: 1.3650–1.3680 (extreme demand).
⏱ 8H Breakdown
Structure forming a potential head & shoulders consolidation, but neckline is unbroken.
If price dips into buy zones, expecting sharp reversal higher.
Liquidity below sitting at 1.37–1.3680, prime trap for late sellers.
Upside target: 1.41–1.4150 IMB.
🎯 Trade Plan
Entry: Wait for sweep into 1.37 demand (preferred).
Stop: 1.3645 (below extreme demand).
Target: 1.4100–1.4150 (daily IMB).
RR: 1:4+ depending on entry.
⚡ Bias
Bullish – waiting for a corrective dip into demand before continuation to 1.41+.
Invalidation: sustained close below 1.3640.
USDCAD bearish possibility There are a two bottom liquidity's not sweep, so it's mean the price should go down to sweep their liquidity . Also maybe we will have a head & shoulder pattern
Also, when the price going to sweep liquidity, there is FVG that must be visited, which confirms the process of liquidity sweep.
Let's see what will happen, and will update later

USD/CAD – Sideways Accumulation, Preparing for a Mild UpsideThe August Nonfarm Payrolls report came in at only 22K, far below expectations of 75K and the previous 79K, causing the USD to weaken. However, Canadian labor data was also underwhelming, leaving the CAD too weak to drag the pair significantly lower. As a result, USD/CAD has maintained balance and is moving within a narrow range.
On the H4 chart, the price is fluctuating around 1.38280, closely tracking the long-term descending trendline. The EMA34 and EMA89 are moving sideways, reflecting an accumulation phase. If support at 1.3787 holds, USD/CAD could rebound and push up towards 1.3833 before confirming the next trend direction.

usd/cad shows uptrendOverall, within the higher time frames, USDCAD is still at its lowest and has shown considerable potential. Currently, it has shown an uptrend, and it has been respecting the support lines within the hourly time frames. As of now, on the 1-hour time frame, it has become bearish. In my opinion, I would wait to see if it touches my yellow support line, or perhaps it could touch my blue support line; otherwise, we should wait until we see a bullish candle after this bearish engulfing candle.

USDCAD 4HTrading Outlook for the Upcoming Week
In this series of analyses, we review trading perspectives and short-term outlooks.
As can be seen, in each analysis there is a key support/resistance zone near the current price of the asset. The market’s reaction to—or breakout from—this zone will determine the next price movement toward the specified levels.
Important Note: The purpose of these trading outlooks is to highlight key levels ahead of the price and the market’s potential reactions to them. The analyses provided are by no means trading signals!
