Trade ideas

"USDCAD - Waiting for the Mid-Term Sweep Before Re-Alignment"USDCAD — HTF/Mid-Term Outlook
HTF (4H): Bullish
Strong liquidity sits at 1.38864.
We’re currently in a pullback phase, not a continuation. Traders operating only on LTFs will likely feel confusion here if they aren’t interpreting structure correctly — because the higher-timeframe leg is still retracing.
MTF (30M/15M): Developing
I’m waiting for sell-side liquidity (SSL) to be swept so price can drop into the mid-term order block sitting below.
This phase is still developing — no reason to rush ahead before the sweep and proper mitigation confirm alignment.
LTF (5M): Pending
Once the sweep + mitigation hits, I’ll shift to the 5M to look for:
• Trend change
• Lower-high break
• Pullback into the nearest structure OB
• Execution with alignment to the 4H bias
Until then, we stay disciplined.
Smart Money directs the delivery — we wait for price to complete its cycle, then act.
Let’s go.
USDCAD Ascending channel pattern buy on consolidation breakoutUSOIL Technical Outlook – 4H Timeframe
USOIL continues to show strong downside momentum, with sellers maintaining control. Price is currently respecting the downtrend structure, and a consolidation breakdown below 59,100 is confirming further bearish pressure.
📉 Key Technical Levels:
Immediate Support: 58,300
Next Major Support: 56,400
As always, ensure you are using proper risk management and wait for clear confirmations before entering any position.
👍 Like • Follow • Comment • Share
Stay updated for more professional market insights.

USDCAD 4HPrice broke out of the falling channel bullish reversal pattern after making a bullish reaction off the 4 hour order block (orange zone), breaking the lower timeframe structure to the upside forming a higher high. Price has now made a pullback for a higher low, where I will be anticipating for a bullish continuation to resume the higher timeframe trend aiming for the zones above.

1:2.5 rrr USDCAD Long (70 pips)price bounce on support
price break wedge pattern and a minor resistance
price retest minor resistance

USDCAD SELLS CONTINUATION?USDCAD has been bearish since last week. On the 1hour timeframe, price broke lower and is currently retracing to probably continue downwards. We are currently waiting for price to take out liquidities, trigger our order and maybe continue to dip lower. Orders are set, fingers are crossed.
NO TRADE IS GUARANTEED!
USE PROPER RISK MANAGEMENT!!

USDCAD: Hold On Short Position, Target At 1.3901USDCAD is ascending on a momentum channel of support and resistance, the bigger time frame of the market shows uptrend, with the formation of higher highs and higher lows regions. contemporary the price is heading towards the next support, at 1.3901 as we spot in the structure.
Key points;
Hold on sell position until the price gets to our target.
For the meantime, you can place a quick sell, target 1.3901-1.3885.
Thanks for reading.

USD/CAD 4H: Watching for a Potential Bounce SetupGood morning,
On the 4-hour chart, USDCAD looks like it could be setting up for a textbook move — price is pulling back toward the uptrend line and approaching a strong support zone.
If price action reaches that confluence area and shows rejection, we could see a magical bounce upward that continues the existing uptrend.
Once structure confirms, we’ll drop down to the 1H and 15M charts to look for VMS signals and entry triggers — volume over 85, momentum aligning, and a clean engulfing candle.
Patience is key. The structure will tell us when it’s ready.
#USDCAD #VMS #ForexAcademy #ForexTrading #TrendlineBounce #StructureFirst #AlignedExecution

USD/CAD 1h **rising wedge** pattern **inside a higher-timeframe.The market is currently forming a **rising wedge** pattern **inside a higher-timeframe resistance zone** (the yellow area).
### **What this structure usually indicates**
A **rising wedge** inside resistance is typically a **bearish reversal pattern**, meaning:
* Price is moving upward but with **weak momentum**.
* Buyers are losing strength.
* Sellers may soon take control.
### **Most likely scenario**
✔ **High probability:** A **breakdown below the lower wedge trendline**, leading price back toward
**1.3990 → 1.3950** levels.
### **Why?**
* Price is repeatedly rejecting the same resistance zone (yellow box).
* The wedge is narrowing → indicates exhaustion.
* The EMA cluster shows **sideways / weak bullish pressure**.
### **Confirmation to watch for**
1. Candle close **below wedge support**
2. Retest of the broken trendline
3. Bearish continuation
### **Invalidation**
If price **breaks above the wedge top** and closes above **1.4050**, structure becomes bullish.
---

a BuySide QuickScalp #USDCAD📌 Market Insight: {#USDCAD }
⚠️ Risk Assessment: {High}
🚀 Approach:
Not a Quality one ... need to have a Momentum Structure first .... Don't rush .
#Ash_TheTrader #Forex #GBPJPY #MarketAnalysis #TradingSetup #RiskManagement #GOLD #Scalper #NQ #EURUSD

SHORT = SWING TRADEPrice rejected on weekly time frame and spotted price action of Pin Bar that formed on the higher timeframe on Key Resistance causinga fakeout. Taking into consideration I spotted CRT on the Weekly Timeframe which gives me clear direction of price being Bearish from the decline od the Resistance zone.
We have accumulated the first move which was a buy.
The second move was the manipulation candle which declined above the Resistance level.
The third and final Zone is my DISTRIBUTION zone. Knowing we Taking sells on this pair I subject price not to hit my TP but 50% profit target can be archived.

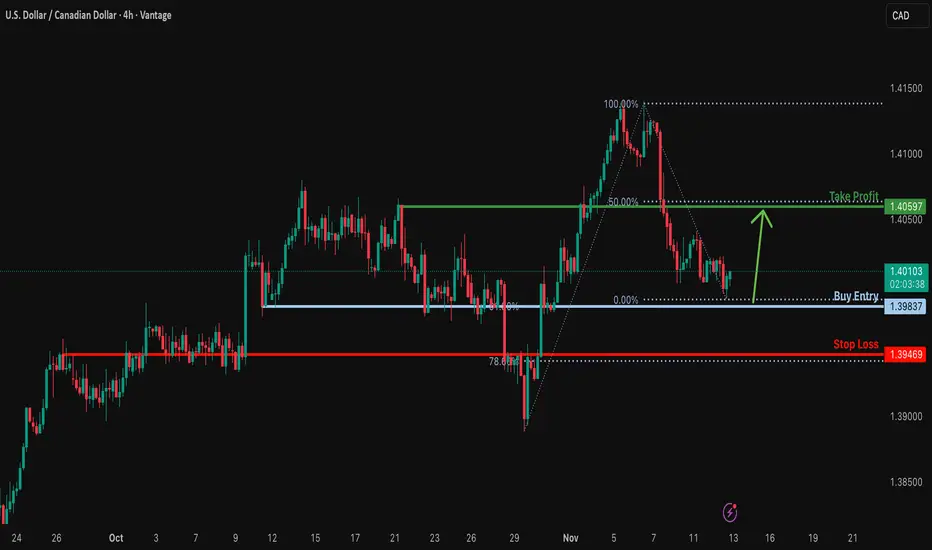
Bullish bounce off key support?USD/CAD is falling towards a support level, which is an overlap support that aligns with the 61.8% Fibonacci retracement. The pair could potentially bounce from this level toward our take-profit target.
Entry: 1.3983
Why we like it:
There is an overlap support that aligns with the 61.8% Fibonacci retracement level.
Stop Loss: 1.3946
Why we like it:
This level coincides with an overlap support and the 78.6% Fibonacci retracement, providing additional confluence.
Take Profit: 1.4059
Why we like it:
There is a pullback resistance that aligns with the 50% Fibonacci retracement level.
Enjoying your TradingView experience? Review us!
Please be advised that the information presented on TradingView is provided to Vantage (‘Vantage Global Limited’, ‘we’) by a third-party provider (‘Everest Fortune Group’). Please be reminded that you are solely responsible for the trading decisions on your account. There is a very high degree of risk involved in trading. Any information and/or content is intended entirely for research, educational and informational purposes only and does not constitute investment or consultation advice or investment strategy. The information is not tailored to the investment needs of any specific person and therefore does not involve a consideration of any of the investment objectives, financial situation or needs of any viewer that may receive it. Kindly also note that past performance is not a reliable indicator of future results. Actual results may differ materially from those anticipated in forward-looking or past performance statements. We assume no liability as to the accuracy or completeness of any of the information and/or content provided herein and the Company cannot be held responsible for any omission, mistake nor for any loss or damage including without limitation to any loss of profit which may arise from reliance on any information supplied by Everest Fortune Group.
SELL SETUP – Reaction from Key ZoneAnalysis:
Price made a strong bullish move to retest the previous supply area, where multiple rejections can be seen. Liquidity above the previous high has been cleared, and candles show weakening bullish momentum. This zone acts as a reaction point where sellers may regain control.
If the market fails to create a new higher high and breaks minor structure to the downside, it can confirm a potential short continuation.
Trade Plan:
Entry: After bearish confirmation (structure break or engulfing candle)
Stop Loss: Above the recent liquidity high
Take Profit: Toward next key demand / support zone
Risk–Reward: Minimum 1 : 2 for clean continuation
Concept Used:
Liquidity grab • Zone rejection • Structure confirmation
Price tapped into a strong supply zone, clearing liquidity and showing clear rejection. Watching for bearish confirmation to ride the next move down toward demand. Simple setup — clean reaction, clear plan. 🔥

USD CAD Long in bull channel Buying USD CAD long for a 1:2 RR. USD CAD is in a bull channel, and buying the currency at the bottom of the channel for a positive upside

USD/CAD Hints at Swing LowA simple setup may have emerged for USD/CAD bulls. A bullish outside day formed around a support cluster on Thursday, which includes the 1.40 handle, monthly pivot point and weekly VPOC. It also posted a daily close above its 20-day EMA.
The 1-hour chart shows a bullish divergence formed on the RSI (14) ahead of yesterday's rally, with price action displaying a falling wedge (bullish reversal) into the cycle lows.
Bulls could seek dips towards the 1.4005 high-volume node (HVN) and initially target the weekly pivot point (1.4062), a break above which brings the 1.41 handle into focus.
A break beneath the cycle lows invalidates the near-term bullish bias.
Matt Simpson, Market Analyst at City Index.

USDCAD: Consolidation Continues 🇺🇸🇨🇦
I think that sideways price action will continue on USDCAD.
The price is going to pull back from an intraday support at least
one more time.
Expect a rise at least to 1.4027 level.
❤️Please, support my work with like, thank you!❤️
I am part of Trade Nation's Influencer program and receive a monthly fee for using their TradingView charts in my analysis

USDCAD WEDGE BREAKOUT|LONG|
✅USDCAD broke out of a bullish wedge, signaling a potential continuation toward higher imbalance zones above 1.4050$. Liquidity resting above equal highs could be targeted next. Time Frame 4H.
LONG🚀
✅Like and subscribe to never miss a new idea!✅

USDCAD still going DOWN.USDCAD is in a pullback and showing signs of pulling back down with about 1:2 RR.

USDCAD Bearish FlagThe retest setup of that inverse head and shoulders pattern is finally playing out and now we also have double confluence thanks to that bear flag.
Less Yap, More Trades

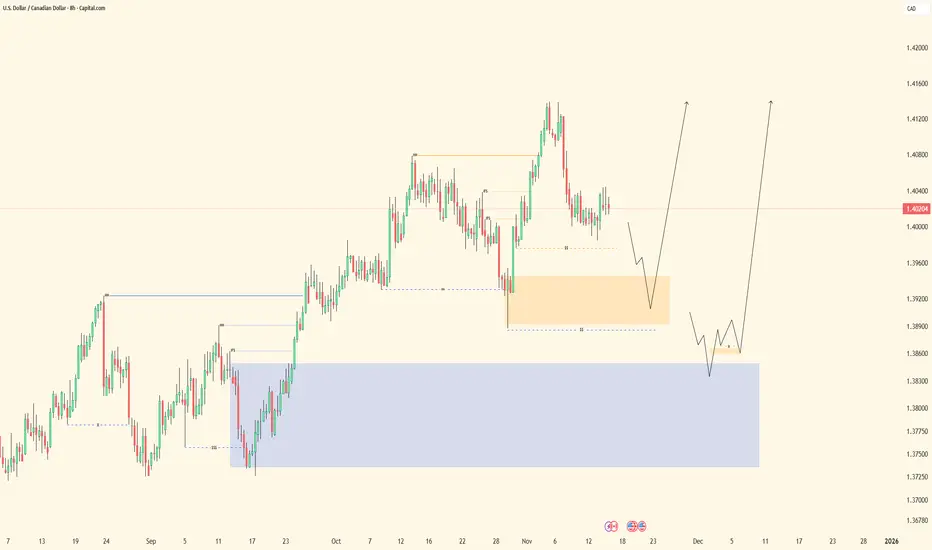
There is potential for a correction in the coming months.We are entering one of the most exciting market phases: the start of new major impulse waves in various currency pairs.
For the USD/CAD pair, the corrective phase is coming to an end, and the next major move is forming. What happens next could define opportunities for the next 3–6 months.
Additional Context Analysis:
This analysis uses Elliott Wave terminology, which divides market movements into impulse waves (movements in line with the trend) and corrective waves (movements against the trend).
The key message is that the recent USD/CAD price volatility is merely a correction ahead of a much larger and more profitable impulse move.

USDCAD H4 | Bullish Bounce off Key SupportMomentum: Bullish
Price is currently above the Ichimoku cloud.
Buy entry: 1.4009
- Pullback Support
- 50% Fib retracement
Stop Loss: 1.3945
- Pullback Support
- 78.6% Fib retracement
Take Profit: 1.4095
- Pullback Resistance
Stratos Markets Limited (tradu.com/uk ):
CFDs are complex instruments and come with a high risk of losing money rapidly due to leverage. 68% of retail investor accounts lose money when trading CFDs with this provider. You should consider whether you understand how CFDs work and whether you can afford to take the high risk of losing your money.
Stratos Europe Ltd (tradu.com/eu ):
CFDs are complex instruments and come with a high risk of losing money rapidly due to leverage. 70% of retail investor accounts lose money when trading CFDs with this provider. You should consider whether you understand how CFDs work and whether you can afford to take the high risk of losing your money.

usdcad possible moveHere’s a detailed technical analysis of your USD/CAD (1H timeframe) chart:
🧭 Overall Market Structure
The chart shows a clear bullish phase followed by a reversal into bearish structure.
Price created higher highs and higher lows up to around 1.4140, after which it shifted structure and began forming lower highs and lower lows.
Currently, the market is ranging around the 1.4000–1.4020 zone after the strong decline.
📉 Bearish Market Shift (Break of Structure)
The last bullish impulse peaked near 1.4140, and the following drop broke below the previous higher low (around 1.4070).
This confirmed a bearish BOS (Break of Structure) → indicating Smart Money reversal.
Since then, the price has been retracing within a bearish correctional range.
🧱 Key Zones
1. Resistance (Supply Zone)
1.4100 – 1.4120 → Previous area of strong rejection; sellers took control here.
1.4060 – 1.4075 → Minor supply created after the market shifted bearish; ideal for potential retests.
2. Support (Demand Zone)
1.3980 – 1.3995 → Strong demand; multiple rejections seen.
1.3915 – 1.3925 → Secondary demand if price continues lower.
💧 Volume Analysis (VSA Insight)
Notice the high volume at the lows around Oct 30 and Nov 7–8, which indicates buying absorption (possible institutional accumulation zones).
Recent candles show reduced volume with small-bodied bars, suggesting no strong conviction — the market is consolidating.
📊 Potential Scenarios
Bullish Retracement Scenario
If price holds above 1.4000, we could see a retracement to 1.4050–1.4070 (previous supply) before continuing lower.
Watch for liquidity sweep above 1.4060 to confirm bearish continuation.
Bearish Continuation Scenario
A clean break and close below 1.3980 with volume could signal continuation toward 1.3920.
Look for Lower High formation around 1.4040–1.4060 for entry confirmation.
📈 Bias Summary
Aspect Bias
Market Structure Bearish
Volume Profile Distribution → Consolidation
Short-term Trend Sideways to bearish
Ideal Trade Setup Sell on retracement to 1.4050–1.4070
Invalidated If Price closes above 1.4100 (structure shift again)

USDCAD - Bullish Continuation Using Multiple Forms of DivergenceHere on the USDCAD we have a bullish continuation trade which represents a perfect example of how countertrend & trend continuation trading can be used together.
Following a violation of our most recent level of structure price has given us a pullback and a double bottom which I used for my reason for entry into the trade.
Other forms of confluence come from psychological numbers, Fibonacci levels & both hidden and regular divergence on the RSI.
If you have any questions or comments please leave them below.
Akil
