USDCAD: Bullish Move From Demand Zone?! 🇺🇸🇨🇦
There is a high chance that USDCAD will respect
the underlined demand zone and go up from that.
As a confirmation, I spotted an ascending triangle pattern on a 4H
time frame and a formation of a bullish imbalance candle.
Goal - 1.377
❤️Please, support my work with like, thank you!❤️
I am part of Trade Nation's Influencer program and receive a monthly fee for using their TradingView charts in my analysis.
Trade ideas

Market Analysis: USD/CAD Faces Fresh DeclineMarket Analysis: USD/CAD Faces Fresh Decline
USD/CAD declined and is now consolidating losses below 1.3800.
Important Takeaways for USD/CAD Analysis Today
- USD/CAD started a fresh decline after it failed to stay above 1.3900.
- There is a connecting bearish trend line with resistance at 1.3755 on the hourly chart.
USD/CAD Technical Analysis
On the hourly chart of USD/CAD, the pair climbed toward 1.3900 before the bears appeared. It formed a swing high near 1.3867 and recently declined below 1.3800.
There was also a close below the 50-hour simple moving average and 1.3785. The bulls are now active near 1.3720. If there is an upside correction, the pair could face resistance near 1.3755 and a connecting bearish trend line.
The trend line is near the 23.6% Fib retracement level of the downward move from the 1.3867 swing high to the 1.3718 low. If there is an upside break above the trend line, the pair could rise toward the 1.3785 pivot level.
The next key hurdle on the USD/CAD chart is near the 61.8% Fib retracement at 1.3810. If there is an upside break above 1.3810, the pair could rise toward 1.3865. The next major sell zone is 1.3930, above which it could rise steadily toward the 1.4000 handle.
Immediate support is near the 1.3720 level. The first major support could be 1.3700. A close below the 1.3700 level might trigger a strong decline. In the stated case, USD/CAD might test 1.3600. Any more losses may possibly open the doors for a drop toward 1.3500.
This article represents the opinion of the Companies operating under the FXOpen brand only. It is not to be construed as an offer, solicitation, or recommendation with respect to products and services provided by the Companies operating under the FXOpen brand, nor is it to be considered financial advice.

USD/CAD IS CURRENTLY EXHIBITING A BEARISH TREND STRUCTUREUSDCAD currently trading in bearish trend structure.
Price is forming lower lows and lower highs.
Price recently formed bearish engulfing candle which shows increase in selling pressure.
Price is expected to remain bearish in upcoming trading sessions.
On lower side market my hit the target price of 1.35800
On higher side, market may test resistance level of 1.40200

USDCAD H4 | Bullish Reversal Forming at Swing Low SupportUSD/CAD is reacting off the buy entry, which has been identified as a swing low support and could bounce from this level to the upside.
Buy entry is at 1.3747, which is a swing low support.
Stop loss is at 1.3680, which is a pullback support.
Take profit is at 1.3815, which is an overlap resistance that is slightly below the 50% Fibonacci retracement.
High Risk Investment Warning
Trading Forex/CFDs on margin carries a high level of risk and may not be suitable for all investors. Leverage can work against you.
Stratos Markets Limited (tradu.com ):
CFDs are complex instruments and come with a high risk of losing money rapidly due to leverage. 65% of retail investor accounts lose money when trading CFDs with this provider. You should consider whether you understand how CFDs work and whether you can afford to take the high risk of losing your money.
Stratos Europe Ltd (tradu.com ):
CFDs are complex instruments and come with a high risk of losing money rapidly due to leverage. 66% of retail investor accounts lose money when trading CFDs with this provider. You should consider whether you understand how CFDs work and whether you can afford to take the high risk of losing your money.
Stratos Global LLC (tradu.com ):
Losses can exceed deposits.
Please be advised that the information presented on TradingView is provided to Tradu (‘Company’, ‘we’) by a third-party provider (‘TFA Global Pte Ltd’). Please be reminded that you are solely responsible for the trading decisions on your account. There is a very high degree of risk involved in trading. Any information and/or content is intended entirely for research, educational and informational purposes only and does not constitute investment or consultation advice or investment strategy. The information is not tailored to the investment needs of any specific person and therefore does not involve a consideration of any of the investment objectives, financial situation or needs of any viewer that may receive it. Kindly also note that past performance is not a reliable indicator of future results. Actual results may differ materially from those anticipated in forward-looking or past performance statements. We assume no liability as to the accuracy or completeness of any of the information and/or content provided herein and the Company cannot be held responsible for any omission, mistake nor for any loss or damage including without limitation to any loss of profit which may arise from reliance on any information supplied by TFA Global Pte Ltd.
The speaker(s) is neither an employee, agent nor representative of Tradu and is therefore acting independently. The opinions given are their own, constitute general market commentary, and do not constitute the opinion or advice of Tradu or any form of personal or investment advice. Tradu neither endorses nor guarantees offerings of third-party speakers, nor is Tradu responsible for the content, veracity or opinions of third-party speakers, presenters or participants.

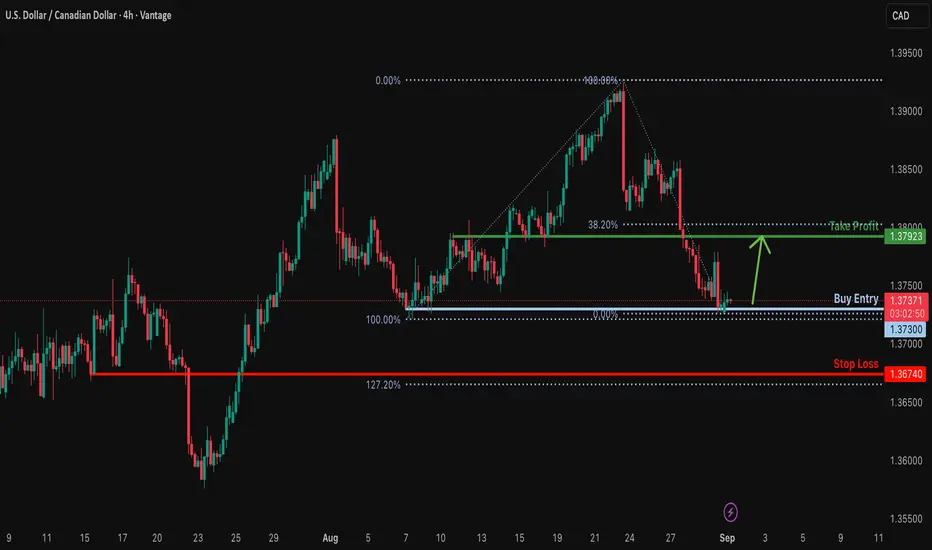
Bullish Reversal Setup Forming?USD/CAD is reacting off the support level, which is a swing low support and could bounce from this level to our take profit.
Entry: 1.3730
Why we like it:
There is a swing low support.
Stop loss: 1.3674
Why we like it:
There is a pullback support that is slightly above the 127.2% Fibonacci extension.
Take profit: 1.3792
Why we like it:
There is an overlap resistance level that is slightly below the 38.2% Fibonacci retracement.
Enjoying your TradingView experience? Review us!
Please be advised that the information presented on TradingView is provided to Vantage (‘Vantage Global Limited’, ‘we’) by a third-party provider (‘Everest Fortune Group’). Please be reminded that you are solely responsible for the trading decisions on your account. There is a very high degree of risk involved in trading. Any information and/or content is intended entirely for research, educational and informational purposes only and does not constitute investment or consultation advice or investment strategy. The information is not tailored to the investment needs of any specific person and therefore does not involve a consideration of any of the investment objectives, financial situation or needs of any viewer that may receive it. Kindly also note that past performance is not a reliable indicator of future results. Actual results may differ materially from those anticipated in forward-looking or past performance statements. We assume no liability as to the accuracy or completeness of any of the information and/or content provided herein and the Company cannot be held responsible for any omission, mistake nor for any loss or damage including without limitation to any loss of profit which may arise from reliance on any information supplied by Everest Fortune Group.
Market Pullback Towards 50% Fib Support Zone?The Loonie (USD/CAD) is reacting off the pivot, which is an overlap support that aligns with the 50% Fibonacci retracement and could bounce to the pullback resistance.
Pivot: 1.3715
1st Support: 1.3568
1st Resistance: 1.3912
Risk Warning:
Trading Forex and CFDs carries a high level of risk to your capital and you should only trade with money you can afford to lose. Trading Forex and CFDs may not be suitable for all investors, so please ensure that you fully understand the risks involved and seek independent advice if necessary.
Disclaimer:
The above opinions given constitute general market commentary, and do not constitute the opinion or advice of IC Markets or any form of personal or investment advice.
Any opinions, news, research, analyses, prices, other information, or links to third-party sites contained on this website are provided on an "as-is" basis, are intended only to be informative, is not an advice nor a recommendation, nor research, or a record of our trading prices, or an offer of, or solicitation for a transaction in any financial instrument and thus should not be treated as such. The information provided does not involve any specific investment objectives, financial situation and needs of any specific person who may receive it. Please be aware, that past performance is not a reliable indicator of future performance and/or results. Past Performance or Forward-looking scenarios based upon the reasonable beliefs of the third-party provider are not a guarantee of future performance. Actual results may differ materially from those anticipated in forward-looking or past performance statements. IC Markets makes no representation or warranty and assumes no liability as to the accuracy or completeness of the information provided, nor any loss arising from any investment based on a recommendation, forecast or any information supplied by any third-party.

USDCADSwing trading idea for #USDCAD, following a strong bearish trend, USDCAD is expected to continue the trend, till the monthly support area, then change character and break the former high

USDCAD| Bullish Bias - Deep Sweep, Smart Money at Work🔹 HTF (4H): Structure remains bullish with strong intent. Price refined into higher-timeframe OBs, digging deeper but still holding bullish order flow.
🔹 MTF (30M): A “Courtyard Liquidity Slash” cleared sell-side liquidity and price mitigated an internal OB. Despite a deep sweep that appeared bearish, structure remains intact.
🔹 LTF (5M): Now waiting for a visual CHoCH to confirm reversal off the significant HTF OB. Only then will I attend longs, looking to ride the next bullish leg into highs.
🔹 Execution Plan: Stay patient — once smart money reveals itself with confirmation, I’ll engage longs from refined zones. Until then, no need to force entries.
🔹 Mindset Note: Deep sweeps don’t change bias; they prepare the path. Let the market prove the hand before we strike.

USDCAD weekly swing tradesell side of the curve is looking to resume its course going into the final quarter of the year
using the cad futures chart we have identified the smt that occurred in combination of the swing high sweep which should kick off the play into the downside and eventually run out the original consolidation of the MMSM
expect the first set of EQL to run cleaner as they are laid out in a LRLR fashion
then the original consolidation may be fickle as the EQL is provided in a HRLR

USDCAD Triple Bottom Rejection at PlayThe Daily TF Triple Bottom Rejection is still at play and I am still bullish overall and my ultimate target is in daily supply.


USDCAD Success in the FX, indices, and gold markets comes from discipline, not luck — I win by combining deep market analysis with strict risk management, keeping emotions out of trading, and focusing on long-term consistency rather than quick gains. Every trade is based on research, patience, and clear strategy, allowing me to grow steadily while protecting capital.

USD/CAD: From Stop Hunt to Bearish Shift📊 USD/CAD 2H Analysis
📝Price action on USD/CAD recently gave us a clear liquidity play:
📝After forming a channel, price pushed above the resistance zone, but the breakout failed — a classic liquidity sweep/stop hunt.
📝This failure confirmed the presence of strong supply, and price quickly shifted structure bearish.
🔄A clear Fair Value Gap (FVG) / Supply Zone is left behind, acting as a potential area where sellers may re-enter if price retraces.
📉The breakdown from the channel also confirms a Change of Character (CHoCH), flipping momentum from bullish to bearish.
🎯Current price is testing support at 1.3720 — a critical level to watch.
🔑 Key Points
Liquidity Grab: Resistance swept before reversal.
CHoCH / BOS: Market shifted bearish after failed breakout.
FVG / Supply Zone: 1.3858 – 1.3894 remains the sell zone.
Support Zone: 1.3720 is the immediate level in play.

USDCADUSD/CAD remains bullish as DXY strength continues, driven by hawkish Fed expectations.
The Canadian Dollar is under pressure amid weaker oil prices and a dovish BoC outlook.
Diverging monetary policy stances between the Fed and BoC support USD upside.
Overall, the pair favors further gains with dips likely to be bought.
USDCAD last bearish movement before weekly market closeUSDCAD is in downtrend movement.
H4 made lower low hint for another bearish movement.
calculate your own risk & reward
Good Luck

Long trade
1Hr TF
📌 Entry Details
Entry: 1.37587
Profit Target: 1.38227 (+0.48%)
Stop Loss: 1.37509 (−0.05%)
Risk-to-Reward (RR): 10.4
📊 Technical Confluence
EMA/WMA Levels:
EMA: 1.37692
WMA: 1.37549
Key Reference Points:
YDO (Yesterday’s Open): 1.37674
TMA (Trend Midpoint Avg): 1.38082
WRH (Weekly Range High): 1.37853
YRL (Yesterday’s Range Low): 1.37341
Fibonacci Context:
Price interacting near the 0.75 retracement zone, indicating liquidity accumulation.
Profit target aligns with retracement rejection zone.
Volume Profile:
Increased buying volume at session overlap (London open liquidity).
Strong accumulation candles visible before entry.
🔎 Narrative / Trade Idea
Price swept liquidity into the YDO & WRH zones during London open, aligning with EMA/WMA support. RSI was recovering from oversold territory (41.69) towards equilibrium (60.98), signalling bullish divergence. Entry was taken after confirming rejection of demand levels with tight SL below session lows, targeting a retracement into 1.3822 resistance.
This setup aligns with Wyckoff-style accumulation Phase C (spring-type event) and potential progression into Phase D mark-up.
15min TF

USDCAD – Shift in Momentum!USDCAD has moved from a strong bullish rally into a clear shift in momentum. After breaking structure with an aggressive drop, price is now moving inside a rising channel that looks more corrective than impulsive.
The previous bullish phase was defined by higher highs and higher lows, but the sharp decline highlighted a potential change in sentiment. Since then, the market has been consolidating, with price pushing higher in a slower and corrective manner.
As long as price remains inside this channel, the bias stays bearish, and I’ll be looking for shorts from the upper boundary around the 1.3880–1.3900 zone. A break below the lower bound near 1.3820 could confirm continuation to the downside.
This is a critical zone for USDCAD, where sellers may step in to regain control.
📚 Always follow your trading plan regarding entry, risk management, and trade management.
Good luck!
All Strategies Are Good; If Managed Properly!
~Richard Nasr

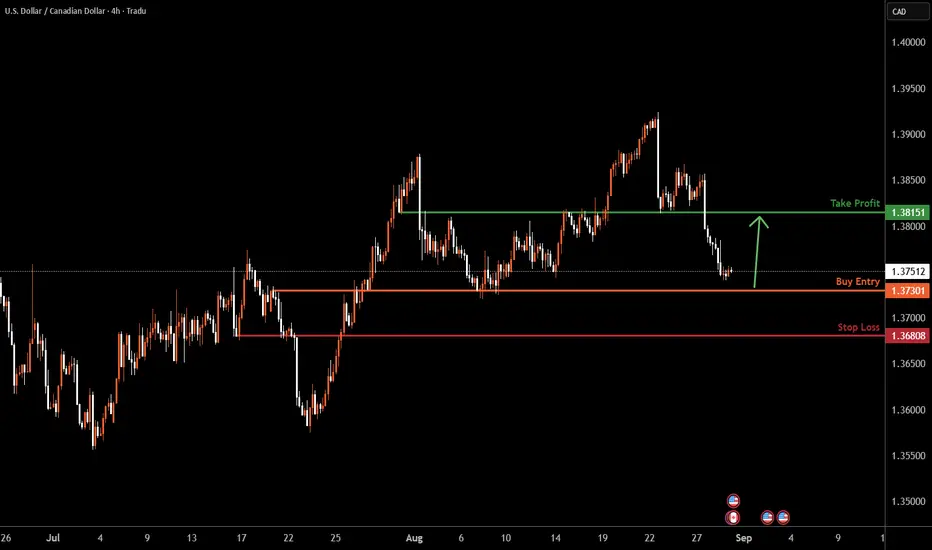
USDCAD H4 | Bullish Reversal at Key SupportUSD/CAD is falling towards the buy entry, which is a pullback support and could bounce from this level to the upside.
Buy entry is at 1.3730, which is a pullback support.
Stop loss is at 1.3680, which is a pullback support.
Take profit is at 1.3815, which is an overlap resistance.
High Risk Investment Warning
Trading Forex/CFDs on margin carries a high level of risk and may not be suitable for all investors. Leverage can work against you.
Stratos Markets Limited (tradu.com ):
CFDs are complex instruments and come with a high risk of losing money rapidly due to leverage. 65% of retail investor accounts lose money when trading CFDs with this provider. You should consider whether you understand how CFDs work and whether you can afford to take the high risk of losing your money.
Stratos Europe Ltd (tradu.com ):
CFDs are complex instruments and come with a high risk of losing money rapidly due to leverage. 66% of retail investor accounts lose money when trading CFDs with this provider. You should consider whether you understand how CFDs work and whether you can afford to take the high risk of losing your money.
Stratos Global LLC (tradu.com ):
Losses can exceed deposits.
Please be advised that the information presented on TradingView is provided to Tradu (‘Company’, ‘we’) by a third-party provider (‘TFA Global Pte Ltd’). Please be reminded that you are solely responsible for the trading decisions on your account. There is a very high degree of risk involved in trading. Any information and/or content is intended entirely for research, educational and informational purposes only and does not constitute investment or consultation advice or investment strategy. The information is not tailored to the investment needs of any specific person and therefore does not involve a consideration of any of the investment objectives, financial situation or needs of any viewer that may receive it. Kindly also note that past performance is not a reliable indicator of future results. Actual results may differ materially from those anticipated in forward-looking or past performance statements. We assume no liability as to the accuracy or completeness of any of the information and/or content provided herein and the Company cannot be held responsible for any omission, mistake nor for any loss or damage including without limitation to any loss of profit which may arise from reliance on any information supplied by TFA Global Pte Ltd.
The speaker(s) is neither an employee, agent nor representative of Tradu and is therefore acting independently. The opinions given are their own, constitute general market commentary, and do not constitute the opinion or advice of Tradu or any form of personal or investment advice. Tradu neither endorses nor guarantees offerings of third-party speakers, nor is Tradu responsible for the content, veracity or opinions of third-party speakers, presenters or participants.
USDCAD Stuck in a Box Pattern as Traders Await Data StormThe USDCAD pair continues to trade inside a box pattern on the weekly timeframe (image 1), hovering between long-term support and resistance zones. While the US Dollar is showing mild recovery attempts, the Canadian Dollar is finding modest support from rising oil prices. Let’s break it down.
Why the US Dollar Is Struggling
Fed Rate Cut Expectations: Markets now see an 87% probability of a September cut, up from 75% just a week ago. Fed’s John Williams reminded traders that “every meeting is live,” keeping uncertainty high.
Political Pressure on the Fed: Attacks on the central bank’s independence (e.g., attempts to remove Governor Lisa Cook) have dampened USD sentiment.
Lower interest rate expectations + political noise = cautious Dollar.
What’s Supporting the Canadian Dollar
Oil Prices: As a major exporter, higher crude prices are giving CAD a gentle push upward.
But… GDP Risks: Canada’s upcoming Q2 GDP is expected to show a 0.6% contraction, a sharp reversal from Q1’s +2.2%. If confirmed, it could weigh heavily on CAD.
Key Events to Watch
US PCE Price Index → If softer, Fed cut bets rise → USD weakens. Stronger-than-expected → USD rebound.
Canada GDP → Weak print supports USD; stronger data helps CAD.
Trading Setup (Short-Term) ⚡
Bias: Range play inside the box.
Entry Zone: 1.3720 – 1.3745 (current mid-range support).
Target: 1.3850 (top of range).
Stop Loss: Below 1.3660.
RR: ~1:3.
Alternatively, a break above 1.3850 could signal fresh bullish continuation toward 1.4000, while a daily close below 1.3650 exposes 1.3500.
Final Summary
USDCAD is in wait-and-see mode, caught between:
A weakening USD from Fed cut bets & political tension.
A fragile CAD supported by oil but threatened by weak GDP.
Until data clears the picture, expect box-pattern trading with opportunities near support and resistance.
👉 Follow me for more 1:5 RR setups, trade breakdowns, and live market updates.
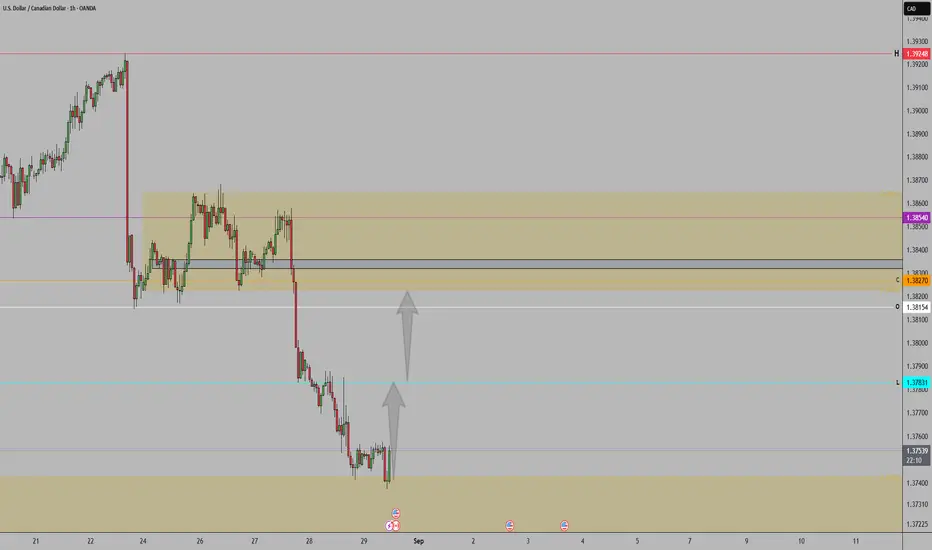
28-08-2025 USDCAD The market is not always chaotic and disorderly, and there is a precise geometric beauty hidden in price fluctuations. The harmonic form long strategy is a powerful tool for accurately identifying potential market reversal points based on the Fibonacci ratio. When the form forms perfectly at the key support level, it often indicates the depletion of bearish momentum and the initiation of bullish trends.
As shown in the figure: 15M Bullish Butterfly

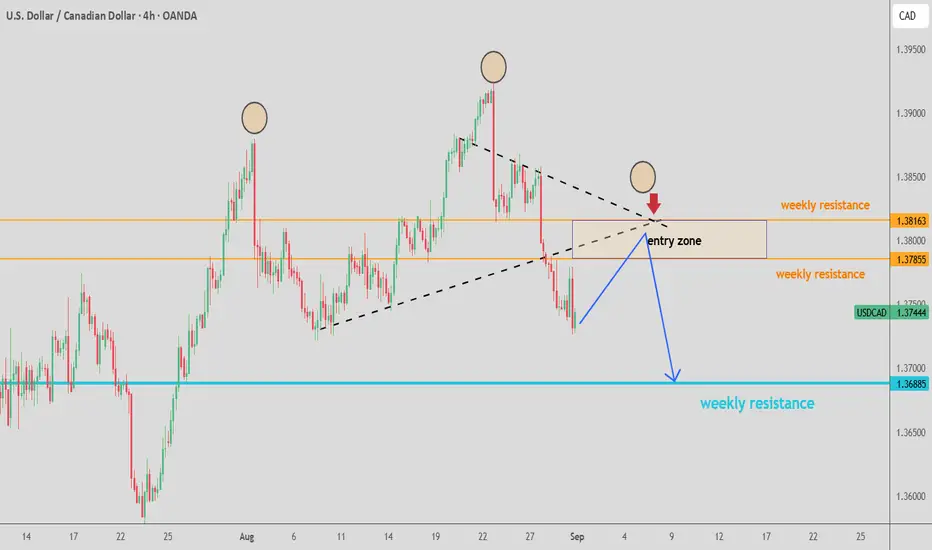
Sell USD/CAD after retest of broken support.USD/CAD reversed last week after breaking higher from major resistance. Now it looks like a failed breakout, next week I expect it to retest resistance before heading lower.
Sell : 1.3850 retest broken support now turned resistance
Stop : 1.3915 above resistance
Profit : 1.3655 before 78.6% Fib retracement
Risk 1 : 3

USD-CAD Support Ahead! Buy!
Hello,Traders!
USD-CAD keeps falling down
In a strong local downtrend
And the pair is locally oversold
So after the pair hits the
Horizontal support of 1.3730
A local bullish correction
Is to be expected
Buy!
Comment and subscribe to help us grow!
Check out other forecasts below too!
Disclosure: I am part of Trade Nation's Influencer program and receive a monthly fee for using their TradingView charts in my analysis.
