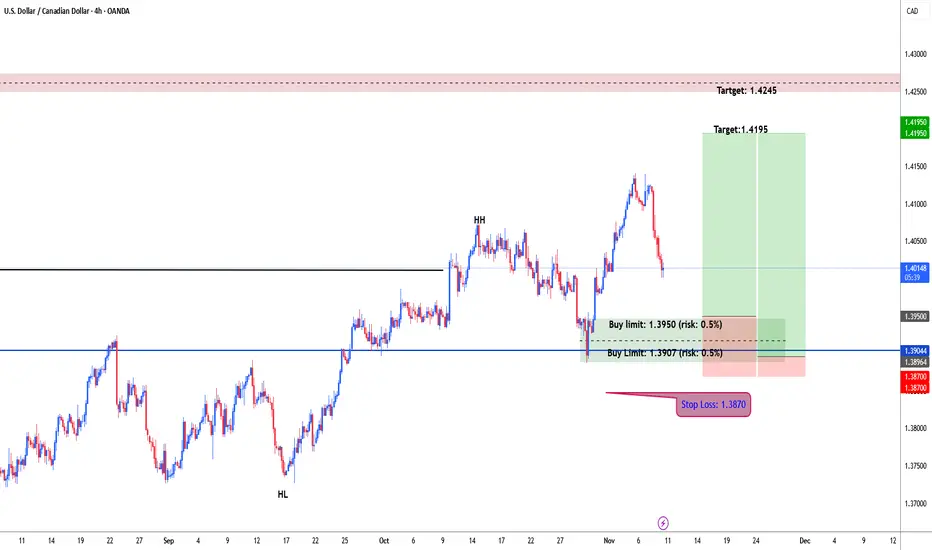
USDCAD possible bullish for 1.4195 & 1.4245#usdcad daily chart forming higher high and higher low. usdcad price broke and closed above 1.4016. wait for correction and test demand zone for another leg higher. i placed my orders at 1.3950 & 1.3906 each with 0.5% risk. stop loss: 1.3870. target: 1.4195 & 1.4245 as well.
Trade ideas
USD/CAD Rally Stalls into Trend Resistance at Seven-Month HighsThe Canadian Dollar is getting reprieve today with USD/CAD snapping a six-day rally to seven-month highs. Stronger-than-expected Canadian employment figures amplified today’s decline with a reversal off uptrend resistance now threatening a deeper correction within the July uptrend. The immediate focus is on this pullback in the days ahead with the November opening-range taking shape above the median-line.
Initial support rests with the October high close at 1.4055 and is backed by the monthly open / May high at 1.4011/17- note that the medina-line converges on this threshold next week. Ultimately a break / close below the 2022 high / 61.8% retracement of the recent advance at 1.3977/85 is needed to suggest a more significant high is in place / a larger reversal is underway. Subsequent support rests with the 200-day moving average at (currently at 1.3940) with broader bearish invalidation steady at 1.3881/99- a region defined by the 2022 high-close and the 2023 swing high.
Initial resistance now eyed with the monthly high-close at 1.4115 and is backed by the 50% retracement of the yearly range / November high at 1.4167/78. A breach / close above this threshold would threaten another accelerated advance with subsequent top-side objectives eyed at the March low at 1.4235 and the 61.8% retracement at 1.4315.
Bottom line: USD/CAD has responded to uptrend resistance and the risk now rises for a deeper pullback within the broader July advance. From a trading standpoint, losses would need to be limited to 1.3978 IF price is heading higher on this stretch with a close above 1.4178 needed to fuel the next major leg of the rally.
-MB

USDCAD TRADE SETUP CHECK NOW
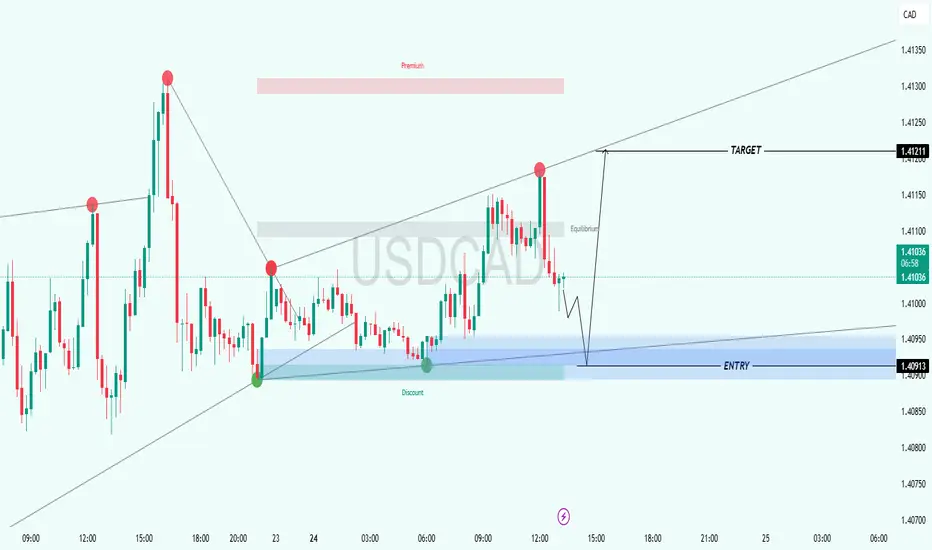
🔥 Buy Setup Active!
Entry: 1.40913
🎯 Target: 1.41211
❌ Stop Loss: 1.40809
Bullish momentum increasing — price holding strong at the lower zone, and buyers may look to push the market higher from this level! ⚡
⚠️ This is not financial advice, just my market outlook.
USDCAD - SHORTUSDCAD dropping from our key level.
USDCAD could not break our daily key level, and there comes the bearish pressure. Price might drop down to the 4h key level.

Market Analysis: USD/CAD Maintains Bullish StrengthMarket Analysis: USD/CAD Maintains Bullish Strength
USD/CAD is showing positive signs and might aim for more gains above 1.4130.
Important Takeaways for USD/CAD Analysis Today
- USD/CAD rallied above 1.4000 and 1.4050 before the bears appeared.
- There is a connecting bullish trend line forming with support at 1.4085 on the hourly chart.
USD/CAD Technical Analysis
On the hourly chart of USD/CAD, the pair formed a strong support base above the 1.3970 level. The US Dollar started a fresh increase above 1.4000 against the Canadian Dollar.
The pair cleared the 50-hour simple moving average and climbed above 1.4050. Finally, it tested the 1.4130 zone before the bears appeared. The pair traded below the 23.6% Fib retracement level of the upward move from the 1.3971 swing low to the 1.4130 high.
Initial support is near a connecting bullish trend line at 1.4085 and the 50-hour simple moving average. A downside break below the trend line might send the pair toward 1.4050.
The next major area on the USD/CAD chart could be the 76.4% Fib retracement at 1.4010. A close below 1.4010 could push the pair further lower. In the stated case, the bears might aim for a test of 1.3970.
On the upside, Initial resistance sits near 1.4105. The main breakout zone could be 1.4130. A clear upside break above 1.4130 could start another steady increase. The next major stop for the bulls might be 1.4200. Any more gains could open the doors for a test of 1.4250.
This article represents the opinion of the Companies operating under the FXOpen brand only. It is not to be construed as an offer, solicitation, or recommendation with respect to products and services provided by the Companies operating under the FXOpen brand, nor is it to be considered financial advice.

USDCAD 1H Bearish setupPrice is rejecting the upper volatility band and struggling to hold above the short-term EMA cluster. Market structure is showing lower highs and repeated failures at the 1.41 zone, adding to bearish confluence.
I’m looking for a downside continuation with these Fibonacci extension targets:
🔻 TP1 – 38.2%: ~1.4090
🔻 TP2 – 61.8%: ~1.4086
🔻 TP3 – 100%: ~1.4081
Stop sits above the recent rejection wick. As long as price stays under the EMA cloud and fails to reclaim 1.4105, the bearish scenario remains valid.

CAD USDHI GUYS,
Well i do not trade so many pairs however i have the script of cad usd on both price pattern and days of the week.
lets trade and see if this works out.


USD CAD LongTake a fib level (of sorts)
And looking for price to test those moving averages.
2:1 RRR

Weekly watchlist – Reviewing the setup on USDCADThe resistance around 1.4200 is an important level that price has touched and rejected three times. But on the last rejection, we can see that price formed a higher low, showing a tendency to break this resistance.
After the market opens, if this resistance breaks, we can consider a good long position since it’s in the direction of the trend.
If it gets rejected again, we won’t take action — for now, we have no plans for a short position on this pair.
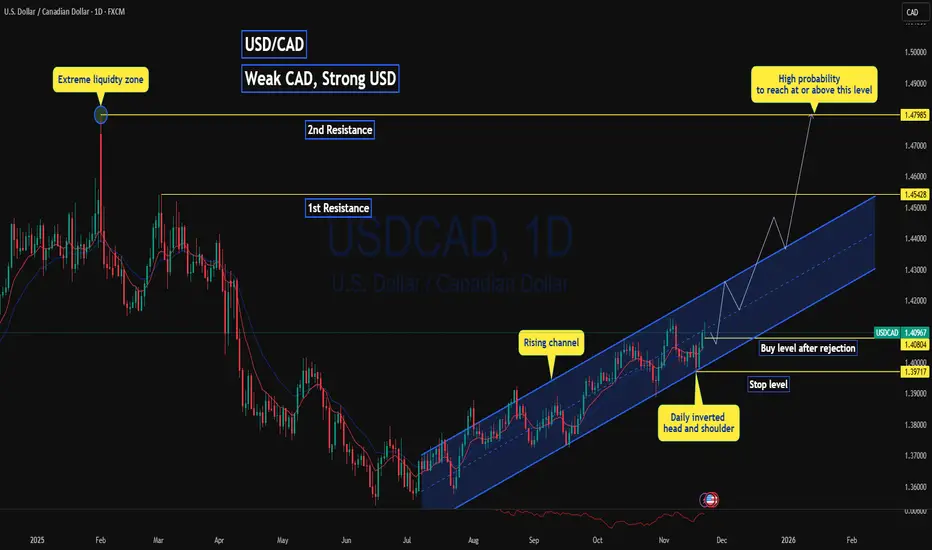
USDCAD is set to go 700 pip up!💹 Trade Setup USD/CAD
USD/CAD has formed a bullish channel with recent formation of inverted head and shoulder on the support level of the rising channel.
Weekly price action is has shown strong rejection from the support level with multiple liquidity grab.
with weaker CPI 2.9% where the forecast is 3.1% on CAD as well as continued bearish trend in Crude Oil ( as CAD is highly influence to WTI price ) putting CAD under pressure, While strong NFP data Non-Farm Employment Change 119k while forecast 53k boosting DXY making USD /CAD one of the strongest USD currency pairs to trade on
📈Trading Idea :
Look for bullish setup after false breakout of daily support at 1.4080 and rejection above
✈️Targets
1st Resistance 1.4543
2nd Resistance: 1.4799
🔴Stop level
at or below 1.3971 as this is the lower shadow of the inverted head and shoulder.
Follow for more ideas and update on this pair and other pairs !

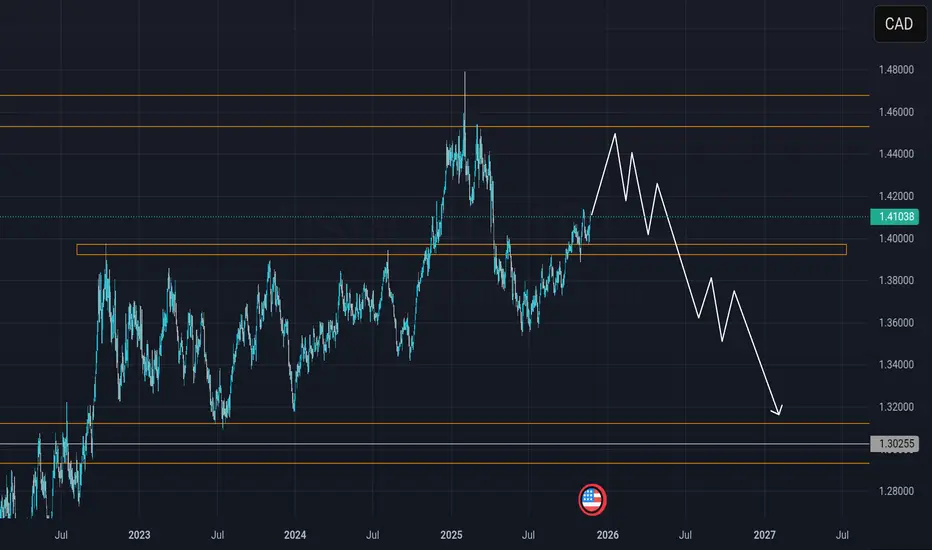
USDCAD: Bearish Forecast & Outlook
The recent price action on the USDCAD pair was keeping me on the fence, however, my bias is slowly but surely changing into the bearish one and I think we will see the price go down.
Disclosure: I am part of Trade Nation's Influencer program and receive a monthly fee for using their TradingView charts in my analysis.
❤️ Please, support our work with like & comment! ❤️

USDCAD H4 | Bearish Reaction off Key ResistanceMomentum: Bearish
Price is currently within the bearish ichimoku cloud.
Sell entry: 1.4095
- Pullback resistance
- 127.2% Fib extension
Stop Loss: 1.4142
- Multi Swing high resistance
Take Profit: 1.4054
- Pullback support
High Risk Investment Warning
Stratos Markets Limited (tradu.com/uk ), Stratos Europe Ltd (tradu.com/eu ):
CFDs are complex instruments and come with a high risk of losing money rapidly due to leverage. 70% of retail investor accounts lose money when trading CFDs with this provider. You should consider whether you understand how CFDs work and whether you can afford to take the high risk of losing your money.
Stratos Global LLC (tradu.com/en ): Losses can exceed deposits.
Please be advised that the information presented on TradingView is provided to Tradu (‘Company’, ‘we’) by a third-party provider (‘TFA Global Pte Ltd’). Please be reminded that you are solely responsible for the trading decisions on your account. Any information and/or content is intended entirely for research, educational and informational purposes only and does not constitute investment or consultation advice or investment strategy. The information is not tailored to the investment needs of any specific person and therefore does not involve a consideration of any of the investment objectives, financial situation or needs of any viewer that may receive it. Past performance is not a reliable indicator of future results. Actual results may differ materially from those anticipated in forward-looking or past performance statements. We assume no liability as to the accuracy or completeness of any of the information and/or content provided herein and the Company cannot be held responsible for any omission, mistake nor for any loss or damage including without limitation to any loss of profit which may arise from reliance on any information supplied by TFA Global Pte Ltd.

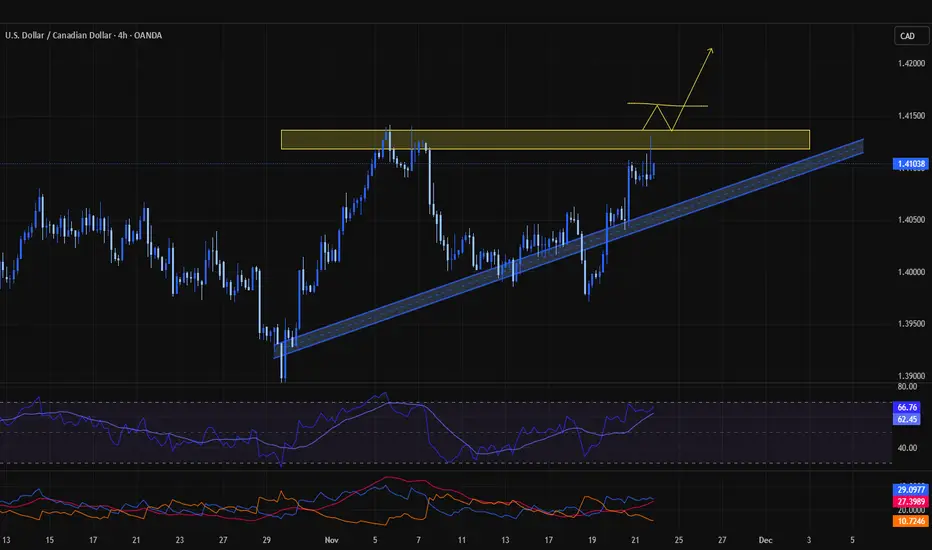
possibility of uptrend With the resistance level broken, the upward trend will likely continue. Then the specified targets will be available.

USDCAD BUY TRADE PLANPAIR & DATE: USDCAD — 21 Nov 2025
PLAN ID: UC-21NOV-V1
⸻
PLAN OVERVIEW
• Category: Swing / Intra-Day
• Trade Type: Pullback Continuation
• Direction: BUY
• Confidence: 78% (≥70% OK)
• Min R:R: 1:3 to TP2
• Status: VALID
⸻
🧭 MACRO ALIGNMENT NOTE
• Trend: WITH-trend (D1 bullish; H4 BOS up; H1 micro pullback)
• Macro Bias: WITH (USD firming; CAD weak on oil pullback)
• Implication:
⸻
📍 LEVELS CARD (QUICK ACTION)
🟩 PRIMARY SETUP (WITH-trend – Higher Probability) → BUY
Entry 01 (Primary Zone): 1.4060 – 1.4075
Confluence:
• H1 bullish OB
• H4 discount pullback
• Fresh FVG below
• D1 trend intact
• Clean inefficiency → high-precision demand pocket
• Zone Status: Fresh Tap Pending
Entry 02 (Secondary Deeper Buy Zone): 1.4020 – 1.4035
(Independently ≥70% confluence — VALID)
Confluence:
• H4 demand block
• D1 50% retracement
• Deeper liquidity sweep potential
• Zone Status: Fresh Tap Pending
STOP LOSS (for both zones): 1.3990
Below H4 structural low + OB invalidation.
TAKE PROFITS
• TP1: 1.4135
• TP2: 1.4180
• TP3: 1.4235
Order Type:
Pending – Pre-validated ✅
(Zone clean, HTF aligned ≥80%, no nearby invalidation)
Session: London → NY preferred
⸻
🟦 ALTERNATE SETUP
(According to Bias Integrity Rule)
Bias Tag: WITH-trend continuation
Entry: 1.4105 – 1.4115
• Breakout-retest continuation
• H1 BOS → retest of micro OB
• H4 structure supportive
• Only triggers if price breaks above 1.4130 then retests lower
STOP LOSS: 1.4078
TP1: 1.4155
TP2: 1.4180
TP3: 1.4220
Session: NY
Order: Market after H1 bullish confirmation
⸻
🟪 FUTURE SETUP (PRE-MAPPED)
Bias Tag: WITH-trend continuation
Entry: 1.3960
SL: 1.3920
TP1: 1.4030
TP2: 1.4100
TP3: 1.4170
Trigger: H1 bullish engulf or BOS
Zone Status: Fresh Tap Pending
(This is a major HTF anchor level; if reached → A+ probability)
⸻
🧪 EXECUTION CHECKLIST (PASS/FAIL RULES)
1. News Blackout: 15m before / 60m after red events — STRICT
2. Price taps zone during London/NY
3. Confirmation on H1: Engulf / Pin / BOS
4. Execute only with defined order type
5. TP1 partial → SL BE
6. Exit on invalidation
7. Skip if no trigger
8. EMA Stack Filter: if flat/choppy → SKIP
⸻
📊 FUNDAMENTALS & NEWS
• Fed neutral–hawkish
• BoC mildly dovish
• Oil weakness → CAD weakness
• Retail flows long CAD → supports USD continuation
• Options RR favors USD upside
Macro Lean: Mild USD strength → supports WITH-trend BUY plan.
⸻
🗺 MARKET MAP
• D1: Uptrend, BOS up
• H4: Continuation structure; deep pullback complete
• H1: Bullish impulsive leg → shallow consolidation
• PDH: 1.4130
• PDL: 1.3967
• FVG below price (support)
• Play type: Continuation pullback + breakout-retest
⸻
🛡 RISK & MONEY MANAGEMENT
• Risk: 1–2%
• Min R:R ≥ 1:3
• Structure-based trailing
• No stacking unless TP1 hit
⸻
🔥 CONFIDENCE (ONE SENTENCE)
78% — Strong HTF bullish structure + macro USD support + clean pullback zones + no bearish invalidation.
⸻
🎯 FINAL EXECUTION STRATEGY
• Primary: Set pending at 1.4060–75 and 1.4020–35 → monitor confirmations
• Alternate: Only if breakout → retest → bullish H1 candle
• Stay flat: If price falls below 1.3990 or forms H4 bearish BOS
• Zone Status: All fresh, untouched — high probability
• No forced trades at highs

USDCAD Will Go Down! Sell!
Take a look at our analysis for USDCAD.
Time Frame: 1D
Current Trend: Bearish
Sentiment: Overbought (based on 7-period RSI)
Forecast: Bearish
The market is approaching a key horizontal level 1.409.
Considering the today's price action, probabilities will be high to see a movement to 1.395.
P.S
Overbought describes a period of time where there has been a significant and consistent upward move in price over a period of time without much pullback.
Like and subscribe and comment my ideas if you enjoy them!

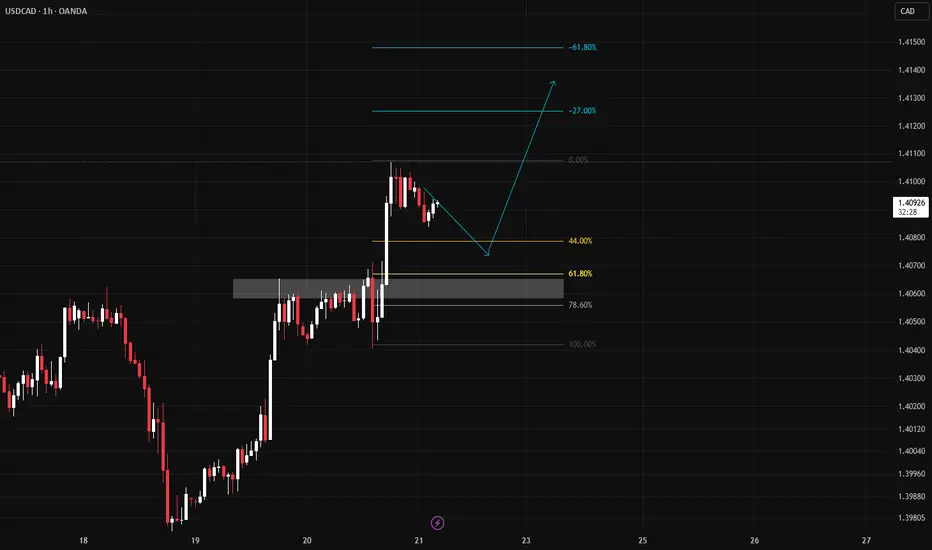
strategy longwe see that we are in an uptrend and in the middle of an impulse and correction, so we also expect the market to turn, and if the market turns between the 44% and 61% Fibonacci areas, also if we have a plus candlestick for long.
thank you.

USD/CAD Short
This is my plans:
Plan A: The Bear Flag almost reach 1.42 (650 pips), so end of wave, prepare for Sell.
Plan B: If plan A fail, step back to Sell at 1.45
Plan C: if these plans above fail -> surrender :))
Bottom line: 1.40-1.45 is too high, i don't wanna buy, just looking for great sell. Let's see what's going on.

what next for USDCADHello friends, as you can see, the trend is bul, and I think the car is over and we can create a new hi
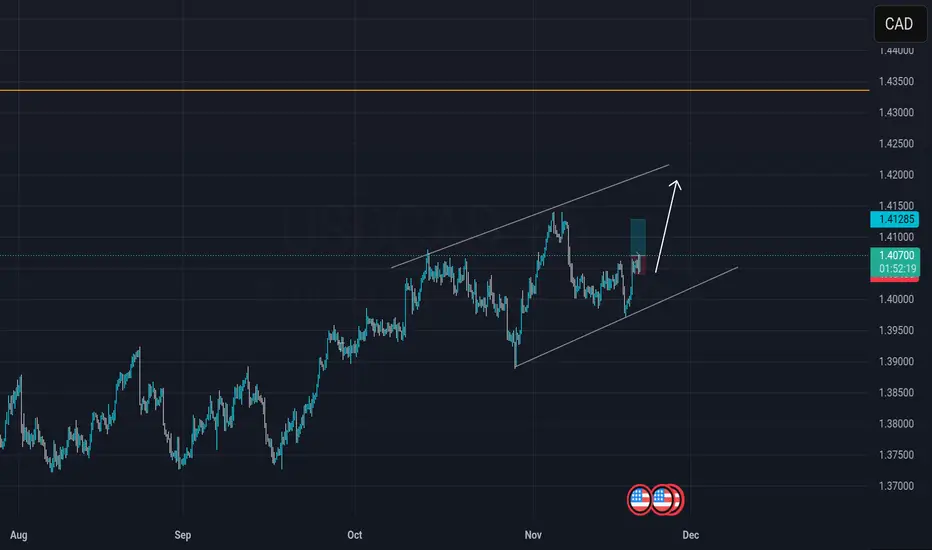
USD/CAD Long positiionA break and re test of 1.40624 has been broken an re tested, after failing to make new lows.
