Short USDCNHBullishness seems over. Short term looks like it is headed for 6.8500. Medium term 6.7500.
Trade ideas

ridethepig | Tracking CNH Extremely Closely🔸 China Macro Flows 🔸
The point of this configuration is that CNH is influencing the currency, equity and commodity board that can be seen in AUDUSD, NZDUSD, OIL, Gold and everything in-between...USD's cannot make any use of the Yuan devaluation and this has been a threat ever since Saudi unlocked the CNY oil contract.
For those tracking the Long-term Macro Playbook we are reaching the first area of strong support. Now that all the pieces to the global economy are hanging by a thread, it will be difficult to continue betting on the downside in USD until we clear the second chapter in covid. To put simply,
expecting a temporary stop-over till 2021 as markets will have a difficult time from August convincing people to stand as guarantors to CNH till year-end.
The "Giant Panda" has been playing a 🔑 role in sitting on the AUD bid...however, in an ever changing environment the arrival of Covid Chapter II will make things even more complex. Highly recommend digging deeper into the AUDCNH and NZDCNH which are both experiencing the slingshot as widely expected since the start of the pandemic:
📍 AUDCNH
📍 NZDCNH
... As you all know by now the Oil devaluation gave China a third lever to control its C.A surplus - by devaluing the black stuff it was the equivalent of devaluating the Yuan. As long as we get another hammer in Oil then it will offset any upside in CNHUSD, the only way that the U.S. can manoeuvre around this is by pushing up the price of XAU in USD terms.
Why❓
... Well as we can trade GC1 and CL1 in both USD and CNY terms it means the Gold:Oil ratio is indirectly tightening the noose on the petrodollar market.
Despair. It illustrates the unhealthy stance of the energy market and the 'checkmate' from China/Russia. The textbook move involves a pinning of USD and US Equities. We are still not quite there yet where the USD can begin the waterfall devaluation, it will take a Plaza Accord 2.0 to trigger such an event and until the dollar peaks Equities will remain vulnerable to gyrations in risk sentiment.
Those who are betting on the CNHUSD breakdown are also aiming for a retest of support at the March lows in SPX, NQ and DJIA... The USD will still be the safest place to park in Covid Chapter II.
📍 The Dow
📍 Shanghai Comp
Highly recommend tracking CNH in the 'endgame' of the economy cycle. Typically recessions last 5 Quarters in time and it is far from unusual to see 2 or 3 of those Quarters as dead-cat-bounces. If you are still in any doubts of the picture equity promoters are painting, please take a look at Long Bonds which are refusing to subscribe to the V-shaped consensus view.
As usual thanks for keeping the feedback coming 👍 or 👎

US Dollar Upward Movement against Chinese YuanChina Conflicts with us and eu could make this wave happens
#USDCNH #USDCNY

The Chinese yuan continues to advance against the US dollarThe Chinese yuan continues to advance against the US dollar as the Chinese economy gradually recovers. The USD/CNH trading pair’s prices are widely predicted to remain bearish and possibly reach its support level in the first week of August. Bears are hoping to force prices to the range last seen in early March before the pandemic worsened around the world. The main strength of the Chinese yuan comes from the recent reports that Goldman Sachs says that it sees the currency reinforcing itself against the US dollar in the next 12 months. However, the Chinese yuan’s strength suddenly felt a sudden stop this Monday after the People’s Bank of China announced its official interest rates this morning. Earlier this Monday, the PBoC announced that it has set its 5-year loan prime rate at about 4.65%, leaving it unchanged from a month earlier. Aside from that, the Chinese central bank also left its 1-year loan prime rate unmoved at about 3.85%.
USDCNHHello dear traders. Here my idea to USDCNY . we will expectbearish continuation to 0.9564 level.
Traders, if you liked this idea or have your opinion on it, write in the comments.please like and subscribe to my profile.
Good luck to you.
This idea does not provide the financial advice.

USD CNH | 1W | Technical AnalysisHelicopter view of USDCNH currency pair, and some ideas on how to act upon the recent price movements.

USDCNH | WEEKLY PERSPECTIVEWith over 800pips in our direction since my last publication (see link below for reference purposes), it appears that the Chinese Yuan is not reversing any time soon as USD/CNH risks a potential decline to the 6.9500/6.9300 area in the coming week(s).
Tendency: Downtrend ( Bearish )
Structure: Harmonic (AB = CD)
Observation: i. The fall of the USD since the beginning of this month (July 2020) appears to continue as we anticipate a Breakdown of my Key level 6.98000 leading to a Harmonic pattern.
ii. ABCD pattern expectations:
a. Impulse A-to-B expected to be in harmony with the potential C-to-D leg.
b. The B- to-C leg is at 50.0% Fibonacci retracement of the A-to-B leg.
c. The C-to-D leg is expected to fall within 127.2 - 1.414% Fib. ext. of the A-to-B move.
Trading plan: SELL confirmation with a minimum potential profit of 450 pips.
Risk/Reward: 1:2.5
Potential Duration: 1 to 4 days
NB: This speculation can be considered to make decisions on lower timeframes.
Watch this space for updates as price action is been monitored.
NirvanaForex
Risk Disclaimer:
Margin trading in the foreign exchange market (including foreign exchange trading, CFDs, etc.) has a high risk and is not suitable for all investors. The content of this speculation (including all data) is organized and published by me for the sole purpose of education and assistance in making independent investment decisions. All information herein is for your reference only and I take no responsibility.
You are hereby advised to carefully consider your investment experience, financial situation, investment objective, risk tolerance level and consult your independent financial adviser as to the suitability of your situation prior to making any investment.
I do not guarantee its accuracy and is not liable for any loss or damage which may result directly or indirectly from such content or the receipt of any instruction or notification therewith.
Past performance is not necessarily indicative of future results.

USDCNH | 1D | 1 Year ChannelUSDCNH has been moving in a horizontal channel since July 2019. It already tested support and resistance 1 time, and now heading down to test support again. Keeping it on my radar to see if the price will hit the bottom of the channel by the end of summer 2020.

The Chinese yuan continues to see gains against the US dollarThe Chinese yuan continues to see gains against the US dollar this Wednesday. Although yesterday the buck appeared like it’s forcing a recovery, there are more fundamental factors supporting the Chinese yuan’s case. The pair will likely reach its support levels this July thanks to the positive sentiment sparked by American investment banking company, Goldman Sachs. Just recently, it was reported that the bank sees the Chinese yuan strengthening further against the beloved US dollar in the next twelve months. According to the bank’s strategists, the Chinese yuan will primarily rally thanks to the recovery of the Chinese economy’s health. It’s no new news that China, where the outbreak started, has very few existing cases as of writing. That comes in contrast to the number of cases seen in the United States. Aside from that, the economic recovery of some of China’s biggest trading partners is helping the yuan power through.

Currency war?Hi All,
So YUAN broke the trend line, and seems to be more bearishness action.
Is all this intentional?
Governments trying to devalue their currencies?
What do you think?
Thnx
Jad

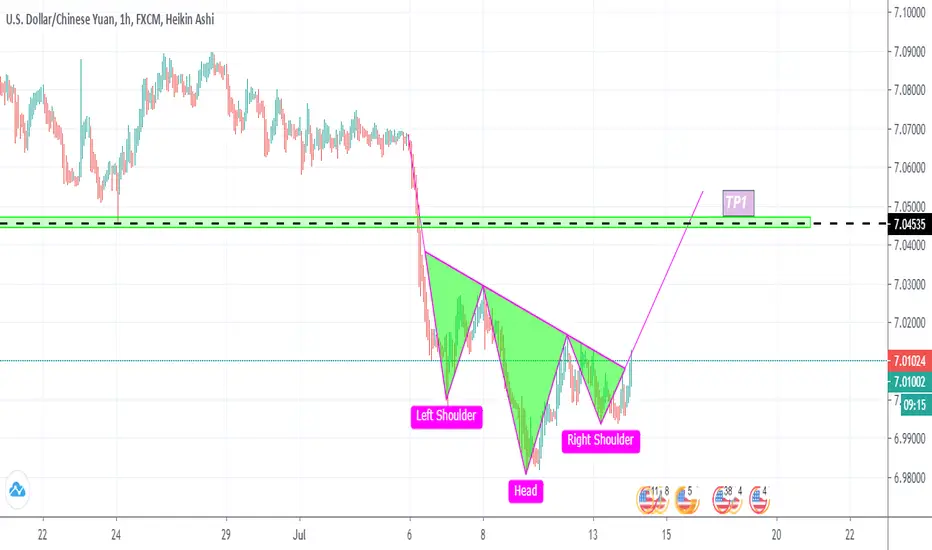
USD/CNH 7/7/2020Welcome to this analysis on USD/CNH.
Looking at the daily chart, the price has been trading in a wide range between 6.85 and 7.2 since July. On 28th of May price tested the top resistant of the range and got rejected from there and created a Head And Shoulders reversal pattern at the top half of the range that just got activated by a break and close below the neckline of the pattern at 7.04. The target of the Head And Shoulders is around 6.88 as long as the price doesn't move back up above the right shoulder of the pattern.
The first support zone below the price is around 6.92 and below that the low of the range at 6.85.
This trade idea has 4 rewards to risk ratio.
Good luck trading.


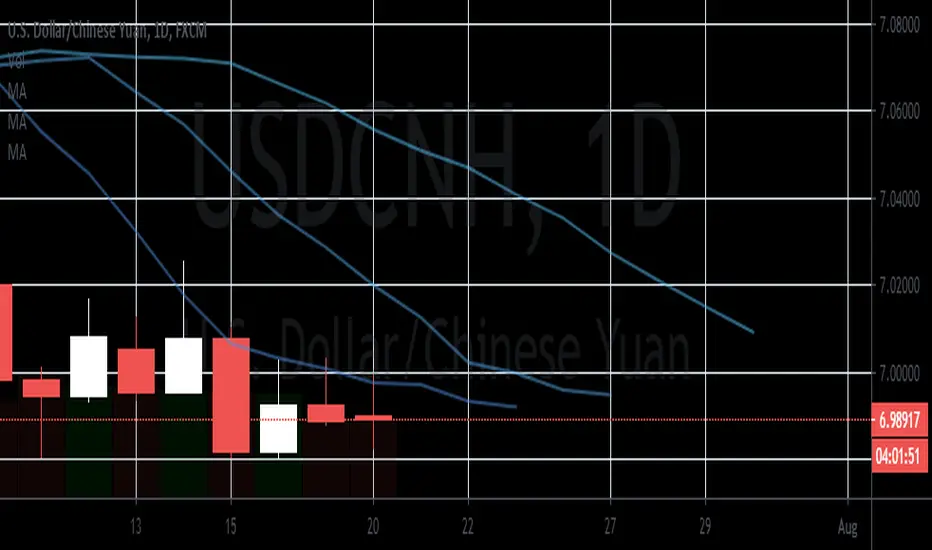
USDCNH A Great Buying OpportunityTrade Proposal:
There is a probability of first tp to the proposed (7,04535) Direction line. So, Traders can set orders based on Price Action and expect to reach short-term goals.
Technical analysis:
USDCNH Waiting for the Range Bound and the beginning of the Ascension Trend.
TP1= 7,04535


SupportedA rising support line is claiming that we may see a retracement despite the position below the MA.

USDCNH Bullish OpportunityWaiting for Price to Breakout of this minor trend line holding price orders, in order to enter with precision and proper Risk/Reward. I have to wait and adapt to the market conditions that show when the market opens, by adapting means by adjusting the trading idea as price flows closer to support if it decides to. Get your Buy Stops ready is all I'm saying.

Trade idea USDCNH longUSDCNH follows a medium-term uptrend. On 27/05/2020 the pair reached its previous high at 7.20 and got rejected. In the last two weeks we saw a decline back to the SMA200 at 7.0450 where we today saw a rebound in an environment of risk aversion and dollar strength. This situation gives a long engagements a very good return/risk ratio. Trade parameters are as follows:
- entry at current level of 7.08
- stop loss at 7.01 (conservative approach) or below 7.04 (aggressive approach)
- take profit at 7.195 for 67% of the position


USDCNH trend is reversing!Look at the chart and the channel, a ABC of 6 years is over.
Expect USDCNH to go blow 6.

USD/CNH Weekly channel- possible long opportunityAs we can see, USD/CNH has been moving within an upward channel on the weekly timeframe. The price is currently near the bottom of the channel, so as we monitor price action in this area, we will look for a long opportunity after seeing bullish momentum come in.

USDCNH | WEEKLY FORECASTThe Yuan has been on the rise since the beginning of June 2020 and it does not appear that there will be a "slow-down" in the following week as the Greenback continues to depreciate.
Tendency: Downtrend ( Bearish )
Structure: Breakdown | Descending Triangle | Support & Resistance
Observation: i. A structure depicted by drawing one trend line that connects a series of lower highs and a second horizontal trend line that connects a series of lows confirms our Descending Triangle .
ii. This pattern clearly explains that the Demand for the USD is weakening;
iii . As we anticipate price to break below our lower support @ 7.05000 (a psychological level) indicating downside momentum will become stronger in the following week(s).
iii . In as much that we shall be wary of false Breakdowns at the lower support, we shall eye a further Breakdown of Daily chart Trendline with engulfing candles as comfort .
iv. Please note that as the price keeps putting pressure on the 1st Key level throughout last week, a Breakdown of this level might be a zone to initiate sell order for quick gains.
Trading plan: SELL confirmation with a minimum potential profit of 450 pips.
Risk/Reward: 1:2.5
Potential Duration: 1 to 5 days
NB: This speculation can be considered to make decisions on lower timeframes.
Watch this space for updates as price action is been monitored.
Risk Disclaimer:
Margin trading in the foreign exchange market (including foreign exchange trading, CFDs, etc.) has a high risk and is not suitable for all investors. The content of this speculation (including all data) is organized and published by me for the sole purpose of education and assistance in making independent investment decisions. All information herein is for your reference only and NFTI takes no responsibility.
You are hereby advised to carefully consider your investment experience, financial situation, investment objective, risk tolerance level and consult your independent financial adviser as to the suitability of your situation prior to making any investment.
NFT&I does not guarantee its accuracy and is not liable for any loss or damage which may result directly or indirectly from such content or the receipt of any instruction or notification therewith.
Past performance is not necessarily indicative of future results.

Chinese fight backThe resistance zone has worked well, and the rising wedge broke down definitely. Now a clear sideways movement is ongoing, so sooner or later the next downside pressure should come and lead the price below the rising trendlines.
Next target lies at 7, 6.85, 6.7 but I forecast more Yuan strengthening to 6.3.
Any trading above 7.2 will open the door in front of the USD bulls and further rising should come.
