Trending upThe trend is upward and we have corrected it in the week before. Thus I assume a continuing rise this week.
USDCNH trade ideas


USD CHN S/R 040919Major Fib level acted as good resistance 2 days back.
As far back as the given chart goes, the recent highs are in uncharted waters, however, I believe the major Fib level will hold (*but it could be tested again either forming a double top or breaking through. IMHO, TA may favour a double top but current fundamentals may push it through the top to form new highs).
Expecting a conservative retrace to the 7.152 zone. Current price broke out of a support zone. The idea is to wait for price to retrace and take a short off a PA on the previous resistance sand TP at the 7.152 zone.
SL above previous all time high. R:R is 1:1.
2 other supports (blue levels/zones) has to be broken in the middle for the above to happen. Look out for price rejection of these levels in either direction.
Separate trading plans could be made off these blue levels with PA on the LTF.

USDCNH: Sideways until the end of October?Weekly $USDCNH ended a trend recently, starting a consolidation period, as it has done since it bottomed this year like I anticipated. Upside movement in this pair is likely tied to money flowing outside of China via Hong Kong, which is also linked to money flows towards $BTCUSD to dodge capital controls possibly.
The next upswing in this pair hasn't yet confirmed, and it could take a few weeks to occur, which the last Time@Mode trend signal predicts will possibly happen by the end of October. The weekly has formed a new 8 week accumulation level up here (see cyan boxes), so it could flash a buy signal as soon as there is a rapid upside move in this timeframe, from next week onwards...
I'll keep an eye on this very critical pair, the current situation in Hong Kong is bound to create some shockwaves in the currency markets, and possibly crypto I think. Let's wait and see...I'm currently short $BTC, waiting for it to bottom, this pair might be a good indicator for that.
Cheers,
Ivan Labrie.

USDCNH Is forming a ascending triangle-pattern
And it is retesting the resistance line , remember the is a continuation for the uptrend


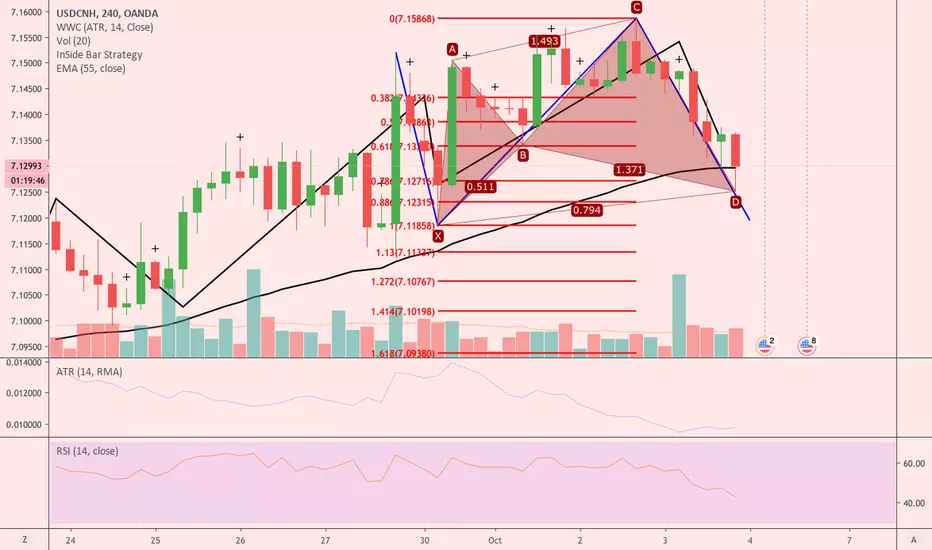
USDCNH respecting the patternUSDCNH found resistance at 1.272 level as expected. Our view is still on the upside targeting the 1.618 extension to close the ABCD pattern.

High Probability US Dollar Reversal is NowNFP is tomorrow. But frankly it's happening in context of a much larger stray of pattern setups on both major and cross minor pairs that harmonize together along with other macro energetic forces.
Timing is key. We have declining strength in a major indicator harmonizing with this Head and Shoulders pattern on the daily of USD-CNH. This lines up with other setup points on Major dollar pairs such as EUR/USD and USD/CAD which are either at key inflection points or have already reversed off them. All I can say is, I've seen these combinations happen before -- it's rare and not a coincidence.
This is a good time to do a little extra risk on shorting the US Dollar -- if your stop losses are wide enough that is (tight stop losses with NFP is dangerous). This trade time frame is too large a context and combining confluence factors to justify staying out of all markets just for NFP volatility fears.


Short DailyMovimiento probablemente bajista presentando patron de hombro-cabeza hombro en temporalidad D, donde el TP esta en el precio 6.98232 poniendo de SL hasta el 7.15000

USDCNH SHORTGoing short here. A head and shoulders reversal pattern appears to be forming. If it breaks the neck line theres no major support that would stop it until the red zone I marked out. My two target prices are marked by the green X's.
A "by the book" a head and shoulders pattern usually breaks down the length of the original head after retesting the neckline. I marked out the head measurement with the red price range and the green price range shows where that break down "should fall" which is where previous support/accumulation zones are which makes me more confident in this trade.

USDCNH - Supply and Demand Trading September 22, 2019I am observing the price action of this pair as I am planning to sell on the 4hr supply level and also in Daily. Maybe a quick take profit would be fine for the risk management part. Please don't forget to visit my YouTube channel: www.youtube.com

USDCNH HEAD AND SHOULDER PATTERNPrice action is at its all time high, this reversal pattern that is being formed at this area is very significant to test these previous swing highs and swing lows. Opening next week I will look for bearish momentum on the 4hr candles, possibly may wait for a daily close before entering.
