The key is whether the USDT and USDC gap downtrend will stop
Hello, fellow traders!
Follow us to get the latest information quickly.
Have a great day.
-------------------------------------
(USDT 1D chart)
USDT is showing a gap downtrend, leading to a decline in the coin market.
A gap downtrend in USDT or USDC can be interpreted as a sign of capital outf
Market Cap USDT, $
No trades
Key data points
Previous close
—
Open
—
Day's range
—
About Market Cap USDT, $
Coin
The pioneer of the stablecoin model, Tether combines the best of two worlds, fiat currencies and the blockchain technology. It's pegged to US dollar so that 1 Tether could always be traded for $1, which decreases the risks usually associated with crypto. At the same time, it's still built on a blockchain and comes together with all the related perks, like transparency, innovation, widespread adoption features. With its dual nature, USDT is "disrupting the global financial industry". It's always interesting to watch where such ambitions will lead — you can do it with the chart we've prepared. It shows USDT market cap, which is the number of coins in circulation times their current price. A growing market cap might be a good sign for investors — it means the market favors the coin. However, a decrease might start any moment, in which case you'd better wait and reconsider your strategy.

Tether Quietly Becomes One of the World’s Largest Gold HoldersThe level of Tether has been scaled to a new level. It now has a gold holdings of over 23billion. The total reserves are above 148 metric tons. This makes Tether one of the 30 best gold holders in the world. Many countries hold less. Few private firms hold more. This shift is not symbolic. It is an

$USDT & $USDC vs. $ETH - Warning a Funeral could occur. 💀 💀 💀
Watch the Stablecoin/ETH Market Cap ratio carefully.
A spike here isn't always 'Dry Powder' waiting to buy.
The Trap: If ETH breaks the $2,400 support level, we could see a 'Liquidation Spiral' that sends the ratio to all-time highs.
This isn't new money coming in—it's ETH value vanishi

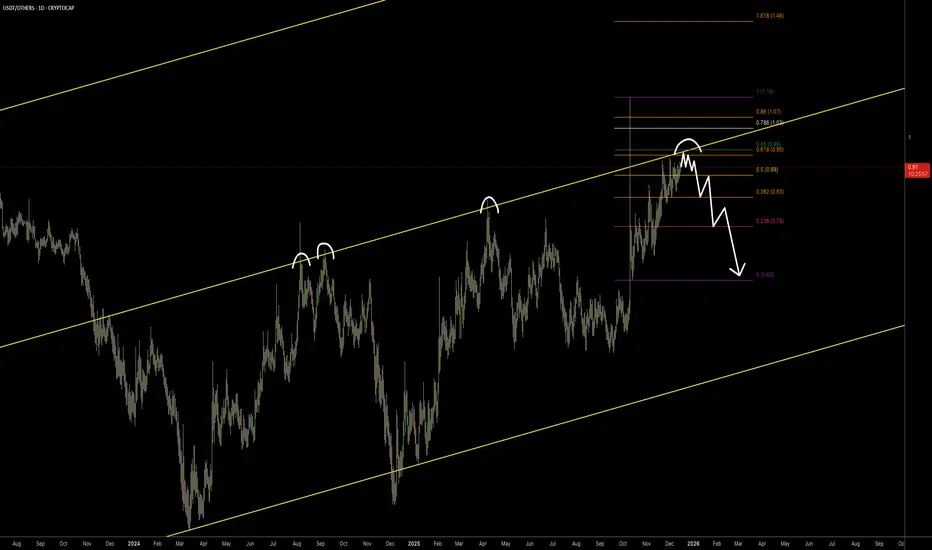
USDT/OTHERS - don’t miss this opportunity in the market.This is the pattern I’ve been using since 2021, which helped me predict market declines and the crash on October 10. At the moment, we’re close to its completion — take a look at the MAC.D. Don’t miss this opportunity in the market.

Altcoins likely have one last move left.If you look at the USDT/OTHERS chart, you’ll see that in this cycle, touching the channel’s midline has acted as the bottom for OTHERS. Historically, OTHERS has always put in its cycle low toward the end of December.
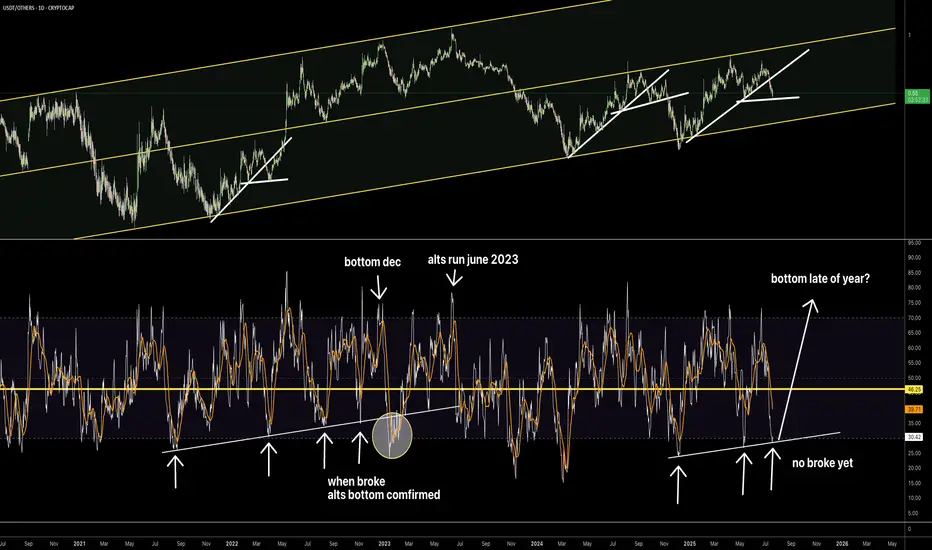
Where is the altcoin bottom?Hi everyone — keep a close eye on the 1D RSI of the USDT/OTHERS chart. As long as it holds, we’ll keep bouncing and seeing corrections. Only after it breaks can we start talking about a trend reversal.
Altcoins are in a similar channel as in 2022–2023.I believe that as long as the interest rate stays at 4.5%, we won’t see real growth in altcoins — only short-term pumps. Rate cuts are expected to begin in the summer, but it will take some time to have an effect. I would compare the current market to both 2019 and 2022.


ETH Bottomed last week!This chart illustrates the ratio of the market capitalization of the top three stablecoins and that of Ethereum (ETH).
The correlation is quite evident, as anticipated.
We are likely approaching a phase where these stablecoins will be deployed, with Ethereum being a key beneficiary, signalling t

My best-case scenario for ALTSFew people look at custom charts, and that’s a pity, because there’s a lot of truth to be found there. We’ve got fear in the market, and hardly anyone wants to buy right now.

See all ideas
Summarizing what the indicators are suggesting.
Oscillators
Neutral
SellBuy
Strong sellStrong buy
Strong sellSellNeutralBuyStrong buy
Oscillators
Neutral
SellBuy
Strong sellStrong buy
Strong sellSellNeutralBuyStrong buy
Summary
Neutral
SellBuy
Strong sellStrong buy
Strong sellSellNeutralBuyStrong buy
Summary
Neutral
SellBuy
Strong sellStrong buy
Strong sellSellNeutralBuyStrong buy
Summary
Neutral
SellBuy
Strong sellStrong buy
Strong sellSellNeutralBuyStrong buy
Moving Averages
Neutral
SellBuy
Strong sellStrong buy
Strong sellSellNeutralBuyStrong buy
Moving Averages
Neutral
SellBuy
Strong sellStrong buy
Strong sellSellNeutralBuyStrong buy
Displays a symbol's value movements over previous years to identify recurring trends.