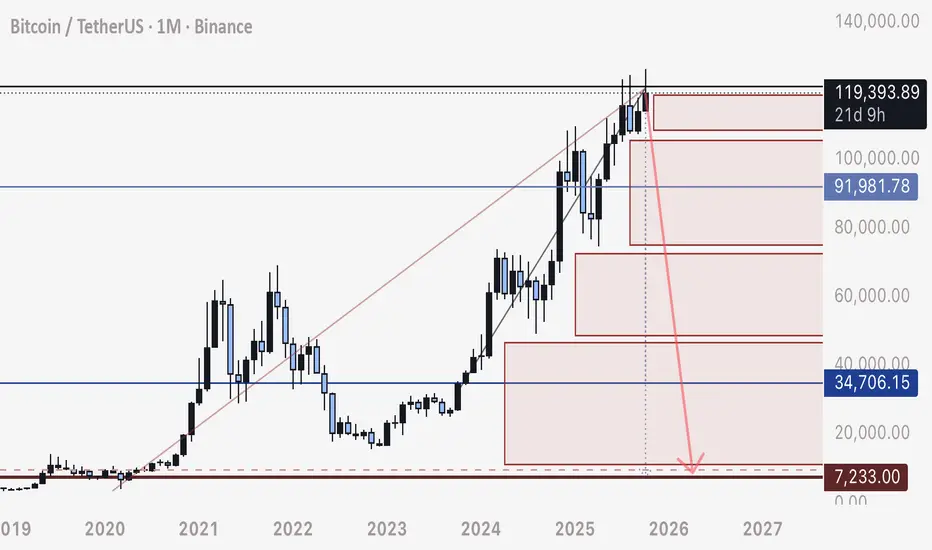
Why BTC will drop at EXTREME SPEED to 8,000This is a Segway off of all my recent posts, and here we will apply the same understanding of stop loss and liquidation order blocks to the 1 Month.
Bitcoin has been moving in a straight upwards consolidation with no actual retrace since Dec 2022.
What this does, is attract mass amount of stop loss orders, intact and left in place, through the whole movement.
These stop loss orders will create a natural cascading drop as they all fill, exponentially moving more and more liquidity out of BTC and into USD/ USDT.
Bitcoin will drop, at exceptional speed, and the chart tells us the whole story.
Be safe.
- DD
USDTBTC.P trade ideas
Short BTC at 123,200A potential ABC correction is forming of the 30min chart, that will take BTC down to 117,400 from 123,200. The short entry also coincides with a minor support tuned resistance and SMA(200).
Short Entry - 123,200
Target - 117,500
Stop - 124400

BTC Short-Term 1H🔹 General Context
On the chart, we see that Bitcoin:
Has broken the local downtrend line (yellow line), suggesting an attempt to change the short-term trend.
It is currently consolidating just above the 50/200 EMA, which is a positive sign for bulls.
We also see a MACD crossover in the positive zone and an RSI rising, but not yet overloaded (around 52–60).
🔸 Key Technical Levels
Support:
122.460 USDT – strong local support, aligned with previous lows and the 200 EMA.
121.900 USDT – next support, also marked by the blue 200 EMA.
120.600 USDT – deeper support, recent significant low.
Resistance:
123,700 – 123,900 USDT – resistance zone where the price is currently stalling (there was a reaction after the trendline breakout).
124,700 USDT – next resistance level (local high).
125,700 USDT – strong resistance resulting from previous swing highs.
🔸 Technical Indicators
📈 EMA 50/200 (golden cross on 1 hour):
The 50 EMA is breaking below the 200 EMA – a classic bullish signal (Golden Cross).
Confirmation requires the price to stay above 122,800 USDT for several H1 candles.
📊 MACD:
The histogram has turned positive, the MACD line is breaking above the signal line – momentum is increasing.
There is no strong negative divergence yet, so the signal is clear.
💪 RSI:
Value ~52–60 – moderately bullish.
It is not overbought yet, so there is potential for further upward movement.
🔹 Scenarios
✅ Bullish Scenario:
Sustainability above 122,800 USDT.
A breakout and retest of the 123,700–123,900 USDT resistance could open the way to 124,700 USDT and then 125,700 USDT.
The MACD and RSI support this scenario.
❌ Bearish Scenario:
A reversal from the current level and a decline below 122,400 USDT.
A retest of 121,900 USDT and a possible deepening correction to 120,600 USDT is possible.

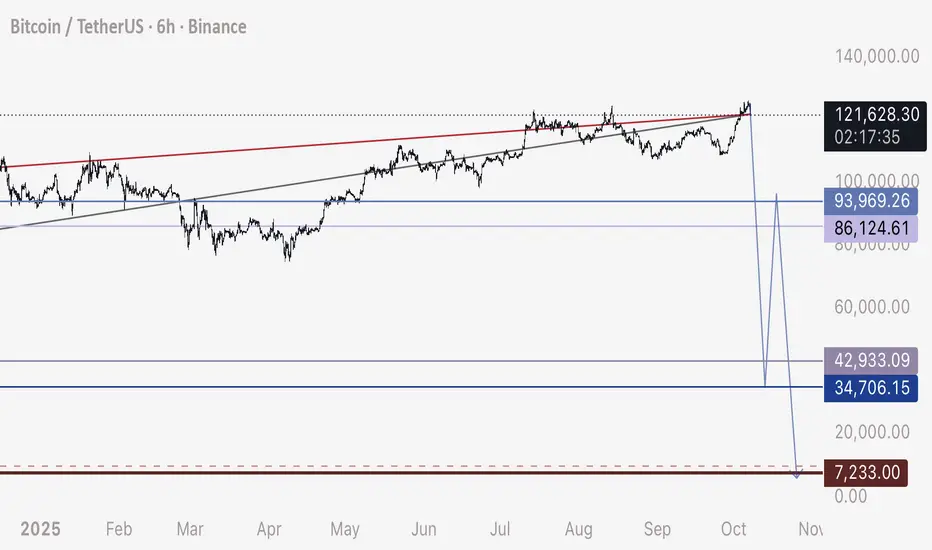
Bitcoin Crash Incoming - Watch for this 3 wave Move Here is a close up look at expected corrective path.
This move will be extraordinary fast, the fastest and largest drop we’ve seen in cryptos history.
Please see my linked related posts from today for a detailed overview of this theory, explanation, and helpful insights.
God speed and love to all.
- DD
Bitcoin overall: likely retracement soon then continuationNow that we’ve made another all-time high, I think it’s most likely for bitcoin, that we have some retracement before our continuation higher. Of course, if we do happen to make a new local low before continuation, there are levels of support immediately below the recent Lows. Regardless, I do think higher prices are most likely Even though this bull run should be nearing the final stages.


Descriptions about the market! Read the caption!Given Mr. Trump's remarks and the unprecedented crash in cryptocurrencies, I must say this individual significantly harms markets, especially investors. Imposing a 100% tariff on Chinese goods essentially means "we want no trade with you," which is fundamentally unfeasible. The United States and China will undoubtedly negotiate. However, our main focus here is the financial market collapse. This decline isn’t merely about falling prices—it goes beyond that. The core issue is the loss of market trust and credibility. Once confidence is broken, it is difficult to restore and may take a long time.
In any case, I felt it was my duty to bring this up and remind you to stay composed. Never forget to use stop-losses in your trades and practice proper capital management.
If needed, you can always message me on this platform for advice.
NOTE: This post is This post is educational.
Bitcoin Daily AnalysisHi Traders
Bitcoin Daily Time Frame After Liquidity Hunt A multi-layered level is currently above its own Hunt line. The upper and lower liquidity points on the chart are characteristic and the condition for reaching the lower liquidity points is to close the daily candle below the Hunt line 109.260 in this case the support level below the liquidity is characteristic for Trigger Buy

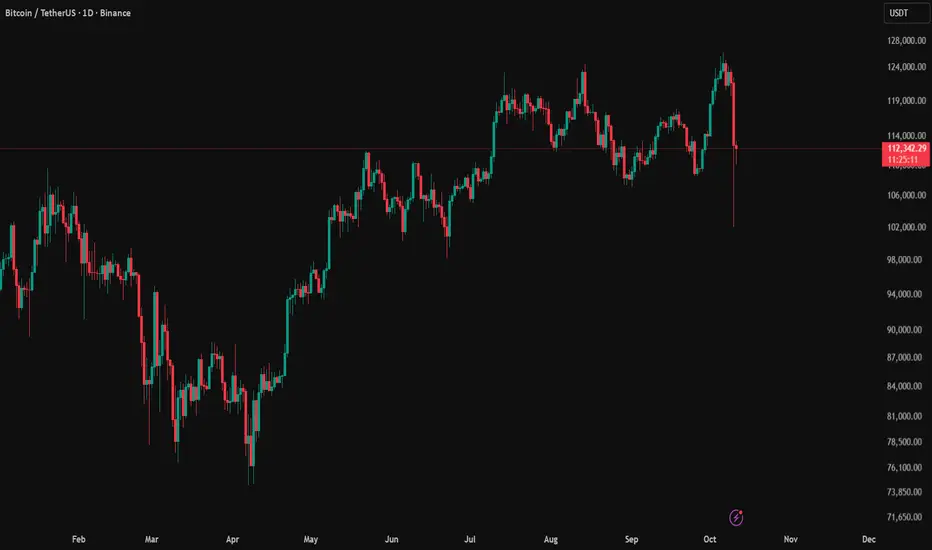
The crazy sweep on the market manipulation.BTC/USDT Update
Whoa… BTC just dropped from around 122k to 102k in no time — that’s a wild –20k move. 😳💥
The good news? It’s still holding above the key bull market support on the daily.
But to keep the structure intact, BTC needs a weekly close above 100k.
For now, patience. Let’s wait for the US or Asia market open and see what the whales are planning next. 🐋🐾
Tele & X: Ya_Bantaam

Market Crash Was Beyond Our Control — Stay Calm and FocusedSometimes, things happen that are completely out of our control — and the recent market crash was one of them. Everyone’s feeling the pain right now, but it’s important not to lose your composure.
News events don’t define the market’s long-term trend; they only create temporary shocks. Think back to the COVID-19 crash — the market dropped sharply, consolidated for a while, and then began a massive bullish recovery.
If you’ve taken losses, don’t get discouraged. Stay focused and keep monitoring the market, because this is not the time to give up. It’s entirely possible that, just like in 2020, after a brief recovery period, the market will start climbing again.
When fear drives the market down, remember — a single piece of positive news can turn everything around.
⚠️ One key lesson: Always expect the unexpected in high-risk markets.
If you trade futures, make sure to use isolated margin mode to protect your capital and prevent total liquidation.

Bitcoin long Looking for entry at lower level of npoc .
I think a push to the upside will commence soon .
Btc soon above 130k.
Let us wait.

BTC analysisBitcoin has broken below the support area and is currently testing the support range of $120,000 to $121,000. A drop below $120,000 would be bearish and could lead to further declines. A test of the $125,000 level is anticipated in the coming days.

Harmonic Pattern made ...Hello everyone
According to the chart that you can see the price of BTC was completed the harmonic pattern and according to the rules of the classical technical we expect the market after some correction rise up to the PRZ level that we shown and after that we update the analysis.
Be your hero
AA

BTC Pullback to $117K?”Bitcoin has recently reached a new all-time high. However, after such a strong upward move, the market could enter a correction phase, potentially pulling back to around $117,000 before continuing the larger trend.

BTC/USDT Bullish Channel – Eyes on $130K Targets🔍 Key Observations:
Trend Direction: Bullish
Price is moving consistently within an upward sloping channel, suggesting a strong and steady uptrend.
Current Price: ~$124,353
Price is near the lower boundary of the channel, indicating a possible bounce opportunity to ride the trend higher.
Targets:
Target 1: $128,001
Target 2: $130,100
These are potential resistance zones or profit-taking levels if the bullish move continues.
Structure:
The marked zig-zag path suggests anticipated higher highs and higher lows, in line with a typical channel-based bullish continuation.

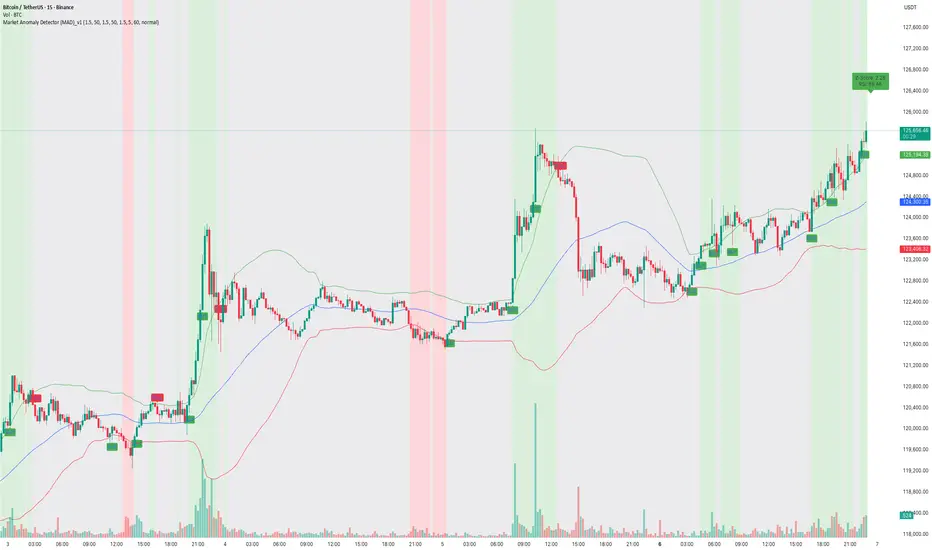
How to capture trend using MAD Indicator!📝 Description:
Watch how the Market Anomaly Detector (MAD) precisely captured the start of the Bitcoin breakout on the 15-minute chart — with no lag, early confirmation, and clear signals.
This BTC/USDT rally was flagged using:
• ✅ Z-Score Spike + RSI confirmation
• ✅ Volume Thrust + Trend Strength Filter
• ✅ Dynamic Zone Coloring for Visual Clarity
• ✅ Trade Cooldown Filter to avoid signal noise
💡 The green background highlights anomaly confirmation zones, while red indicates potential fakeouts or traps.
In this rally:
• The MAD indicator identified the compression breakout
• Maintained bullish zone with no false exit
• Generated a clean trend-following environment using adaptive logic.
🔍 Why MAD Works:
The MAD Indicator isn’t just about spotting anomalies — it adapts based on:
• Market volatility and relative volume
• Internal momentum using z-score logic
• Confirmation from RSI & EMAs
• A cooldown filter to prevent overtrading in choppy zones
📈 Perfect for scalpers, intraday traders, and short-term swing setups on crypto and stocks.
#BTCUSDT 2H ChartPrice reached a new ATH after breaking above our 4h supply zone turning it into a breaker zone. MACD is neutral, RSI is bought and EMAs are bullish. We will most probably see a continuation of the bullish momentum aiming towards a new ATH.

BTCUSD NEXT POSSIBLE MOVEBitcoin is currently testing a key support area after a healthy correction. If price holds above this zone, a bullish rebound can be expected.
Market structure remains positive as long as supports hold — buyers may regain control and push price toward higher levels.
Wait for a bullish confirmation candle before entering to ensure momentum shift in buyers’ favor.

DeGRAM | BTCUSD near the $120k level📊 Technical Analysis
● BTC/USD rebounded strongly from the 117,000 support, showing consistent higher lows along the support line, with bulls driving momentum toward resistance.
● Chart structure points to a pullback before continuation, targeting 124,450, as the pair remains within a broad rising channel.
💡 Fundamental Analysis
● Bitcoin gains support from increasing institutional inflows and optimism around U.S. regulatory clarity, with traders positioning ahead of potential spot ETF approvals.
✨ Summary
● BTC/USD maintains bullish structure above 117,000, with upside targets near 124,450, supported by both technical continuation and strengthening fundamental sentiment.
-------------------
Share your opinion in the comments and support the idea with a like. Thanks for your support!

Bitcoin Range Analysis: 110k-124k Breakout WatchHello everyone, as we can see, Bitcoin has bounced off the last major support at 109-110k. Currently, the latest resistance is at 124k, so the range to play in at the moment is 110-124k. We are waiting to see if the range will be broken upwards or downwards.

BITCOIN THE ROOF connecting the two most current highs on 3hr close provided a perfect point of entry and the best rejection for the daily candle.the zone of 124,478-125k was rejected.
i dont know if its possible to return to 116-117k zone ,however should price comes to this zone we have a buy floor ,based on the break and retest rule.
break and close 124,478-125k will expose 135k-145k zone depending on the volatility +liquidity in the market.
dont forget that take profit is on the way for earlier investors, dont let them dump this coin on you.
GOODLUCK
#BTC #BITCOIN

Trigger: 4h-close below 121.0–121.2kWhat does it mean now
1. The trend is very strong (ADX>60, CMF≫0, OBV-z≫0) — the bulls are in control.
2. But we are high above the VWAP/VAH and slightly above the KC-Upper, RSI≈74 / MFI≈80 + a series of bearish divergences → the risk of a rotation to the averages/HVN is increased.
3. OI is neutral → up-movement is held, but without a pronounced influx of new positions (less "fuel" for immediate acceleration).
⸻
Key levels
Resistance: 123 858 (Donch-High 20/55) → 124 157 (BB-Upper) → aVWAP swing high ~122,490 as the nearest magnet during an impulse (locally slightly lower than the current one).
Supports: 121,000–121,200 (top VAH 120,964 + local LVN ~120.7–121.2k) → 119,686 (KC-Mid ≈ EMA20) / 119,743 (BB-Mid) → 118,969 (Donch-Mid20) → 117,534 (KC-Low) → deeper 111 389 (POC).
HVN-clusters: 111.4–115.9k (magnet during deep correction). LVN thin: 118.3k / 119.1k / 120.7k / 121.2–123.4k — zones for "accelerations" during breakthroughs.
⸻
Scenarios and triggers (not financial advice)
A) Basic - rotation to the average/VAH with attempts to hold up the uptrend.
Why basic: overbought (RSI/MFI), z(Price−VWAP)~+2σ, exit above VAH, a series of bearish divergences; at the same time, the trend is strong (ADX, CMF), i.e. the expectation is a respite/reboot, not a reversal.
• Trigger: 4h-close below 121.0–121.2k (back inside value) and/or return below 120 964 (VAH), with RSI < 65, weakening of the MACD histogram.
• Targets: 119.7k (KC-Mid/BB-Mid) → 118.97k (Donch-Mid20) → 117.53k (KC-Low).
• Cancel: re-purchase and consolidation above 123,858.
B) Continuation of the upward trend.
• Trigger: holding above 121.9–122.5k and 4h-closing > 123,858 with a buffer of ≈ +0.1·ATR ≈ +110$ → > 123,970, while OBV z50 ≥ 0 and OI ROC(5) ≥ 0.
• Targets: 124.16k (BB-Upper) → 125.5–126.5k (above the band) → by inertia in the LVN-corridor 121.2–123.4k, quick "stretching" is possible.
• Invalidator: quick return < 122.0k.
C) Sharp "blowing" (clear refusal from above).
• Trigger: false exit at 123.9–124.2k with a long upper shadow, fix of bearish RSI/MFI divergences on highs, OI↑ on a red candle, MACD histogram ↓.
• Targets: 121.2k → 119.7k → 117.5k; if weak, test 118.3k / 119.1k (LVN-pockets — straits can be fast).
⸻
Tactics (example of logic)
• Reversal long: zones 121.2k / 120.96k / 119.7k at signs of demand (CMF ≥ 0, candle reaction, OBV z50 is held ≥ 0). Targets: 122.5k → 123.9k; stop - under the local LVN (e.g. < 120.7k), buffer ~0.5×ATR ≈ 550$.
• Impulse long: after fixing > 123,970. Partial fixes at 124.16k and 125.5–126.5k; trail on EMA20/KC-Mid.
• Contra-trend short: only when 123.9–124.2k is rejected + confirmed divergences (RSI/MFI/OBV) and MACD weakening. Targets: 121.2k → 119.7k → 117.5k; stop at 124.3–124.6k.
⸻
Briefly: what to expect
The trend is strong, but the market is overbought and stretched to VWAP/VAH/KC-Upper with a series of bearish divergences. I expect a rotation to 121.2k → 119.7k to reset the momentum.
• If we get above 123,970, we can go to 124.2k → 125.5–126.5k.
• If we stay below 121.0–121.2k and VAH — a deeper correction to 119.7k → 117.5k is likely; only breaking through these zones opens the way to POC ~111.4k (this is unlikely at the current ADX/CMF).

Now 127,000… BUT?!First of all check may 3 days ago published analysis
Now its time to go to 127,000!
But before they will hit again. Then 127K
