Price Trend Under Economic News InfluenceHello everyone,
Ethereum is showing important signals on the 4-hour chart as the price recently touched the $4,180 level and started to correct. Several Fair Value Gaps (FVG) have formed densely within the $4,000–$4,100 zone, suggesting that the market may return to this area for balance before determining sustainable bullish momentum. This will be a key support zone in the short term, where buyers could test their strength.
The strong volume increase at the end of September indicates continued demand, but the resistance at $4,180 may cause ETH to retreat to $4,100–$4,050 before gathering momentum to move up again. If the support holds, the bullish trend could continue towards $4,300, and even potentially reach $4,500–$4,600 if resistance breaks.
However, upcoming volatility will largely depend on US economic data, especially the NFP report. A weak report could boost expectations for policy easing, supporting ETH's rise, while strong data may apply downward pressure. Furthermore, geopolitical tensions and the risk of a US government shutdown remain unpredictable variables.
What are your thoughts on this scenario? Will ETH correct, or will it continue its breakout? Share your opinion in the comments below.
USDTETH.P trade ideas

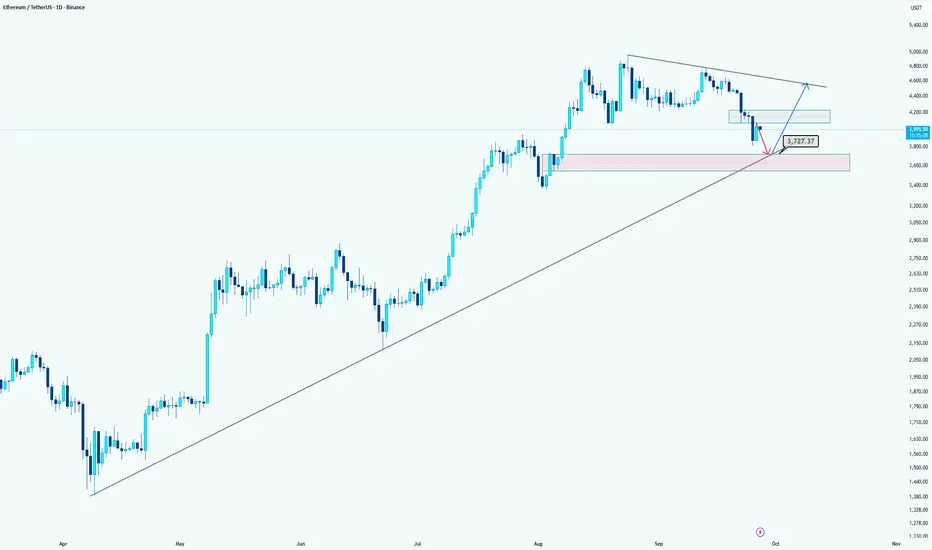
Ethereum: Levels to WatchHi guys!
Ethereum is currently showing weakness after failing to break higher. The price is likely to retest the MPL zone around $3727, which also aligns with the long-term ascending trendline, making it a strong confluence support.
The pink area highlights a potential demand zone where buyers may step in. If the market confirms bullish signals in this area, a long position toward the descending trendline resistance could be considered. However, extra confirmations are recommended before entering long.
Summary:
Short-term target for shorts: $3727 (MPL plus trendline support).
Watch the pink zone for potential long entries, but wait for confirmation.
Let's see what will happen!
Ethereum in the Accumulation Phase | Valhalla is NearEthereum is following a fractal pattern with consistent sizes. According to on-chain data, withdrawals of Ethereum from exchanges to cold wallets are currently very high, which itself is a supply shock. This chart indicates that we are in the process of accumulating Ethereum, and in the medium term, Ethereum can easily reach new all-time highs. Wishing you success.

ETH – Bulls Eyeing the Next Push!ETH has been showing strength after reclaiming the $4,000 psychological level and breaking back above structure. Price is now trading inside a rising channel, keeping the overall outlook bullish in the short term.
At the moment, ETH is hovering around the $4,040–$4,000 support area. This zone aligns with the lower red trendline of the channel, creating a strong confluence for potential bullish continuation.
As long as ETH holds above this zone, I’ll be looking for long opportunities with the next impulse higher in mind. If broken downward, however, we could see a deeper correction before the bulls step back in.
The key level to watch remains $4,000 . Stay above = bullish bias intact. Break below = caution for further downside.
Do you think ETH will maintain its momentum above $4,000, or will the bears step in for another retest lower? 🤔
⚠️ Disclaimer: This is not financial advice. Always do your own research and manage risk properly.
📚 Stick to your trading plan regarding entries, risk, and management.
Good luck! 🍀
All Strategies Are Good; If Managed Properly!
~Richard Nasr

ETH PRZ RANGEEthereum is in an attractive range for demand (PRZ range , fib 0.618 , HD+ , candle pattern...).

ETHEREUM → False breakout of 4100. Panic?BINANCE:ETHUSDT is forming a false breakout of resistance on the daily chart, formed by the ATH of the previous bullish cycle - 4100. Closing below this level could cause panic in the market...
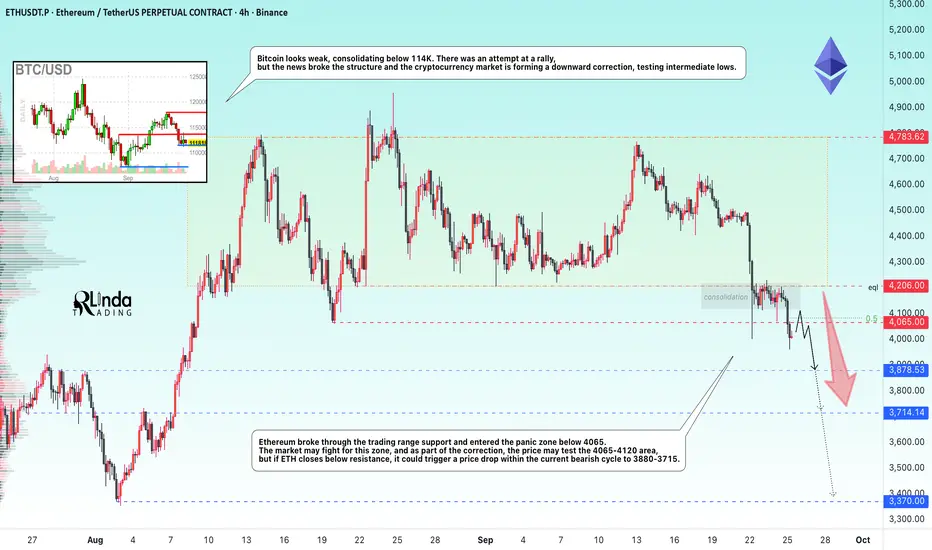
Bitcoin looks weak, consolidating below 114K. There was an attempt at a rally, but the news broke the structure and the cryptocurrency market is forming a downward correction, testing intermediate lows.
Ethereum broke the support of the trading range and entered the panic zone - below 4065. The market may fight for this zone, and as part of the correction, the price may test the 4065-4120 area, but if ETH closes below resistance, it could trigger a price drop within the current bearish cycle to 3880-3715.
Resistance levels: 4065, 4120, 4206
Support levels: 3880: 3715, 3370
On D1, the structure is weak, the price breaks through 4100-4090 and consolidates in the sales zone. Everyone who bought above 4100 can now start active sales due to the activation of stop orders, panic, fear, and the reversal of their positions. If the market does not receive support (bullish driver), the correction may continue. The nearest target is 3878 - 3715 7 3400
Sincerely, R. Linda!
ETHUSDT - Faces Downtrend👋Hello everyone, glad to see you again. Let’s take a look at BINANCE:ETHUSDT !
Currently, Ethereum is moving in a clear downtrend. After breaking through the support zone, the decline has intensified. The current resistance levels are around 4,300 USD and 4,450 USD. If the support at 4,100 USD is not held, ETH may continue to experience further correction.
With the Fed's rate cuts and geopolitical issues like the Russia-Ukraine conflict increasing market instability, capital is flowing out of riskier assets like cryptocurrencies. This will continue to put downward pressure on ETH.
Unless there's a reversal from this zone, the strategy and scenario mentioned above seem likely. My target is a short-term price decline. What about you?
Feel free to leave your thoughts in the comments below.
Good luck!

ETH. Sell & buy opportunity As it shown in chart the price will keep going down until he hit 4,071.65 after that we will see a small correction and will keep going down until he hits 3,871-3,811 best area to buy from it and wait the market to take you to the top again 4,500

Be careful with ETHEREUM !!!Currently, our only dynamic support is the bottom of the channel. If the price respects this level, it could move upward. However, if this support is lost, the next support for Ethereum would be the PRZ (Potential Reversal Zone) area.

Ethereum (ETH) – Bounce From $3,800 Reclaims Daily SupportEthereum has bounced strongly from $3,800, a level backed by the 0.618 Fibonacci and VWAP
ETH’s correction into $3,800 found immediate buyer interest, marked by an engulfing candle that confirmed market strength. Despite a lack of immediate follow-through, the setup has reinforced confidence in the bullish trend.
Key Technical Points:
- Bounce from $3,800 confluence zone (Fibonacci + VWAP).
- Bullish engulfing candle reinforced strength at support.
- Daily support reclaimed, opening path toward $4,950.
The $3,800 region served as a critical pivot for Ethereum. Price respected this zone and rebounded with strong momentum, confirmed by a bullish engulfing close. The reclaim of daily support marks a structural improvement, creating conditions for continuation.
Volume and follow-through remain key. Sustained buying pressure above current levels would confirm the bullish bias and open the door to higher targets. Failure to hold daily support would weaken sentiment and expose ETH to another corrective move.
What to Expect in the Coming Price Action:
As long as ETH trades above daily support, a rally toward $4,950 is the likely scenario. Losing this level would reduce bullish confidence and reopen downside risk.

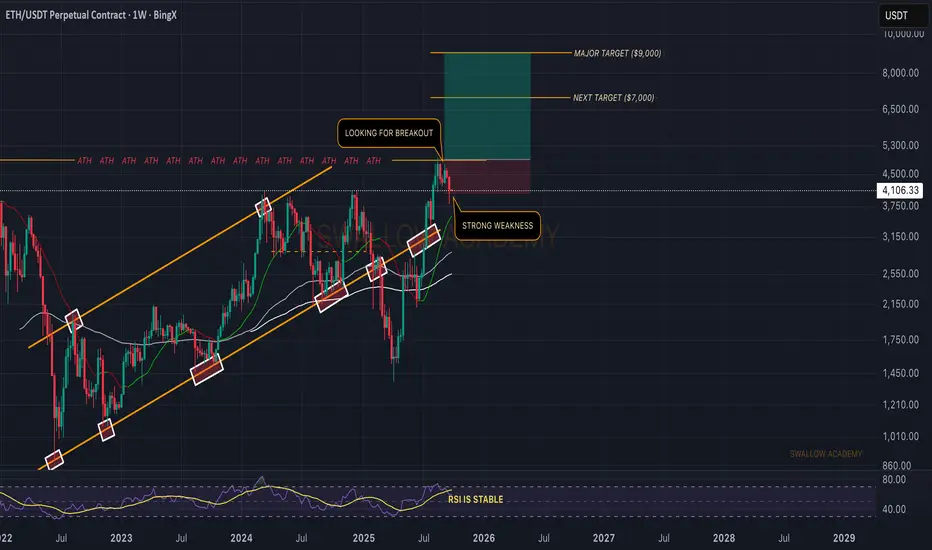
Ethereum (ETH): Expecting Breakout From Resistance | Bullish AFETH is cooking something here; the price is back close to EMAs and the resistance area, where the price most likely will be going for a breakout, opening a potential for a new ATH, which we aim to be $5555.
The start of the month is good; now we need to see that buyers maintain the dominance near current zones!
Swallow Academy

Ethereum: Bounce From Support, Eyes on $4,740Ethereum: Bounce From Support, Eyes on $4,740
Ethereum has bounced from the $4,050–$4,100 support zone.
If momentum continues, the next targets are $4,335 and $4,495, with the main resistance at $4,740.
As long as ETH holds above the support, the outlook is bullish with potential continuation upward.
We are still in an uptrend and the current downtrend may have been a moment of accumulation before ETH moves further. We may be in something more complex and growing still.
A drop below the support zone of 4050 could change the scenario.
You may find more details in the chart!
Thank you and Good Luck!
❤️PS: Please support with a like or comment if you find this analysis useful for your trading day❤️

ETH Short Update - First Target Hit, Next Targets on their WayETH has successfully dropped from our entry.
First target has been hit, short has fully began and we will see a very fast drop to lower targets.
Good luck and be safe out there.

Ethereum Tests $3,900 Support as Bulls Defend Critical Support Ethereum (ETH/USDT) has faced notable selling pressure in recent days, bringing price action down to test a high-confluence support region at $3,900. This area, sitting directly on the 0.618 Fibonacci retracement and VWAP support, will play a decisive role in whether ETH resumes its uptrend or enters a deeper correction phase. Traders are closely watching this level to gauge short-term momentum and potential longer-term implications.
Key Technical Points
- Support Test: Ethereum is holding at $3,900, confluenced by the 0.618 Fibonacci retracement and VWAP support.
- Upside Potential: A higher low at this level could reignite bullish continuation toward new highs.
- Downside Risk: A breakdown exposes ETH to a deeper correction toward $3,454.
The correction over the past few days has erased some of Ethereum’s recent gains, but the structure remains broadly bullish as long as $3,900 holds. Historically, the 0.618 retracement has often served as a springboard for continuation moves during trending markets, making this level technically significant.
From a structural perspective, the bullish thesis rests on the establishment of a higher low at $3,900. If confirmed, Ethereum could resume its upward trajectory, building momentum toward key resistance zones. However, the alternative scenario of losing this level would signal deeper weakness, opening the door to a correction down to $3,454, where the next liquidity pool resides.
Ethereum’s movement has mirrored the broader market correction, but relative strength has kept the macro structure intact. On-chain activity, coupled with demand for ETH in DeFi and staking protocols, continues to provide a supportive backdrop. Still, the next few daily closes around this support region will be decisive.
What to Expect in the Coming Price Action
If Ethereum holds the $3,900 confluence level, expect the market to build a higher low, setting the stage for bullish continuation. A sustained close below this level, however, would trigger a deeper retracement toward $3,454, where bulls would need to regroup.

ETH - 1D Elliott Wave Analysis - 27.09.25Welcome
Our warning of downside risk in the last analysis played out fast.
Here we count the ATH that we made in the last analysis as green and blue Wave 5 and white Wave 3 instead of an overshooting B Wave. Which way you count it doesn't make a difference in the short term and in terms of next targets to the downside.
We assume we are in the white Wave 4 correction which will finish soon within the red ABC. The support area of this Wave 4 is between the 0.236 FIB at 4059 USD and the 0.5 FIB at 3370 USD. We removed the 0.236 FIB from the Wave 4 support to keep the chart clearer.
On the smaller timeframe it looks as if we can go a bit lower in the red Wave C. The next targets for it would be the 1.382 FIB at 3798 USD and the 1.618 FIB at 3653 USD. This is also in confluence if you count the ATH as overshooting B Wave as we did in our last analysis (1.618 FIB target at 3705 USD) and additionally it is close to the 0.382 FIB of the Wave 4 support area which usually is a key support for a Wave 4.
After the correction finishes in the white Wave 4 we expect a rally that should take us above 5600 USD+.
Thanks for reading.
NO FINANCIAL ADVICE.

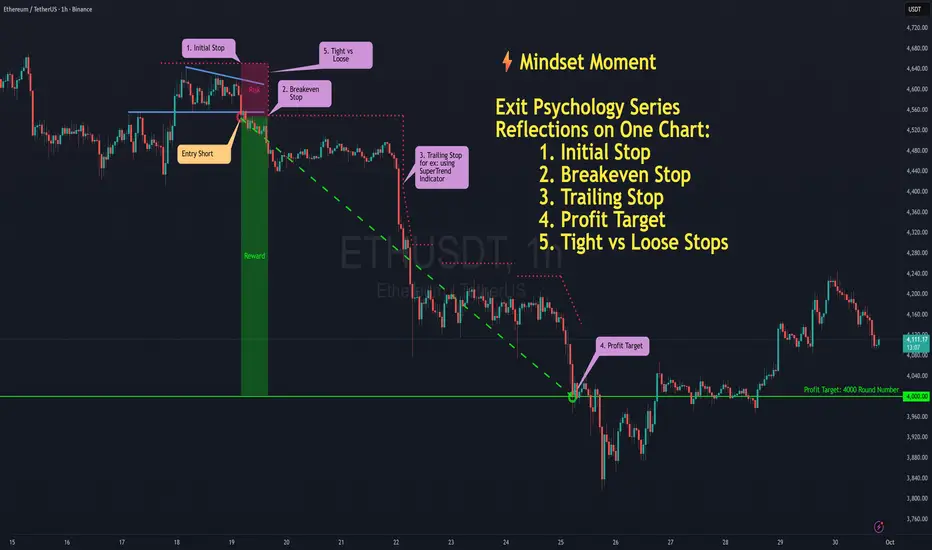
Exit Psychology – Reflections On The SeriesNOTE – This is a post on Mindset and emotion. It is NOT a Trade idea or strategy designed to make you money. If anything, I’m taking the time here to post as an effort to help you preserve your capital, energy and will so that you are able to execute your own trading system as best you can from a place of calm, patience and confidence.
Over the last few posts we’ve walked through the psychology behind many exits. Here on this chart, you can see how they all might have played out on a single trade.
One trade, four different exits. Whichever you choose to implement isn’t just a technical decision - it’s a psychological mirror.
Taking each in turn:
The initial stop: the line where you admit, “The trade idea didn’t work”
The break-even stop: the comfort of “I can’t lose now.”
The trailing stop: the wrestle between protecting gains and letting them run.
The profit target: the choice between certainty and potential.
Put them all on the same chart and you’ll notice something: none of them are just about price. Each is a reflection of the trader making the call.
What we’ve uncovered in this series:
The initial stop tests whether you can accept being wrong on a trade idea without making it personal.
The break-even stop shows how much discomfort you’re willing to tolerate before reaching for relief.
The trailing stop mirrors your balance between fear of giving back and trust in your process.
The profit target surfaces your relationship with certainty versus possibility.
And tight vs. loose? That isn’t just a preference. It begins with trader type: your personality, values and beliefs set a natural baseline. It’s shaped further by how well your strategy fits that style. And in the moment, emotion (fear or hope) nudges you tighter or looser than planned.
The bigger reflection:
Exits reveal more than entries. They show how you handle:
Loss and regret.
Control and uncertainty.
Trust and identity.
Comfort and growth.
But reflection alone isn’t enough. To turn insight into progress, you need practical ways to anchor behaviour:
Pre-commit in writing: Note where you’ll exit before you enter, it closes the door to mid-trade negotiation.
Separate outcomes from emotions: Journal not just where you exited, but how you felt in the moment. Patterns emerge quickly.
Differentiate protecting vs. controlling: Ask yourself, “Am I moving this stop to protect the plan, or because I’m uncomfortable right now?”
Train the nervous system: Notice the physical urge to act and how it shows up in the body (ex: shallow breath, tense shoulders). Pause before execution and breathe. Slow down the ‘urge’ and re-train self trust.
These small practices are how you build the consistency to stay aligned with both your system and your psychology.
Closing thought:
The market doesn’t care where you exit. But your mindset does - and so does your account.
Clarity in those decisions is where growth begins and where your odds of staying in the game increase.
In the end, your edge isn’t only your system. It’s your state of mind - before, during and after engaging with the market.
I hope you’ve enjoyed this series. If so would love to hear in the comments.
Here’s a recap of the entire Psychology of Exits series in case you’d like to check out the details of each:
Exit Psychology 1/5 : The Initial Stop
Exit Psychology 2/5 : The Break-Even Stop - Comfort or Illusion?
Exit Psychology 3/5: The Trailing Stop – Patience vs Protection
Exit Psychology 4/5 : The Profit Target – Certainty vs. Potential
Exit Psychology 5/5: Tight vs. Loose
And finally here is the link to the original article by TradingView that inspired this series as promised:
p.s. Apols if anything is odd in this post, I have had to repost it.
Ethereum: Bullish ContinuationEthereum: Bullish Continuation
Ethereum recently broke out of a bullish triangle pattern, which usually signals a bullish move. After this breakout, the price is now pushing higher with strong momentum.
The first target is around 4450, where ETH could face resistance.
If it breaks that level, the next target is around 4600, which is a stronger resistance zone.
Overall, the chart suggests that ETH is in a bullish continuation pattern, and as long as it stays above the breakout zone, it could keep moving upward step by step toward those targets.
You may find more details in the chart!
Thank you and Good Luck!
❤️PS: Please support with a like or comment if you find this analysis useful for your trading day❤️

Peter Schiff bearish posting about Ethereum at S/R levelInteresting to see FUD at S/R levels
Short support & sell the bottom
Trade your charts not others opinions

Ethereum (ETH): This is Nothing, We Expect Parabolic Movement!This Bullish cycle can't continue without ETH forming new ATH, and seeing all the manipulation near current ATH we are seeing ismilarities with BTC when it had also been forming new ATH.
Anyways, gameplan remains the same, you want it or not, we are going to see a new ATH very soon.
Swallow Academy
ETHEREUM ETHUSDT WEEKLY CHARTTHE WEEKLY chart of Ethereum is giving us currently a double top structure and the break of the neckline and the retest of the neckline will cause a clear break out from the current weekly support at $3,854.47$ holding seller from down swing.
the next support shout we breakout from the weekly support at $3.854.47$ will be around $3,229.40$ and final demand will be $2,309.76$
take profit is part of trading and the trend is still bullish.
#ethusd #ethereum.

ETH - Near ATH… Price Discovery Reload?BINANCE:ETHUSDT ETH has marched back to its cycle ceiling on the weekly after a long range. We’re now pressing the final resistance band around $4,880–$5,000—where a clean breakout would shift ETH into price discovery again.
Confluence is strong here: prior ATH supply + round-number magnet + momentum structure. If buyers clear $5K with a weekly close, I’ll look for the next leg toward $6.5K–$7.25K, then a stretch path into five digits as discovery unfolds. If rejected, a healthy retest toward $4,100–$3,550 would keep the uptrend intact while the range persists.
What’s your plan => buy the weekly breakout above $5K, or wait for a dip into $4.1K for better risk–reward? 🤔
⚠️ Disclaimer: This is not financial advice. Always do your own research and manage risk properly.
📚 Stick to your trading plan regarding entries, risk, and management.
Good luck! 🍀
All Strategies Are Good; If Managed Properly!
~Richard Nasr

ETH/USDT -> Clear Head & Shoulders → bearish biasHello guys!
Pattern: obvious Head & Shoulders on the 4-hour. The neckline was taken out by a large bearish candle, which is a good confirmation of the breakdown.
Retest: price is testing the broken neckline/supply zone (blue box). The current action is a classic retest → if it gets rejected here again, probability favors more downside.
Target: the measured move projects into the red box; roughly ~$3,850 (range $3.7k–$3.9k depending on where you measure the neckline/head). This level also lines up with the last major resistance zone, so it’s a natural magnet.
Momentum: RSI showed divergence around the head and has dropped into oversold territory with a small relief bounce.
Invalidation: a clean, sustained reclaim and close back above the blue supply zone (above ~4.32–4.40k with conviction) would invalidate the immediate H&S bearish thesis and open the door for a deeper retrace.
-----------------------
A simple trade idea:
Short on a failed retest of the blue box (4.20–4.32k) after a bearish price candle.
Stop: just above the supply zone / last swing high.
Targets: scale profits into 3.9k then 3.8k (final target ~3.7–3.9k). Trail if price action turns constructive.
Manage risk: keep position sizing sensible.

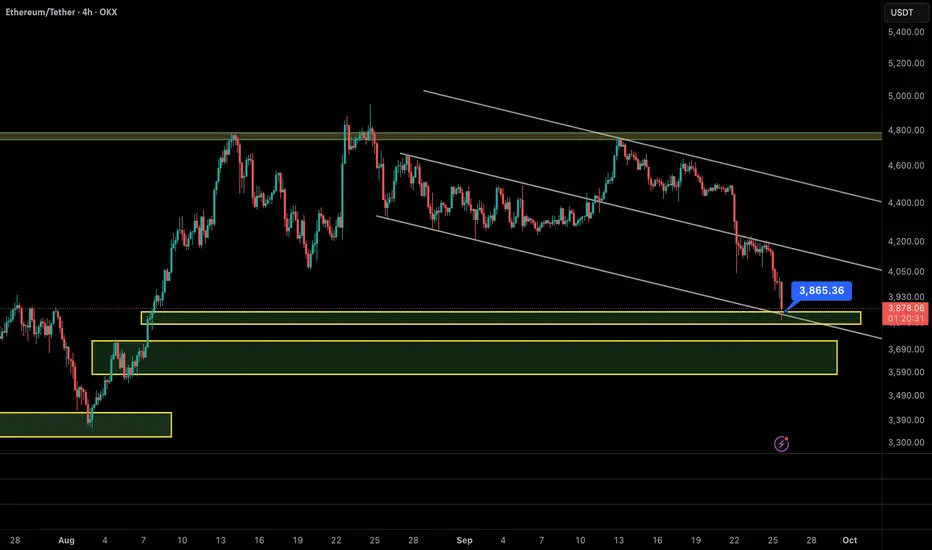
Ethereum (ETH/USDT, 4H) – Bounce Setup After Textbook Drop In my previous analysis, I highlighted the $4,700–$4,800 zone as a critical resistance cluster. ETH was rejected exactly from $4,720 and dropped sharply to $3,850, just as projected. ✅
⸻
🔎 Current Outlook:
• ETH has now reached the lower boundary of its descending channel.
• Price is sitting right on the $3,850 support zone, where buyers are showing early signs of activity.
• Momentum indicators suggest that the downside pressure may be exhausting, increasing the probability of a relief rally.
⸻
📊 Scenarios:
🔸 Bullish Reversal (more likely):
If $3,850 holds, ETH could rebound toward:
• First target: $4,100–$4,200
• Extended target: $4,400
🔸 Bearish Case (alternative):
A clean breakdown below $3,850 would expose the next demand zone at $3,600–$3,700.
⸻
📌 Conclusion:
After a sharp and accurate rejection from $4,720, Ethereum is now testing strong support at $3,850. Given the confluence of channel support and demand, the odds favor a bounce scenario over continued downside.