Ethereum price pullback before Fed rate cutsWith the FED rate cuts just around the corner. The market is screaming bullish and euphoric. I do see this $4,200-$4,300 level being tested before moving higher during or after the cuts are announced.
Could we see a buy the rumour and sell the news event?
USDTETH.P trade ideas

Long ETHUSDTHello traders!
After a succesful break above resistance, I'm looking for this scalp long.
Don’t forget to like and share your thoughts in the comments! ❤️

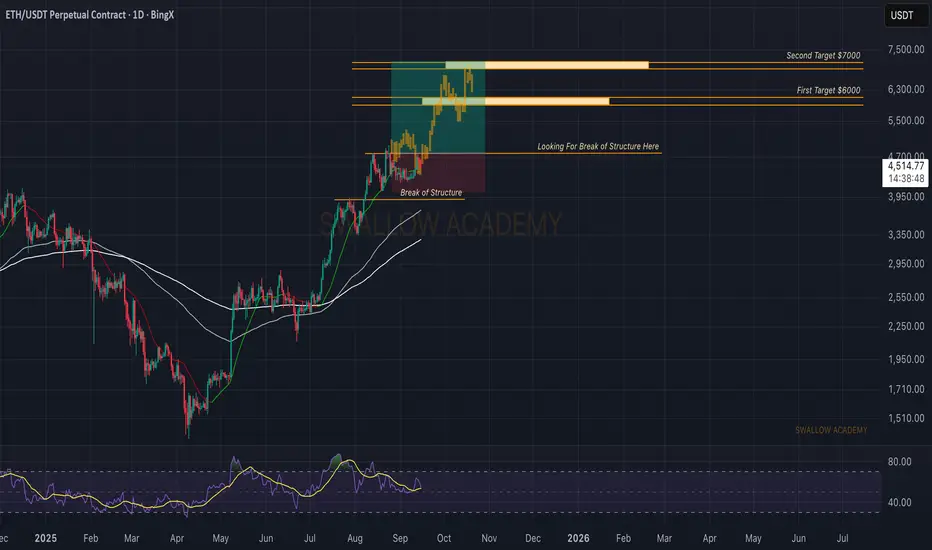
Ethereum (ETH): Looking For That Break of Structure | Bullish AFETH is still waiting for that break of structure, and once it happens we are going to be looking for a push into new ATH levels. Monday came with a bloody move, but for now it looks nothing more than a shakeout before buyers step back in and take control.
Swallow Academy
ETH/USDTI think wave B is in the form of a completed triangle for wave C, so I will open a short position with this setup.

Ethereum (ETH): About To Explode | Very BullishGameplan remains the same, we wait for a break of the local high. Buyers keep the momentum, and once that breakout happens, we look for a strong move to the upside. First target sits at $7K, with $9K as the major one.
Swallow Academy

#ETHUSDT 4H ChartPrice previously reached the 4h supply zone where it got rejected perfectly as predicted. MACD is currently showing bearish indications, RSI is neutral and EMAs are bullish. Mix indications overall, but price is currently expected to tap into the 4h demand zone at around $4,450 before potentially continuing its bullish movements.

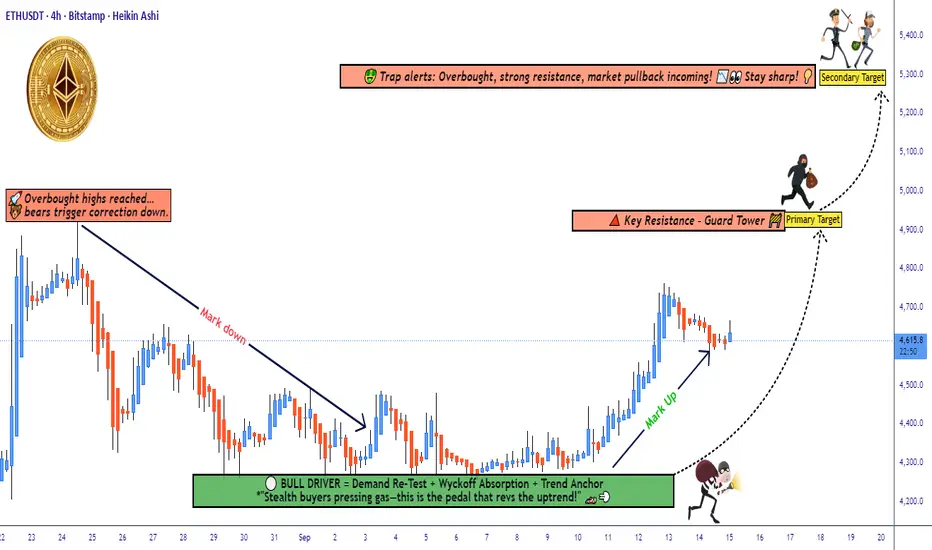
ETH/USDT Technical Outlook: Demand Layer Entries vs Trap Risk🚀 ETH/USDT | Ethereum vs Tether 💎
Crypto Market Money Looting Plan (Swing/Day Trade)
📌 Trade Plan (Bullish Outlook)
Setup: Demand Re-Test ✅ + Wyckoff Absorption 🔑 + Trend Anchor ⚓ (buyers confirmed presence)
Entry Style (Thief Layers 🪙): Using layered limit entries — examples: 4500, 4550, 4600, 4650 (you can add more layers as per your own method).
Stop-Loss (Protect the Vault 🔒): Example zone near 4400 after breakout. Adjust SL to fit your own risk appetite & personal strategy.
Target 🎯:
🎯 Primary: 4900 (local resistance)
🎯 Secondary: 5300 (major resistance / overbought zone)
🧾 Notes for Thief OG’s
This plan is not financial advice, only an idea. Always manage your own entries, SL, and TP.
Think of it as a vault strategy: take money, then protect money.
🔗 Related Pairs to Watch
BINANCE:BTCUSDT → ETH often follows BTC’s momentum. A BTC breakout/false move can affect ETH.
BINANCE:ETHBTC → Good pair to confirm ETH’s relative strength vs BTC.
BINANCE:SOLUSDT & BINANCE:BNBUSDT → Correlated majors; watch for rotation of capital in altcoins.
✨ “If you find value in my analysis, a 👍 and 🚀 boost is much appreciated — it helps me share more setups with the community!”
#ETH #Ethereum #Crypto #USDT #Altcoins #SwingTrade #DayTrading #LayerStrategy #Wyckoff #ThiefPlan #TradingView #CryptoTrading
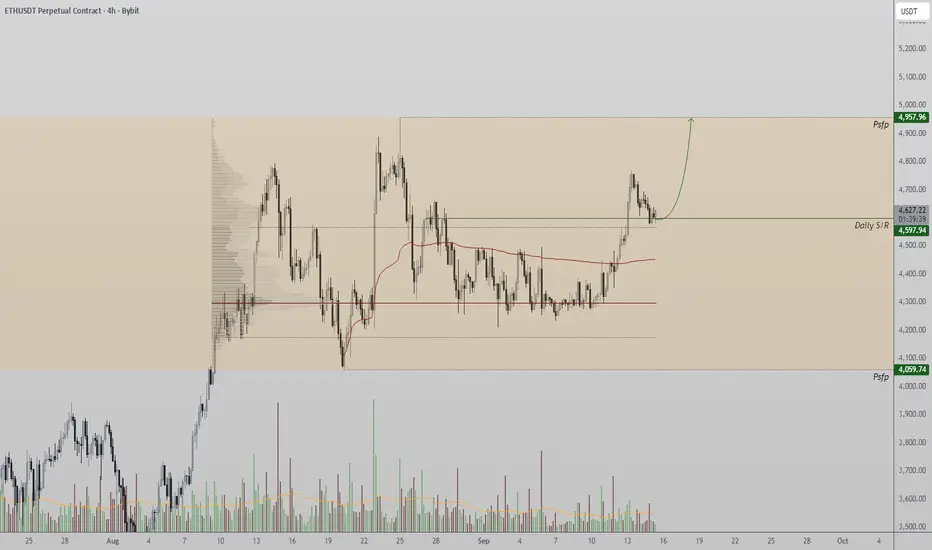
Ethereum - follow the plan Ethereum - follow the plan
new long after a local range
1st target 4957
full TP - 5393

Ethereum Retests Support and Eyes Higher ObjectivesETH price action has recently pivoted from key daily support, maintaining the broader uptrend. With structure intact and value area high reclaimed, buyers continue to show dominance.
Key Technical Points:
- Daily support at $4,600 has held.
- Value area high reclaimed as support.
- Potential upside target sits at $4,950.
The $4,600 level has proven to be a crucial foundation for Ethereum. After multiple tests, this region continues to hold as buyers defend it, creating conditions for a push higher. The bounce coincided with a reclaim of the value area high of the current range, a technical signal that suggests acceptance above prior supply.
Price structure remains bullish, with ETH printing consecutive higher highs and higher lows. This reflects healthy market dynamics and increasing demand. Importantly, each consolidation has been absorbed efficiently, leaving ETH primed for continuation.
If momentum persists, the $4,950 level is the next logical target. This region represents not just a technical objective but also an area where previous sellers might attempt to defend.
What to Expect in the Coming Price Action:
As long as ETH trades above $4,600, buyers retain control. Continuation toward $4,950 remains probable, with invalidation only if $4,600 breaks on strong volume.
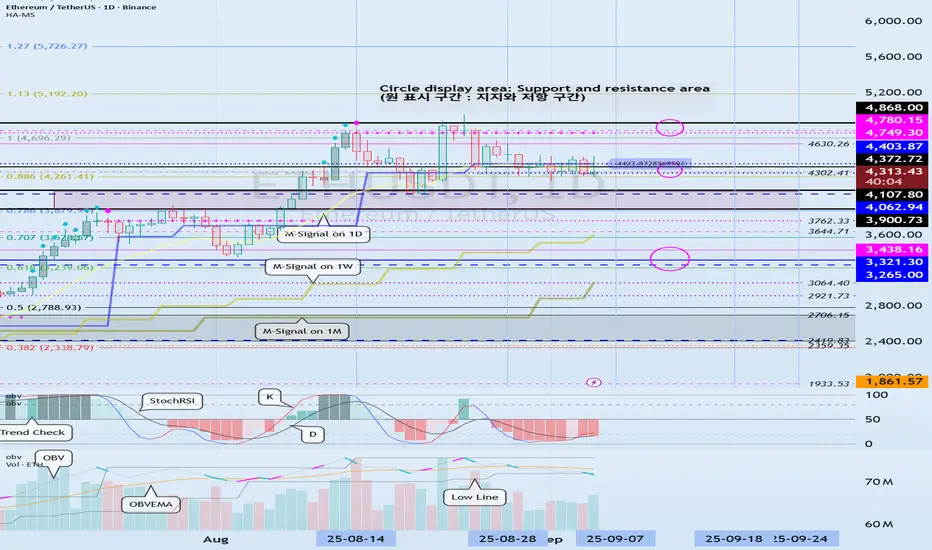
Volatility Period: Around September 7th (September 6th-10th)
Hello, traders!
Follow us to get the latest information quickly.
Have a great day!
-------------------------------------
(ETHUSDT 1D Chart)
This volatility period is around September 7th (September 6th-10th).
After this period of volatility, the key question is whether the price can find support and rise above the 4403.87-4749.30 level.
-
To continue the cascading upward trend, the price must rise above 4749.30.
Therefore, we need to monitor whether the price maintains above the 4749.30-4868.0 level.
-
If resistance is encountered at 4403.87 and the price declines, it is likely to decline until it meets the HA-Low indicator.
Therefore, we need to check for support around 4302.41-4403.87.
However, there is a possibility of a rise after touching the previous all-time high (ATH) range of 3900.73-4107.80, so we need to consider a response plan.
If the price falls below 4107.80, it is expected to touch the M-Signal indicator on the 1W chart and resume the trend.
-------------------------------
The On-By-Signal (OBV) indicator is falling below the Low Line.
The TC (Trend Check) indicator is below 0.
The K value of the StochRSI indicator is showing signs of rising from the oversold zone.
If the High Line of the OBV indicator falls and forms a downward channel, it is highly likely that selling pressure will continue to dominate, so caution is advised when trading.
Therefore, the key issue this time is whether support is found around 4302.41-4403.87.
The TC (Trend Check) indicator is a comprehensive evaluation of the StochRSI, On-By-Signal (OBV), and PVT-MACD Oscillator indicators.
Therefore, if the TC indicator is below 0, selling pressure is dominant, and the price is likely to decline.
If the K value of the StochRSI indicator continues to rise, the price is likely to rise after this period of volatility.
However, for the uptrend to continue, the OBV and TC indicators must show upward trends.
-
Thank you for reading to the end.
We wish you successful trading.
--------------------------------------------------
- Here's an explanation of the big picture.
(3-year bull market, 1-year bear market pattern)
I'll explain more in detail when the bear market begins.
------------------------------------------------------
ETHEREUM ETHUSDT ,WE are watching the price action for next possible trade direction. The right direction is to allow the weekly time frame form a double top and aim the break of the neckline and sell down.
break above will be open for long position.
trading is probability
RISK MANAGEMENT IS KEY.
#ETHUSDT #ETHEREUM.

ETHEREUM ETHUSDT ,we are waiting for potential weekly candle from the demand floor ,a break will call for retest and we sell .then breakout of the supply roof will call for buy.
#ethusdt

Update of yesterday’s analysisAs we mentioned yesterday, Bitcoin has entered a range, and it’s likely that this range will continue until the news we posted in “mind” a few minutes ago. At the moment, the volume is very low, and the probability of fake moves is high. ✅


Looks like we should wait for a price correction.Support and resistance points are clear
Explanation stated on YouTube

ETH/USDTI’m watching for a potential correction into the 4300–4400 zone.
📈 Bullish Scenario (Preferred):
If price corrects into 4300–4400, I’ll look for confirmation signals to enter long.
Upside targets: 5000–5200.
✅ Plan: No longs without confirmation.

ETH is about to go WILD!If we agree that this is the real overall current context pull on CRYPTOCAP:ETH than we get this result:
Biggest support: 3.5k
Magnet levels: 6k - 8k
The highlighted backtest of double red tells me that we found acceptance back in this context pull making this pull legit! Thoughts?

ETHUSDT → Correction and hunt for liquidity ahead of growth BINANCE:ETHUSD is showing positive dynamics and breaking through the resistance conglomerate (consolidation boundary and downward correction line). The fundamental background is positive, and bulls are generally quite confident...
The cryptocurrency market, Bitcoin, and altcoins are awaiting a batch of positive news. Traders are waiting for interest rates to fall, which could attract additional capital to the cryptocurrency market, especially ETH.
The breakout of the correction resistance and consolidation resistance gives the market hope for growth. The global trend is bullish, and the fundamental background is positive. If the bulls hold their defense above 4488-4450, ETH may strengthen.
Resistance levels: 4661, 4783
Support levels: 4488, 4450
Technically, I expect a false breakdown of support (retest of the liquidity zone). If this maneuver ends with the price closing above 4488 and the formation of a confirming bullish pattern, then in this case, we can consider the continuation of growth.
Sincerely, R. Linda!

Ethereum analysisThere’s no doubt that Ethereum is in an uptrend, and right now the price is moving along a trendline on the higher timeframe. In these conditions — since Ethereum usually has good bullish momentum — my preference is for long positions. If the price continues this uptrend, we can see a triangle pattern forming, which by nature is bullish, and if activated, the price could move higher.
The higher timeframe trendline that the price is currently moving on may get broken with a fakeout, after which the price could return back above the trendline.
This analysis will be invalidated only if the higher timeframe trendline gets broken and the breakout is confirmed. ✅

ETH/USDT 1D chart review🔎 Technical analysis
1. Trend
• You can see a clear growth trend line (orange). The price consistently reflected from her, which means that the buyers defend this level.
• Currently, the price is above trendline, which is a bull signal.
2. Support and resistance
• Support:
• $ 4,429
• USDT $ 4,556
• resistance:
• $ 4.687 USDT (current price fight - this is where the market is testing)
• USD 4,793 (strong resistance)
• USD 4,954 (key psychological resistance - nearly 5K)
3. Candles
• We have a long green up move - the momentum is strong.
• The last candles show a little indecisive at 4.687 (upper shadows), i.e. possible consolidation or back.
4. STOCHASTIC RSI (oscillator at the bottom of the chart)
• enters the purchase zone (> 80).
• This often heralds correction, but in strong trends the indicator can last long.
⸻
📊 Scenarios
• bull (continuation of growth):
If ETH stays above 4.687 and pierces 4.793, the next goal is 4.954 (and then psychological 5,000).
• Bear (correction):
Rejection 4.687 and descent below 4.556 can open the way to the Trendline test around 4.430.
Puncting the trend down is a reversal signal and a possible drop towards 4.200.
⸻
📌 Summary
• Main trend: upward.
• Momentum: Strong, but the indicators show buying.
• Strategy:
• Careful entrances with support (4.556 / 4.430).
• confirmed breaking 4.793 = strong signal for further increases.
• Stop loss below Trendline (~ 4,400), because it will negate the current script of the bull

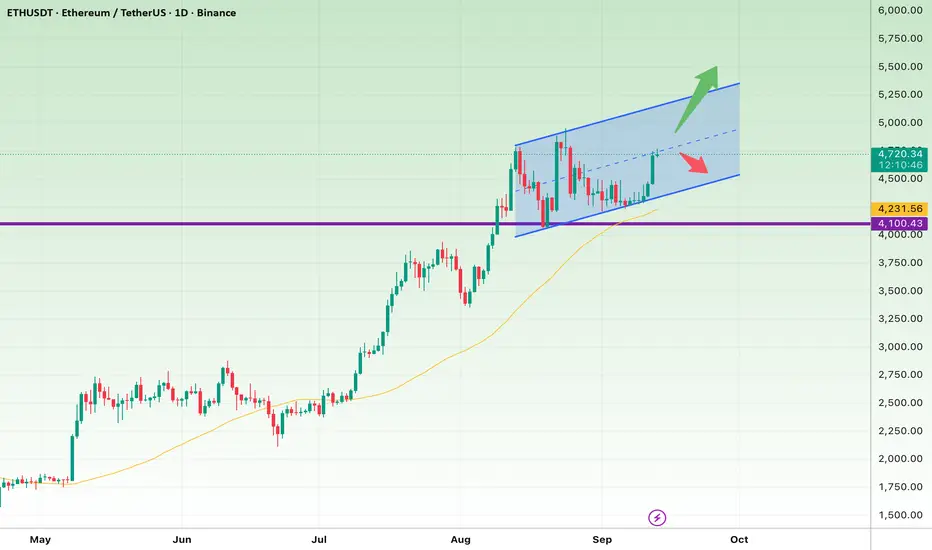
Ethereum (ETH) – Ready for the Next Breakout?Ethereum is trading inside a strong ascending channel and currently sitting around the mid-zone. The trend remains bullish, supported by the 50-day MA just below.
Key Levels to Watch:
Support Zone: $4,100 – $4,230 → Losing this level could trigger a deeper pullback.
Resistance Levels:
First hurdle: $4,800 – $4,900
Next target: $5,200 – $5,300 (channel top)
Bullish Scenario: A solid close above $4,700 could push ETH toward $5K and even $5,300.
Bearish Scenario: Breaking below $4,100 may confirm a correction back to lower levels.
Takeaway:
Ethereum is still in a healthy uptrend, and all eyes are on the $4,700 breakout level. If the bulls hold momentum, the next leg higher could be just around the corner!
Long trade
Pair ETHUSDT
Sat 13th Sept 25
4.30 am
LND session AM
Entry 4723.05
Profit level 4757.96 0.74%)
Stop level 4718.18 (0.10%)
RR 7.17
Observations 5min TF
Buyside bias:
Volume increase upheld
Making higher lows -5min TF
FVGs forming below lows
RSI above 50%
Trendline support 5min TF
Trade idea based on the narrative of SMCs and the Volume Spread Indicator, and reading the Tape to form a buy-side bias.

Ethereum Road Ahead of September 17thGood morning. As I wrote in my previous post, this is my first time here. If you like it, please subscribe and support the post.
Weekends are a good time for market makers, when the market is very weak. Before pushing the price up, they need to collect liquidity by hitting long stop-losses, so that no one stands in the way of growth after a possible rate cut.
All the major short positions above have already been closed. Now it’s time to move down. The extreme downside target is $4,200. Market makers don’t necessarily have to push it all the way there—they may stop earlier. It all depends on whether long traders panic and start closing their positions, or keep holding on until the “bitter end.”
The market should always be analyzed in real time, not by “fortune-telling on daisies.” Please don’t forget to subscribe and support my post. That will determine whether it makes sense for me to keep writing further.
Wishing you a great weekend and all the best!
