ETH/USDT Breaks RangeETH/USDT has broken its range in an upside move. A Bullish Trend can also be seen on 1H Timeframe.
If the trend continues, it could give us a 1:2 Risk:Reward setup. If price hits our TP1 after triggering the Buy-Stop order, just break even the SL and wait for the price to go towards TP2.
USDTETH.P trade ideas

Ethereum at a Critical Resistance Zone – Will $4,800 Hold or Bre📝 Analysis:
Ethereum (ETH/USDT, 4H) is testing a critical resistance zone at $4,700–$4,800, where several technical factors converge:
1. Descending Channel:
Price is touching the upper boundary of the long-term descending channel.
2. Fibonacci Extension:
The recent rally has reached the 1.618 Fibonacci extension (~$4,720), which often acts as a potential reversal zone.
3. Resistance Cluster:
The $4,700–$4,800 area combines both static resistance and the channel top, making it a high-risk region for buyers.
4. Wave Structure:
The strong rally from ~$4,050 could be part of a corrective wave (possibly Wave D). If ETH fails here, we may see a sharp pullback.
⸻
📊 Scenarios:
🔸 Bearish Case (more likely):
Rejection from $4,720–$4,800 could trigger a correction toward:
• First support: $4,580–$4,600
• Key support: $4,100–$4,200
🔸 Bullish Case (conditional):
A daily close above $4,800 would confirm a breakout from the channel, opening the door for targets at:
• $4,950–$5,000
⸻
📌 Conclusion:
ETH is at a make-or-break level. Failure to hold above $4,800 could bring a strong correction, but a confirmed breakout may fuel a run toward $5,000.

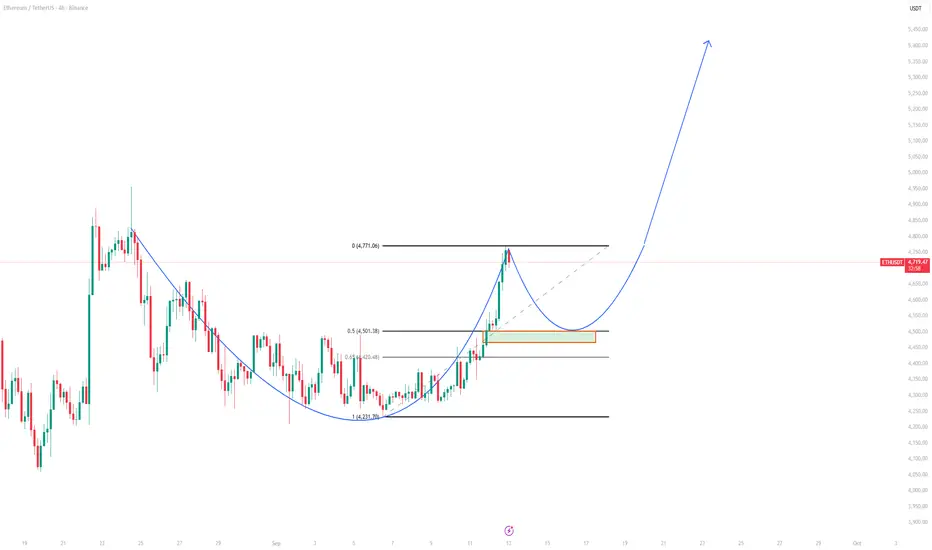
Ethereum to move to make this cup and handle completePossible next Ethereum move, Ethereum may retrace to 4500 level to complete the Cup and handle formation and then giga send to 5500 and beyond.


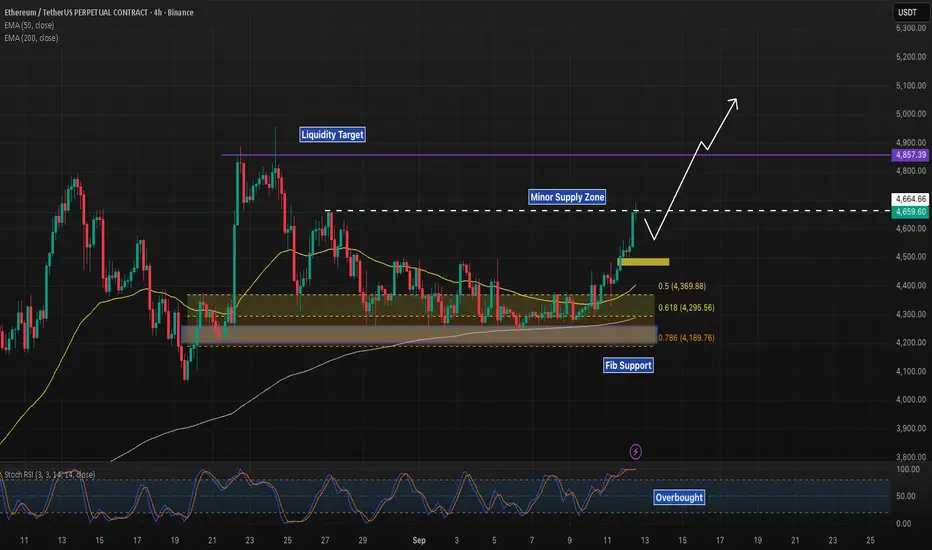
ETH 4H – Breakout Retest, Eyes on $4,857 LiquidityEthereum broke out above $4,500 and is now retesting the breakout zone while holding above both EMAs ($4,288–4,402). The move has built on strength from the Fib cluster, where ETH defended the 0.5 retrace at $4,369 and the golden pocket at $4,295.
Upside:
As long as ETH holds $4,500, the next liquidity target sits at $4,857.
Downside:
Losing $4,500 re-opens the Fib cluster ($4,369–4,189), with $4,189 as the last major support.
Stoch RSI is overbought, hinting at short-term cooling, but structure favors continuation while ETH trades above $4,500.
📊 Key focus: Can ETH turn $4,500 into support for continuation toward $4,857, or does it retest deeper into the Fib base first?
ETHUSD Long Trade BITSTAMP:ETHUSD Long Trade
Entry: 4270 - 4335
TP-1: 4390
TP-2: 4580
This is good trade.
Don't overload your risk like Greedy gambler!!!
Be Disciplined Trader, risk what you can afford.
Use proper risk management.
Disclaimer: Trading is risky, only idea, not advice.

Weekly Insights EUR/USD - BTC - AUD/NZD - NVDA - MSFTThe weekly video, I share my thoughts for the next week. Next week we have a highly important event which is the Federal Reserve interest rate decision. It will strongly affect the EUR/USD, S&P500, and BTC.
The common theme is that most of the assets are in the 5th Elliott wave.
Good luck to all of us.
Markets Titan

Ethereum Might be Ready for the Next Leg UpAfter nearly two weeks, ETH has finally broken above the 4,250–4,500 range. Upward pressure from the broader bull market can be expected to continue, at least through the end of this year. As Bitcoin approaches its cycle target range of 135k–150k, Ethereum may take the torch and accelerate the transition into altcoin season.
In the short to medium term, 4,660 and 4,840 are possible targets for ETH.
ETHUSDT Breaks Downtrend, Bullish Structure HoldsEthereum has broken above the recent red downtrend line, reclaiming momentum after a brief consolidation. The broader structure remains bullish as long as price respects key daily and weekly supports. This setup offers swing opportunities with clear risk levels.
🔍 Technical Analysis
Current price: $4,433
Break above the descending red trendline confirms bullish momentum.
Supports below align with major daily and weekly demand zones.
🛡️ Support Zones & Stop-Loss (White Lines):
🟢 $3,730 – Daily Support
Key short-term defense.
Stop-loss: Below $3,536
🟡 $2,680 – Weekly Support
Stronger swing entry zone.
Stop-loss: Below $2,481
🟠 $1,848 – Daily Support (Long-Term Buy Zone)
Macro level for deeper entries.
Stop-loss: Below $1,745
🧭 Outlook
Bullish Case: Break of red downtrend + hold above $3,730 → continuation higher toward $4,600–$4,800.
Bearish Case: Break below $3,730 → correction into $2,680. Losing $2,680 exposes $1,848.
Bias: Bullish while above $3,730.
🌍 Fundamental Insight
Ethereum continues to benefit from network upgrades, growing ETH staking, and institutional adoption. Macro drivers like potential U.S. rate cuts and weaker USD also support crypto upside. Risks include regulatory pressure and shifts in liquidity.
✅ Conclusion
ETHUSDT has broken its recent downtrend and is holding bullish structure above $4,400. Support zones at $3,730, $2,680, and $1,848 provide clear swing levels for traders.
⚠️ Disclaimer
This analysis is for educational purposes only and does not constitute financial, investment, or trading advice.

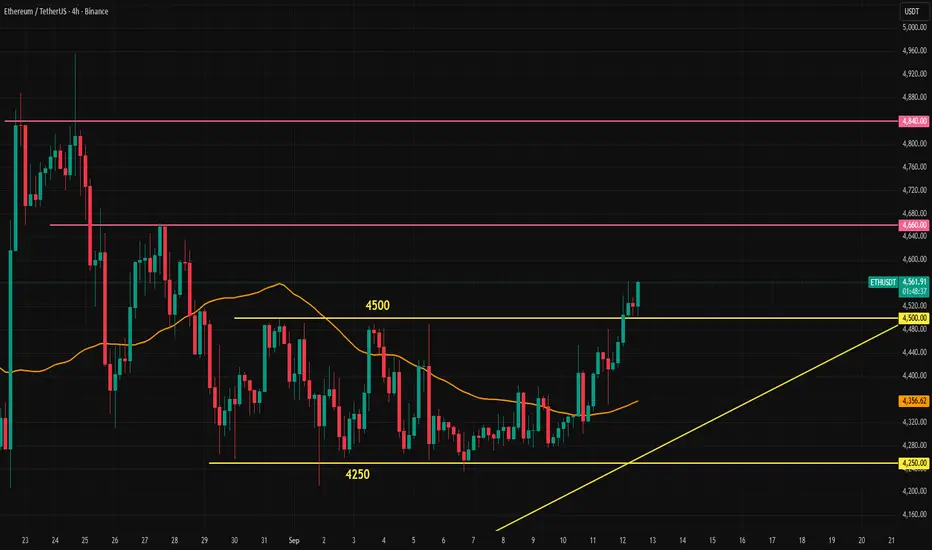
Ethereum Update📊 Ethereum Update
ETH is ranging between $4,200 – $4,500.
We’re waiting for a breakout on either side to confirm the next trend. ⚡️

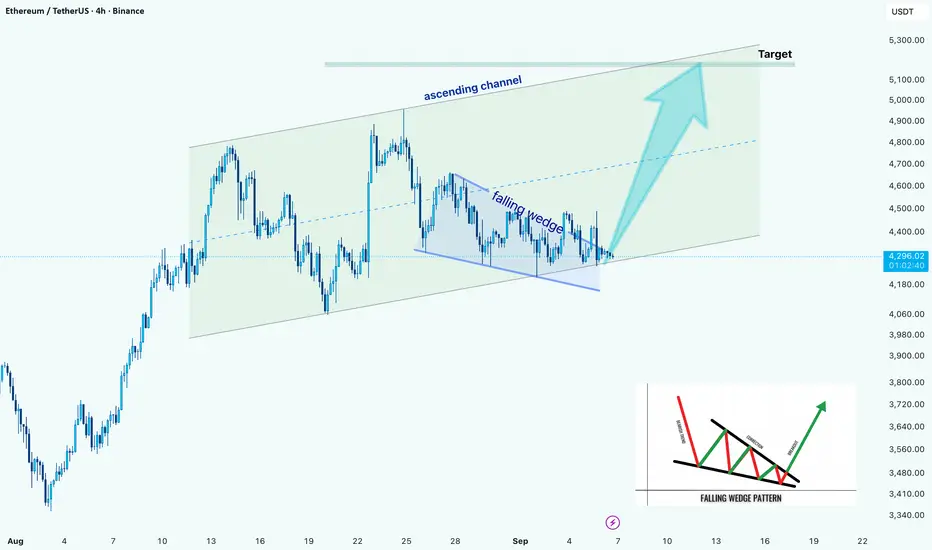
ETH/USD –> Falling Wedge Breakout Within Ascending ChannelHello guys!
Ethereum is showing a strong technical setup on the 4H chart. Price has been respecting an ascending channel since early August, and within this structure, a falling wedge has recently formed.
Right now, ETH is testing the wedge breakout point near the bottom line of the channel. If buyers manage to hold momentum here, we could see price extending toward the channel’s upper boundary, with the next major target sitting around $5,100 – $5,300.
On the downside, failure to sustain above the wedge support may lead to a retest of the lower channel trendline around $4,100 – $4,150, which remains a critical support area for bulls to defend.
ETH/USDT: Bullish Rise to 4580? BINANCE:ETHUSDT is gearing up for a bullish move on the 4-hour chart , with an entry zone between 4200-4250 near a key support and trendline. 🎯
The target at 4580 aligns with the next resistance, signaling strong upside potential. 📈 Set a stop loss on a close below 4000 to manage risk effectively.
Be patient until the price reaches the Entry Zone . If it doesn't, don't worry. The market is always alive and always gives us good trading opportunities.💡
Ready for this lift-off? Drop your take below! 👇
📝 Trade Plan:
✅ Entry Zone: 4200 – 4250 (support + trendline confluence)
❌ Stop Loss: Close below 4000 to manage risk
🎯 Target: 4580 (next resistance level)

Eth bullish trade planEthUSDT is bullish in the hourly timeframe, already overbought, expecting it for retracement.
I am sharing my trade plan.
Please comment, do you think it will work?

Ethereum Trade Setup - Sep 12th📲 NFX Trade Alert – Swing Setup
💹 Instrument: BINANCE:ETHUSD Ethereum (ETHUSD.r)
🛒 Trade Type: Swing – Buy at Market
📍 Entry: $4,540
⛔ Stop Loss: $4,450
✅ Target Profit: $4,950
📊 Trade Setup Analysis – Ethereum
Ethereum has finally broken through the $4,500 block order, which is now acting as solid support after multiple rejections on both the H1 and H4 timeframes.
With this breakout confirmed, price has no significant resistance until $4,650 (minor) and $4,850 (major). This opens the path for higher prices in the near term.
⚖️ As always, manage risk carefully — even a high-probability setup requires discipline and protection.💚

ETH/USDT | Ethereum Eyes $5,100, $5,500 & $6,000 – New ATH AheadBy analyzing the Ethereum chart on the weekly timeframe, we can see that the price is still trading around $4,400. If it holds above the $3,900 level, I expect a strong bullish wave toward new targets and fresh all-time highs.
Given the current momentum, this bullish move could start soon, with possible targets at $5,100, $5,500, and $6,000.
Please support me with your likes and comments to motivate me to share more analysis with you and share your opinion about the possible trend of this chart with me !
Best Regards , Arman Shaban

EthusdEthereum about to break monthly resistance if it can last 4600 I think it will keep going higher Macd looks good . Next week interest rates are cut crypto will reach new highs very soon

ETH/USDT: Heading for $4700Analyzing the hourly ETH chart. I'm seeing a clean breakout from the long consolidation phase, with $4480 now flipped to key support. The buying momentum is very strong, and the price structure shows the bulls are in full control.
My primary scenario for the next few days is a slight pullback to retest the $4480 level. I see this as an optimal entry point for a long position. The first target to take some profits will be the $4600 area.
The main driver for a move higher will be the market's reaction to the Fed's rhetoric. Positive sentiment will easily provide the fuel for a push toward the main target at $4700. I'm trading this plan, while always keeping my risk in check.

Ethereum (ETH): Buyers Secured The EMAs | Mega BullishCRYPTOCAP:ETH showing strong signs as momentum starts kicking in right above the EMAs. Buyers have defended these zones multiple times, and now we’re finally seeing that push we’ve been waiting for.
As long as price holds above this area, the target at $5,555 stays active. This bounce near EMAs could be the key driver for continuation in the coming sessions.
Swallow Academy

#ETHUSDT 4H ChartPrice is still moving upwards after liquidating the equal highs. MACD is starting to show some bullish weakness, RSI is bought and EMAs are turning bullish. Price is expected to keep pushing upwards aiming towards the 4h supply zone at around $4,800.


$ETH Breakout Signals 10% Upside PotentialCRYPTOCAP:ETH has broken out of its downtrend and reclaimed support around 4.5K.
If it holds, momentum could push toward 5K, nearly a 10% move.
DYOR, NFA
