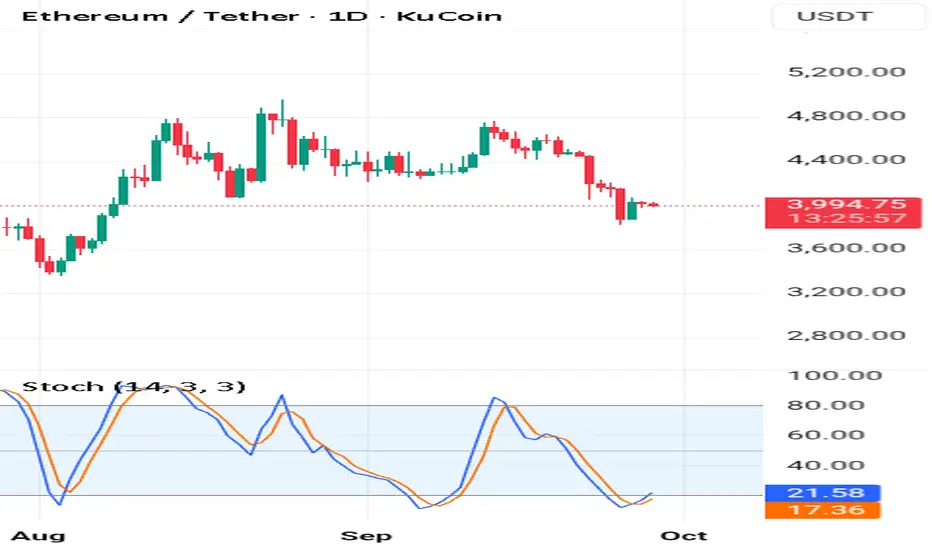
ETH Price Action Looks Heavy – Danger Ahead?This chart is showing a clear pattern of accumulation followed by decline. Every time price moves sideways in a box range, instead of breaking upward with strength, it rolls over into another drop.
What this tells us is that the market is using these sideways phases as resting points for sellers to reload, not buyers to take control. Until CRYPTOCAP:ETH can break out of this cycle and hold above one of these consolidation zones, the overall trend remains heavy to the downside.
DYOR, NFA
#PEACEFUL
Follow for more updates and market insights on TradingView
USDTETH.P trade ideas

Ethereum: Bullish ContinuationEthereum: Bullish Continuation
Ethereum recently broke out of a bullish triangle pattern, which usually signals a bullish move. After this breakout, the price is now pushing higher with strong momentum.
The first target is around 4450, where ETH could face resistance.
If it breaks that level, the next target is around 4600, which is a stronger resistance zone.
Overall, the chart suggests that ETH is in a bullish continuation pattern, and as long as it stays above the breakout zone, it could keep moving upward step by step toward those targets.
You may find more details in the chart!
Thank you and Good Luck!
❤️PS: Please support with a like or comment if you find this analysis useful for your trading day❤️

Ethereum Analysis – Climbing Step by Step🚀 Ethereum (ETH/USDT) Analysis
📌 The purple line shows my own projection.
📌 The small rectangles represent a steady, step-by-step growth in price.
📌 This structure on the chart indicates that the market is gathering strength at certain levels before moving higher.
✨ In short, the market seems to be recharging with corrections and getting ready for new highs.
👉 Target zones are marked above. Let’s see if my projection plays out!
💡 Do you think this scenario will happen? Or will the price take another path?

ETH Elliott Wave - WXY Correction Complete soon!This chart analyzes Ethereum (ETHUSD) at the conclusion phase of a major WXY corrective structure, highlighting the technical environment for a new impulsive wave sequence. Price action is assessed using multiple technical indicators:
Elliott Wave Structure: The chart maps a completed 1-2-3-4-5 impulse, followed by W–X–Y corrective waves. The final Y leg approaches the critical Point 4 support, maintaining overall cycle validity and setting the stage for significant trend reversal once completed.
Ichimoku Cloud: ETH price is currently testing the lower bounds of the Ichimoku cloud, reinforcing a major support zone. A close above the cloud would further validate trend reversal; a breakdown would signal extended bearish pressure.
Volume Profile: Recent sessions show a spike in trading volume as price approaches historical support levels, indicating potential capitulation and increased probability of trend exhaustion.
Fibonacci Retracement: Key supports are identified at the 38.2%, 50%, and 61.8% levels, with the 38.2% zone (around $3,600) as a strong candidate for final Y wave completion based on confluence with cloud and momentum indicators.
RSI and Stochastic RSI: Both relative strength oscillators are in oversold territory, consistent with the final stages of a corrective structure. A bullish crossover or RSI divergence would strengthen the reversal thesis.
CVO/OBV: Volume-based momentum indicators confirm heavy participation during the latter stages of the sell-off, validating the probability of a strong bounce once buyers re-enter.
Scenario Outlook:
The analysis anticipates that, upon completion of the WXY correction—ideally above the Point 4 support (roughly $3,350)—Ethereum is set for a new impulsive uptrend as part of the final bull market rally. The setup favors strategic accumulation in the defined support zones, with projected upside targets ranging from previous all-time highs (~$4,950) to extended Fibonacci projections should the market move through a classical 1-2-3-4-5 impulsive wave.

ETH - Short Trade - Further Drop Ahead My Entry - 4012
My Stop Loss - 4,240
Target 1 - 3,355
Target 2 - 2,655
Target 3 - 1,646
Target 4 - 1,225
Shorting per trendline breakdown and successful retest shown.

ETH Buy Idea - EQ Highs + Buyside Liquidity as DOL - LONG
I’m looking for a potential long opportunity on Ethereum as current price action suggests bullish momentum building up.
Market structure is showing signs of strength, and liquidity has been swept at recent lows, creating room for buyers to step in.
If price continues to respect key support levels and fills nearby imbalances, we could see a strong push higher. I’ll be monitoring these zones closely for confirmation before entering.
The scenario is the following :
Anticipating price to sweep Previous Day Low (PDL), fill the H4 BISI nearby imbalance and form a reversal from there.
All this would be happening in alignment with Fibonacci levels - which solidifies the idea.
We have good draw on liquidity on the buyside, personally aiming for EQ highs.
I've set my alerts and will keep you guys updated !
The Profit Room Fx

Ethereum's Scenarios for the Week Ahead??The key points are indicated in the chart. And if the stop point is broken downwards, the next stop will be $3370 and there is a high probability of a deeper drop. However, if the price of Ethereum breaks above $4251, this scenario will be invalidated, which is unlikely but not impossible.

ETHUSDT.PThe setup has been marked. Personally waiting for the retesting with strong volume before getting in the trade.
Keep supporting guys keep following please.

ETH | 6 Hrs | Long | Target +10%This technical analysis is for informational and educational purposes only. It does not constitute financial advice. Remember to always research and consult with a professional before making investment decisions. Good luck! 📈💼🚀

Eth/usdt Technical Outlook📊 ETH/USDT Technical Outlook
Current Price: $4,157
Resistance Zones:
• $4,400 – first major test, aligned with short-term supply and 20/50-day MAs
• $4,550 – $4,600 – stronger resistance, breakout level for bullish continuation
Support Zones:
• $4,000 – psychological level & local structure support
• $3,900 – critical floor; a break here could accelerate downside to $3,600
Trend & Moving Averages: ETH is trading below its 20- and 50-day moving averages, showing short-term selling pressure. Trend remains bullish on higher timeframes but under consolidation.
Momentum (RSI): Neutral-to-slightly bearish, not oversold, meaning ETH has room to either break down further or rebound.
Scenarios:
🔻 Bearish: If ETH loses $4,000–$3,900 support, expect selling pressure toward $3,600.
🔺 Bullish: A strong daily close above $4,400 would shift momentum, with the next target at $4,550–$4,600. Sustained breakout could open path toward $4,800.

A new rally is starting in Ethereum FamETH has perfectly retested the support zone and it' s now ready for the last part of the cycle

ETHUSDTHello Traders! 👋
What are your thoughts on Ethereum?
Ethereum has recently broken above the key resistance area near 4100, printing a new high slightly above the previous peak. After this breakout, price action has entered a corrective phase, suggesting a healthy pullback.
This correction is currently forming a bullish flag pattern, which may act as a continuation setup.
As long as ETH remains above the highlighted support zone, the bullish scenario remains valid. A confirmed breakout from the flag formation could trigger the next impulsive wave, potentially leading to fresh all-time highs.
Keep a close eye on the flag breakout and watch for bullish momentum to resume once the consolidation completes.
Don’t forget to like and share your thoughts in the comments! ❤️

ETH Check-In📊 Current Setup
ETH just slipped outta the box and is cruisin’ down toward that $3750 zone 🩸. That spot’s stacked with weight — if it holds, we might see the tide flip from bull vibes to bear mode 🐻.
🚦 Scenarios
👉 If $3750 catches and sticks, could be a minor pivot point worth watchin’.
👉 If it cracks clean, ETH might surf lower before bulls even think about comin’ back.
🧭 My Take
Right now? No clean setup. Best play is to sit tight, let the dust settle, and wait for the next wave 🌊. Patience prints 💯.
❓ What’s Your Read?
Does $3750 hold the line, or are we about to see ETH dive deeper? Drop your vibe below 👇

ETH Analysis: Deeper Pullback in PlayETH is still trading within a broader uptrend channel, but recently, the price has started to pull back after a significant rally. After pushing up too far, the market is now taking a breather and recalibrating.
From a technical standpoint, this pullback is completely normal and healthy after such a strong move. Pullbacks like this are part of any bullish trend, providing the market a chance to reset. If the pullback continues, the next target could be the 3,600 support area, where multiple key factors converge: horizontal support, trendline support, and the 0.618 Fibonacci retracement level.
The 3,600 level is crucial. If ETH holds strong here and shows signs of a reversal, it could be a solid entry point for the next leg up. However, if the price breaks below this level, we may see deeper downside, and the current bullish structure could start to break down.
As always, confirm your setups before entering and make sure your risk management is solid. Stay alert for the next opportunities!

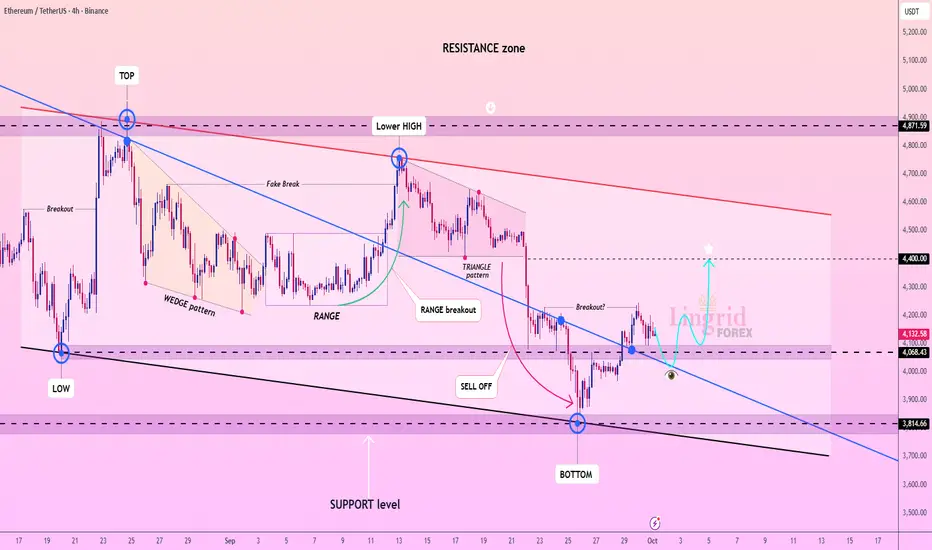
Lingrid | ETHUSDT Structure Break - Potential Bullish SetupBINANCE:ETHUSDT recently found support near 3,815 after a sharp selloff and is now stabilizing above the bottom structure. Price action shows a sequence of lower highs within a descending channel, but the latest rebound hints at a possible reversal. A move toward 4,400 is viable if buyers sustain momentum above 4,000–4,100. The broader context still reflects medium-term weakness unless resistance near 4,300 breaks.
⚠️ Risks:
Failure to hold 4,000 could trigger another retest of 3,815 support.
Macro uncertainty and BTC volatility may weigh on ETH’s recovery.
A rejection near 4,400 could resume the broader downtrend.
If this idea resonates with you or you have your own opinion, traders, hit the comments. I’m excited to read your thoughts!
ETH Long-Term Outlook📊 Current Setup
ETH just cracked down from consolidation and is now sliding toward that $3750–$4000 pocket 📉. This zone’s a straight-up make-or-break spot for the long-term trend — no cap.
🚦 Scenarios
👉 If price taps the zone and rejects strong (big wicks, strong closes, volume surging) 🔥 — ETH could gear up for a bounce that not only reclaims upper ranges but maybe even pushes toward fresh ATHs 🚀.
👉 If the zone cracks and we consolidate under it, that’s a midterm bearish flip 🐻, and the market could stay heavy for a while.
🧭 My Take
No clean setup to ride yet. Patience is key — the next few candles and ETH’s reaction to the $3750–$4000 zone will lay it all out.
This is one of those levels where legends get made, fam. Either we catch the next monster wave 🌊, or we sit tight and protect the bag until the tide shifts. Stay locked in 💯.
💬 What do you think about this scenario? Only share your idea if you’ve got another opinion — otherwise just hit that button 👍

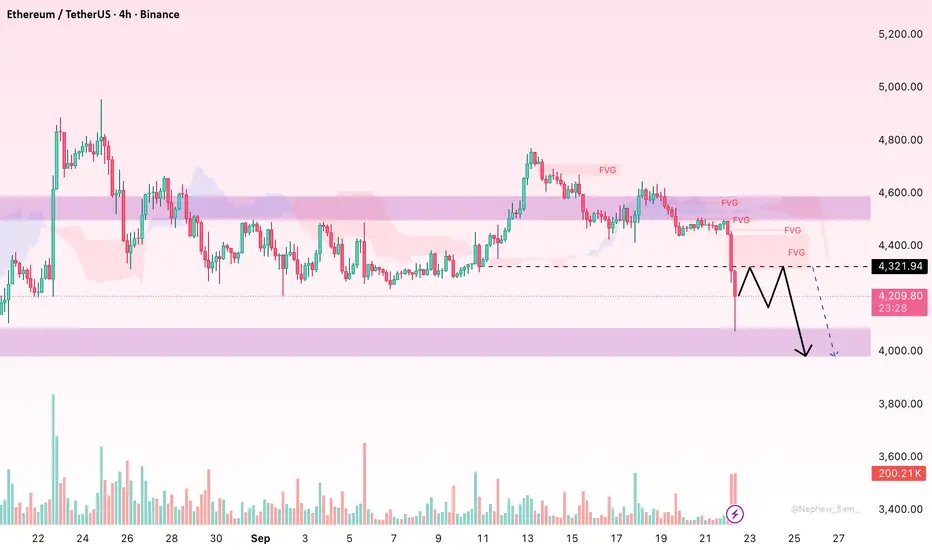
ETH: Sharp Flush, Filling the FVG or Preparing for a Deeper DropHello everyone,
On the H4 chart the recent red candle in ETH was a textbook flush: price plunged straight below the Ichimoku Cloud, selling volume spiked, and a large cluster of FVGs has formed overhead around 4.32k–4.40k. This setup typically favours a technical rebound to fill those gaps before the market chooses its next direction.
Why did ETH fall so sharply?
First, mass liquidation of leveraged positions: this morning alone, hundreds of millions in long positions were wiped out, with ETH accounting for a significant share, intensifying the move lower.
Second, deteriorating ETF flows: after a period of strong inflows, spot ETH ETFs saw heavy redemptions in early September (from ~$505M to ~$952M within days), adding supply as investors took profit or rotated into BTC.
Third, risk-off sentiment ahead of the Fed and lingering regulatory uncertainty around ETH ETFs—particularly the delayed review of staking features—has curbed appetite. Finally, the wider crypto market saw broad-based selling, wiping out tens of billions in market cap and dragging ETH down with it.
From a technical view, I expect ETH to rebound toward 4.32k–4.36k (lower FVG edge, possibly extending to 4.38k–4.40k near the Cloud) to retest supply. If selling pressure re-emerges there, price is likely to reverse toward 4.08k–4.02k, retesting the recent absorption zone. Holding 4.02k could allow another attempt back at 4.32k; breaking and closing H4 below 4.02k, however, opens risk toward ~3.98k.
Only if ETH closes above 4.40k–4.43k on H4 (escaping the FVG and regaining the Cloud) would I consider a scenario of building a higher base.
What about you—do you lean towards “rebound to sell” or “base building for a reversal”?
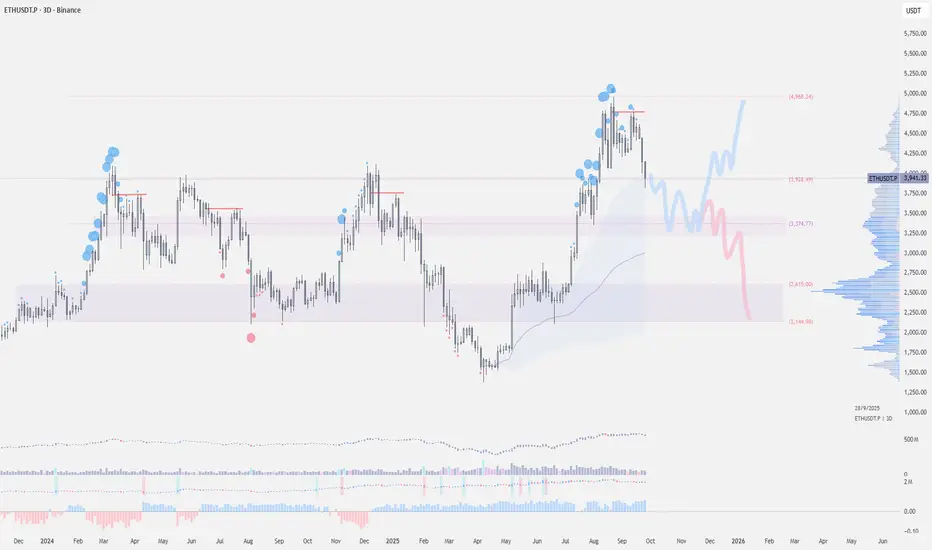
$ETH - Bounce Back or Break Down?BINANCE:ETHUSDT | 3d
Ethereum has experienced a roughly 13% decline over the past week, primarily due to deleveraging triggered by shifting expectations around rate cuts. The chart indicates that each time the price tests a previous high for the second time, it tends to decline in a bearish retest.
The $3800 level is a critical support zone. If this support holds, it could pave the way for a rally, potentially retesting the $4800–$5000 range.
However, a break below $3,800 could lead to further declines, targeting the $3500–$3200 zone. In a more bearish scenario, a drop to $2600–$2400 is possible.
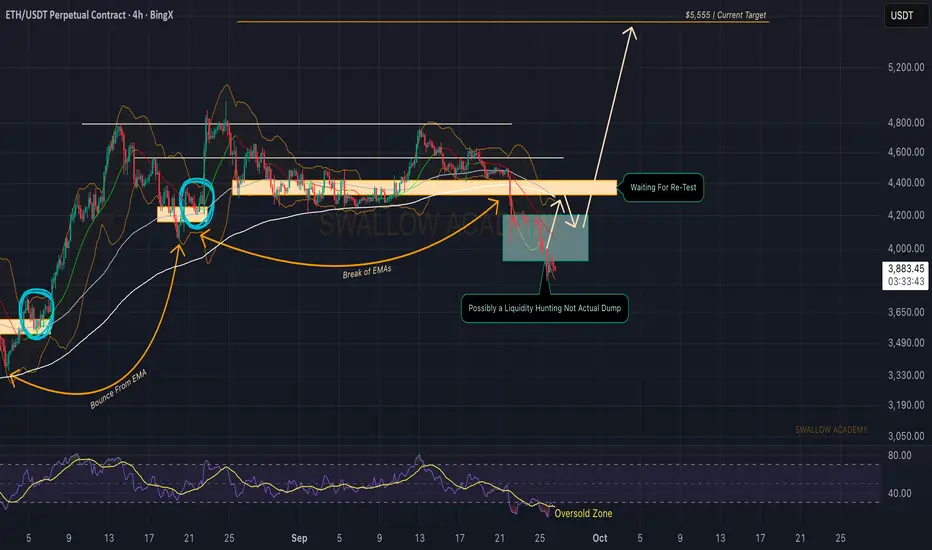
Ethereum (ETH): Buyers Are Being Wiped Out | Bullish AF!The pressure from sellers continues, which is not giving us any clear signs of recovery yet to take place. Despite that, we are still in a bull market, so we have not switched the narrative to being in a bear market (not yet).
ETH is having a similar pattern to BTC when it was forming new ATHs: a strong liquidity grab and dips near previous ATHs before just breaking out and forming new ATHs.
Expecting ETH to follow the pattern so we keep on looking for that new ATH!
Swallow Academy
The #1 Reason This Is A Strong Support Am currently thinking of the worse case scenario..
What if I fail in business?
What if I face a family crisis? For example the death of a family bread winner
What if Bitcoin or Ethereum or Pepe coin get delisted on the exchange?
Imagine this happens to you when you have borrowed 💰 money
On the price of Bitcoin going up.
Hoping to use that money to support your business or financial independence?
Life is full of challenges and you have to burn the ⛵ boat.
Now don't get reckless and place all your eggs in one basket.Thats foolishness right?
Well that's what I did I placed all my eggs in one basket.Atleast in the beginning.
Why ?
Because diversification is fake..
It doesn't exist.
What matters are systems and strategies.
With out the right mentors you will fall hard this is what happens to the best of us.
The key is to stay cool and fall back on a system.A system you can hang on to.
Ethereum has its faults but if you can trade it with confidence you will be okay.
Especially if you have a hardware wallet to store it in.
Look at the stochastic the blue line has crossed above the orange line.
Right below level 20 the oversold territory.
This has came after the bullish harami and so far the price is yet to break this support.
The bullish harami support is strong that the reason it's a good buy.
Rocket 🚀 Boost This Content To Learn More
⚠️Warning!!! Don't trade zero day options that expire in one day with high fees for forex trades.
Disclaimer ⚠️ Trading is risky please learn about risk management and profit taking strategies. Also feel free to use a simulation trading account.
Ethereum Update📊 Current Setup
ETH is retesting a key resistance zone after that bounce, sitting around $4,050–4,100. This pocket’s acting like a supply zone — unless bulls come in stacked with momentum, we’re likely lookin’ at rejection.
🚦 Scenarios
👉 If rejection confirms, ETH could ride down toward the $3,750–3,800 support. That zone’s critical — not just short-term demand, but a big piece of ETH’s long-term trend structure.
👉 If bulls defend hard and flip the zone, we could be lookin’ at the base for a bigger recovery move.
👉 But if that support cracks, the midterm bearish tide deepens 🐻.
🧭 My Take
Right now it’s patience mode. Resistance looks heavy, and a short-term dip from here could be in play — but only with minimum exposure. Protect the bag first, ride the wave second 🌊.
💬 What do you think about this scenario? Only share your idea if you’ve got another opinion — otherwise just hit that button 👍

Will we see Ethereum rise at the end of this week?I think Ethereum, with a bad start this week, needs a strong price correction to climb back up to $5,000 and exit this multi-day range. If the $4,000 channel is lost, the price will drop to $3,370 and will start its climb from the bottom of the channel next week. Of course, this week, you can open small buy or sell trades, depending on the market risk, according to capital management.

ETH: Short-Term Trading StrategyETH: Short-Term Trading Strategy
Once again, Ethereum found a strong support zone near 4400.
The price reacted once again for the third time and if ETH respects the previous movements it should rise again to 4600
This is a 60 min setup so it can perform during the weekend.
Targets that I am looking at are near 4445 and 4615
You may find more details in the chart!
Thank you and Good Luck!
❤️PS: Please support with a like or comment if you find this analysis useful for your trading day❤️
