01-09-2025 ETHUSDTThe market is not always chaotic and disorderly, and there is a precise geometric beauty hidden in price fluctuations. The harmonic form long strategy is a powerful tool for accurately identifying potential market reversal points based on the Fibonacci ratio. When the form forms perfectly at the key support level, it often indicates the depletion of bearish momentum and the initiation of bullish trends.
As shown in the figure: 15M Bullish Bat
USDTETH.P trade ideas

31-08-2025 ETHUSDTThe market is not always chaotic and disorderly, and there is a precise geometric beauty hidden in price fluctuations. The harmonic form long strategy is a powerful tool for accurately identifying potential market reversal points based on the Fibonacci ratio. When the form forms perfectly at the key support level, it often indicates the depletion of bearish momentum and the initiation of bullish trends.
As shown in the figure: 15M Bearish Crab

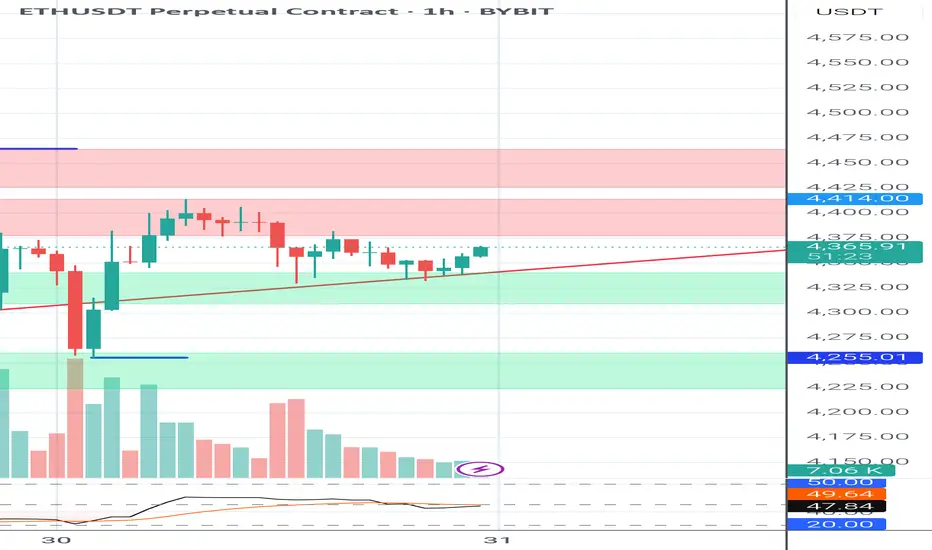
Short Term Trade Sell Ethereum at $ 4450 Target Price $ 4350 Very short term trade provided to short Ethereum at $ 4450/- and book profit at around $ 4350/-

Volatility Period: Around August 28 (August 27-29)
Hello, fellow traders!
Follow us to get the latest information quickly.
Have a great day!
-------------------------------------
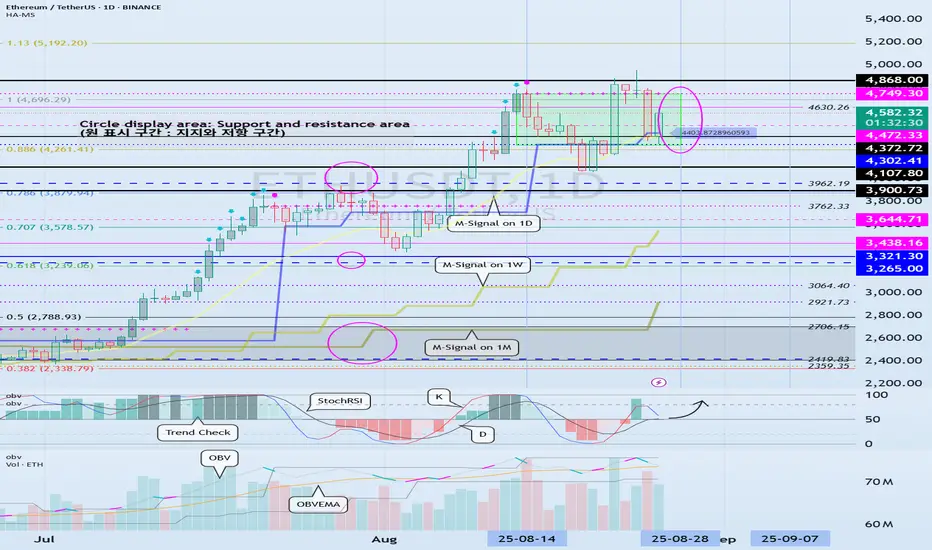
(ETHUSDT 1D chart)
It's rising, with support near 4372.72.
However, since the TC (Trend Check) indicator is at 0, it's unclear where the price will bounce.
Therefore, we need to determine whether support is found around 4630.26 or whether the price falls below 4472.33.
This period of volatility is expected to last from August 27th to 29th.
-
To initiate a cascading upward trend, support must be found around 4749.30.
-
Thank you for reading to the end.
I wish you successful trading.
--------------------------------------------------
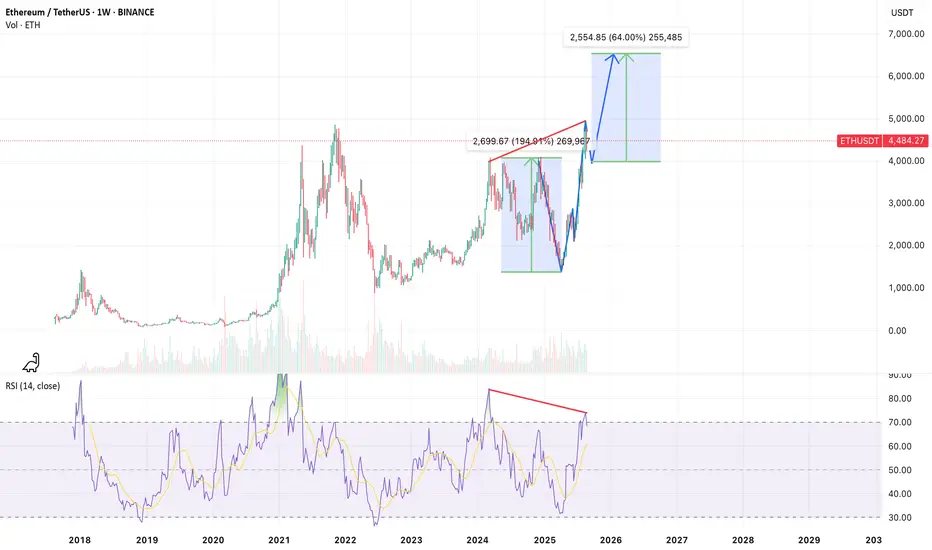
- This is an explanation of the big picture.
(3-year bull market, 1-year bear market pattern)
I will explain in more detail when the bear market begins.
------------------------------------------------------
[ETHUSDT] Possible V-Sharp FormationOn the weekly timeframe, ETHUSDT is showing signs of a potential V-sharp reversal pattern. A mild bearish divergence can be observed at the recent highs, indicating the likelihood of a corrective move toward the $4,000 support zone before resuming the broader bullish trend targeting the $6,500 area.
For educational purposes only. This is not financial advice.
ETHUSDBullish idea for ETH either we will continue going up from here or we might drop towards 4080 and then move towards ATH

ETH 1H Analysis – Key Triggers Ahead | Day 8💀 Hey , how's it going ? Come over here — Satoshi got something for you !
⏰ We’re analyzing ETH on the 4-hour timeframe timeframe .
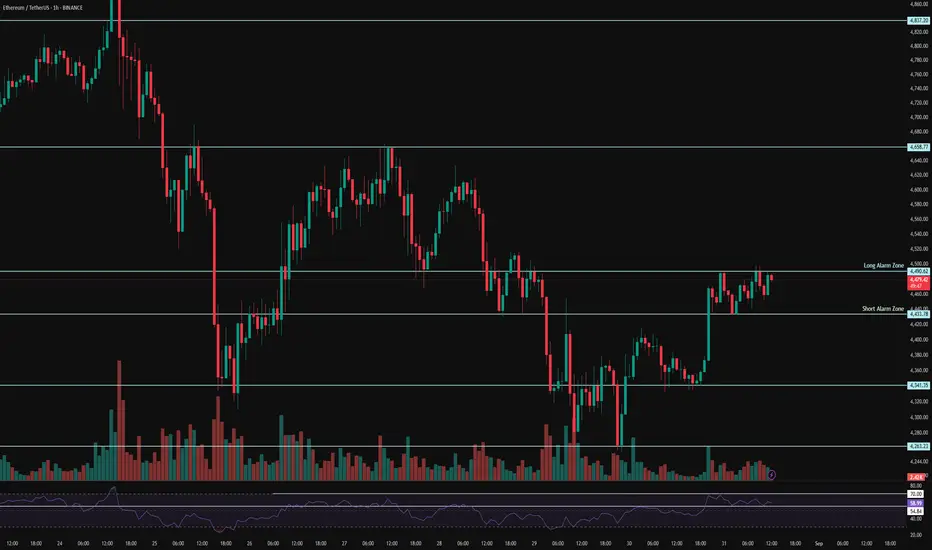
🔭 On the 1-hour timeframe of Ethereum, we can see that after a correction, Ethereum was supported at the $4263 area and moved upward. It had a resistance at the $4341 level which, after breaking and completing a pullback, pushed towards its next higher resistance. Currently, it is in a 1-hour or 15-minute multi-timeframe range, and with a breakout from this pattern, it can give us a trade opportunity.
⛏ Key RSI levels are at 70 and 55. If the fluctuation limit crosses these numbers, Ethereum can have significant volatility and start a new trend.
💰 The volume and number of green candles have increased, and their size also looks bigger. This can be a sign of Ethereum’s bias, showing that buyers are more willing to spend money compared to sellers. The volume and number of red candles have decreased, and they don’t create much selling pressure, although the market is currently in a holiday period.
🪙🪙 On the 1-hour ETHBTC timeframe, after breaking out of its box, Ethereum moved upward and also had a pullback to this box. Now there is resistance at the 0.04145 area, and with a breakout of this level, Ethereum can continue moving upward.
🔔 The alert zones considered for Ethereum are $4433, which is at the bottom of this range as the short alert zone, and $4490, which is at the top of this range as the long alert zone. With a breakout and confirmation above these levels, Ethereum can start its move in the new week. Note that this pattern has strong price action significance, and Ethereum’s monthly candle will also close tonight.
❤️ Disclaimer : This analysis is purely based on my personal opinion and I only trade if the stated triggers are activated .
How a Systematic Approach Helps Maintain Control
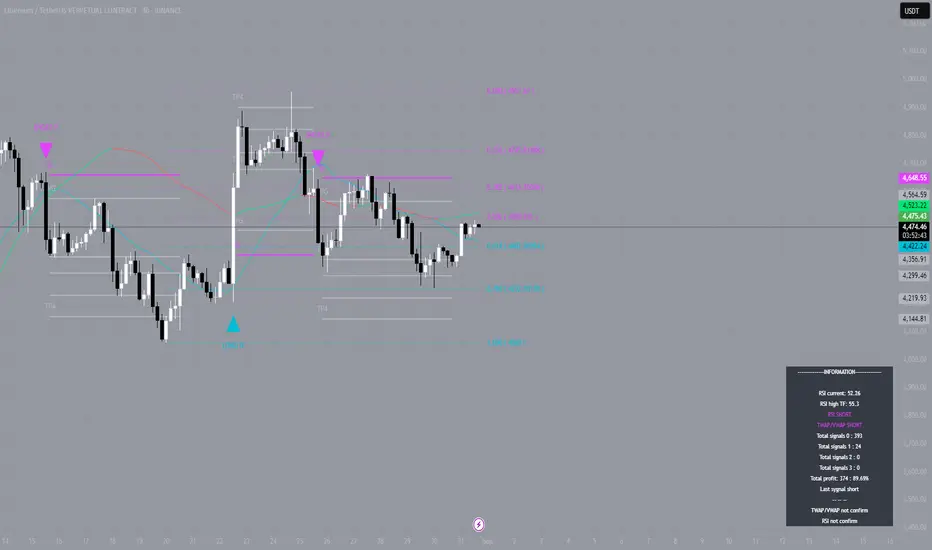
The crypto market has once again reminded us that price movement is never linear. Ethereum first moved down from the $4,614 level, hit TP1 at $4,369, then reversed upwards and took out stops at $4,660. It might seem like chaotic swings where holding a position is impossible. But it's precisely in such moments that the importance of a systematic approach to the market becomes obvious.
Most traders perceive these situations painfully. The price goes down — fear intensifies. Then a sharp reversal — greed emerges, along with a desire to "wait it out." As a result, the strategy breaks down: the trader closes too early or too late, and losses seem inevitable.
In reality, the market is not chaotic. It moves in stages: impulse, correction, consolidation. ETH demonstrated exactly that: a sharp drop, a test of the TP1 zone, a bounce, a stop run, and a return to the downward phase. To most participants, this looked like "randomness," but a careful look through an algorithmic model allows one to see the structure in advance.
The algorithm accompanied the trade step by step:
- It fixed profit zones as the price moved down;
- It reflected the moment of a potential upward reversal and limited risk with a stop-loss;
- It showed the resumption of the downward scenario and has kept the position open until now.
The key here is that decisions were made not on emotions, but based on structure and probabilities. The price can move in any direction, but when you have a management system, the trader controls the process, not the other way around.
No trader can predict the market with 100% accuracy. But you can predict your own behavior: set rules, exit zones, and acceptable risk in advance. Automating this process eliminates unnecessary doubt, helps maintain discipline, and allows you to work not on "intuition," but by algorithm.
ETH clearly demonstrated how the market shakes out weak hands and tests every participant's resilience. Those who acted spontaneously most likely lost. Those who worked systematically preserved their gains and continue to ride the trend.
This is where the true value of tools is revealed: not to guess the market, but to structure it, turning chaos into a sequence of steps. This saves time, eliminates emotional mistakes, and allows you to look at the price coldly, without panic.
ETH Market InsightETH shows strong volume with signs of institutional accumulation, preventing deep declines. Recent pullbacks were low in volume, not confirming a downtrend. Corrections stay within accumulation ranges, supply looks exhausted - a new ATH could be on the horizon.


ETHUSDT: Price Action and TPHello friends. as you seen the chart of ETHUSDT so after pullback on the base we see the positive sign to reach the chart the first p on the 4800 and second tp 5500

Ethereum Analysis (4H)It seems the price is not yet ready for a strong rejection to the downside, and buyers still hold strength. It is expected that, with the interaction or liquidity hunt that previously triggered a strong upward move, we may see another bullish wave. This move would both reinforce a bullish sentiment in the market and allow major players’ orders to be filled.
For a rejection to occur, it will either happen from the premium zone of the previous wave, or a new all-time high might form.
Let’s see how the market reacts to the highlighted red zone.
For risk management, please don't forget stop loss and capital management
When we reach the first target, save some profit and then change the stop to entry
Comment if you have any questions
Thank You

Ethereum Analysis – August 31, 2025As we mentioned earlier, Ethereum is still stuck in a decision-making zone. At first glance, it may seem like the market hasn’t moved much, but from a time perspective, it’s actually running out of chances for buyers — which increases the likelihood of a downside move day by day.
In fact, the drop might have already started.
Of course, to confirm a real breakdown, we still need a daily close below the $4,000 level. But even now, it doesn’t look like a bad setup for ETH sellers.
That’s why I suggest buyers start taking profits before it’s too late.
The first target for sellers is around $3,700, and the second target is near $3,500.

ETH updateETH moved according to our plan you can book partial profit and move your sl or if you want to play full setup its upto you

ETH time to bounce towards new ATH 5200In couple weeks time i expect retest of 4000-3950 level, if it holds and sep 17 rates will be cut then we will se new ATH for sure. If the rates cut will be postponed till begining of 2026 then it might drop to 3500.
Small trade on ETH with 1:1 RWBuy the ETH with risk\ration 1:1. We can try to move in the local flat channel and now we are on the middle line on this channel. The stop to below low level of channel, take to up level. Will see...

Possible drop to the 4200 zone.Most likely, the price will continue its decline and reach the key support at 4200. After that, if any major news comes out that reinforces this drop, we could see Ethereum much lower than these levels. But for now, everything depends on the 4200 zone to see whether it holds as support or not.

ETHUSDTI wait for come to 4200$ price that to me give best the position long.
EN: 4100 to 1200
SL: 3990
TP: 4400 - 4500 - 4700

Ether Still Bullish · We Are Going Up!Good morning my fellow trader, I hope you are having a wonderful Saturday.
Consider this Ether chart again; price action is still happening within the "still bullish" price zone. This is a range that I mapped on the chart as a "pause," a price range for a small break before more rising prices... Come on! We've seen this before.
May-July! The sideways period was even longer than this one and we had not conquered $4,000 nor a new ATH, yet, you remained strong. It is the same all over again.
When we initially extracted the numbers for this bull market, long ago, $4,000 nor $5,000 was ever the goal. We were aiming at a minimum of $6,000, $7,000 or even beyond. If we do good $8,513 it was said. If the bull market is extraordinary, you can see Ether trading at more than 10K.
All these possibilities remain open, all these scenarios but one; it is not the end. Ethereum will not stop growing in 2025 after hitting just under $5K. It will go much higher, we are still bullish; the best is yet to come. Patience is key.
The market is loading up but at the same time we have so much proof that the current chart is an easy hold. Actually, you can buy and go LONG at this point. Why? Because Ether is trading at support. Sell at resistance, buy at support.
We are going up.
Namaste.

ETH 4H Analysis – Key Triggers Ahead | Day 7💀 Hey , how's it going ? Come over here — Satoshi got something for you !
⏰ We’re analyzing ETH on the 4-hour timeframe timeframe .
🔭 In the 4-hour timeframe of Ethereum, we can see that after registering its all-time high, Ethereum was rejected downwards and then took support from the $4,273 area and moved upwards. We need to see how valid this support can remain in the new week. There is also an important resistance at the $4,515 area, and breaking this level could end Ethereum’s corrective trend.
⛏ The key RSI areas are 35 and 58. If the fluctuation passes these levels, Ethereum could enter a new phase of volatility and eventually start its movement.
💰 The size and number of red candles have almost decreased, and with increasing volume and larger candle sizes, Ethereum can start a good trend. Keep in mind that today is a holiday, so not much volume enters the market. On the other hand, there are rumors on Twitter about the death of Donald Trump, which could also prevent an increase in volume.
🪙 In the 4-hour timeframe of the ETHBTC index , we can see that this index broke its box at the 0.03946 area and registered an all-time high for Ethereum against Tether pair. Then it was rejected from this area and showed two rebound reactions at the 0.03946 support, which is the broken box top. With a breakout of the highlighted areas in this index analysis, both Bitcoin and Ethereum could see more liquidity, and this directly affects the ETH/USDT pair.
🔔 The alarm zones that can be considered for Ethereum in this timeframe are the $4,273 and $4,514 areas. The price action in these areas can be of high value, and with increasing volume, they could give us either a short or long trade opportunity.
❤️ Disclaimer : This analysis is purely based on my personal opinion and I only trade if the stated triggers are activated .

Ethusdt I think eth will hold support next week is September and rate cuts are coming I think next week the market will recover and reach new highs by end of month or sooner technical Macd looks bears are losing momentum on the 4hr and bottom of channel should hold hopefully

ETHUSD: Price rebound from Support ZoneHello everyone, here is my breakdown of the current Gold setup.
Market Analysis
On a chart we can see how ETH price decline from ATH to support zone 4330-4220. Ethereum already confirmed a pullback from this zone.
My Scenario & Strategy
My scenario is built on the expectation that Ethereum can make another one test of support zone and then rise to resistance 4550 and if breaks this level can grow higher to resistance zone 4700-4780
That's the setup I'm tracking. Thank you for your attention, and always manage your risk.
