ETH/USDTI think the box and area I drew below is a good buy zone for Ethereum and we could see an upward move from it.
USDTETH.P trade ideas

IF 4000$ support break then again 2500$ will testAs i mentioned on chart too here we had valid breakout to the upside of red trendline and retest also completed and price can easily pump more to the targets like 7K$ if the support of 4K$ hold but also we may have breakout to the downside of this support and then this pump scenario will receive another 6months-1year delay and market will see some range and fall first.
DISCLAIMER: ((trade based on your own decision))
<<press like👍 if you enjoy💚


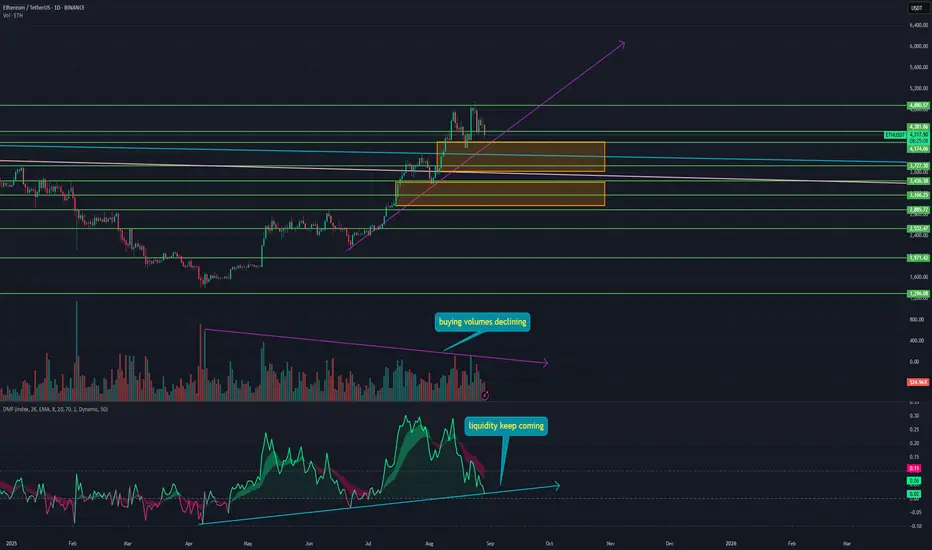
ETH Approaching a Key Level of the Entire CycleMany on Twitter are already calling for a bear cycle and a -50% correction. Inflation data looks bad, everything looks grim. And as someone naturally leaning bearish, I can only laugh at this.
➡️ From a technical standpoint, ETH is still in a bullish impulse and hasn’t even entered distribution yet. Here’s what to pay attention to:
1️⃣ ETH is still trading above both 5-year descending resistances. Both are now just below $4,000. As long as ETH stays above them — and especially if it closes the monthly candle above — this is a confirmed breakout.
2️⃣ ETH hasn’t even retested its trendline support from this impulse, which has been forming since June. How price reacts when it touches that support will be the first real signal to watch.
3️⃣ Buying volume is diverging from price action. Price is rising, but volumes are falling. This signals declining interest in ETH. Of course interest is fading — ETH has been climbing nonstop since April, already up over 250%. There are simply no buyers left at these levels.
4️⃣ What’s important is that the Money Flow indicator, which shows liquidity inflows, suggests there’s still no outflow from ETH. The balance is currently in a neutral zone.
5️⃣ And it’s impossible to ignore that two gaps have formed below:
$4,178 – $3,619
$3,413 – $2,972
And as we know, gaps get filled in 99% of cases.
📌 Conclusion:
ETH is clearly approaching a crossroads where the next major direction will be decided. But right now there’s absolutely no reason for panic. The key thing to watch is how price reacts when it touches the trendline support.
ETH 4H👁️👁️Where is that going? Upwards. They swept more longs than I expected, so the correction was deeper. They need more shorts to make the move higher.🖤

Ethereum sideways ┆ HolderStatBINANCE:ETHUSDT on the daily chart is showing a consolidation phase after rallying past 4200. Price could test the 4500 zone before continuing higher. Resistance remains at 5000, and a breakout there could extend to 5200+.


Ethereum (ETH): Back at 100EMA | Still BullishETH is back at 100 EMA, where buyers and sellers are fighting over the dominance of that zone. Despite price retesting the 100EMA once again, we are still bullish and we are still seeing a good bounce happening from here on.
The current market shakeout has been pretty deep and considering the fact that we are entering the new monthly candle (September), the shakeout is logical here.
Swallow Academy

ETH 1H Analysis – Key Triggers Ahead | Day 6💀 Hey , how's it going ? Come over here — Satoshi got something for you !
⏰ We’re analyzing ETH on the 1-hour timeframe timeframe .
🔭 On the 1H timeframe for Ethereum, we can observe that ETH broke its midline to the downside and moved toward the bottom of the box. With the slightly higher-than-expected U.S. inflation news, Ethereum bounced again from the bottom of its box, and now we need to see whether it can consolidate above the midline or not.
⛏ The key RSI levels are at 50 and 30, and once the oscillation surpasses these thresholds, Ethereum can begin its main move.
💰 The volume and number of red candles increased after the midline break, accompanied by selling pressure. The volume and size of Ethereum’s reversal candles can show us the strength of the rebound and the strength of the box bottom, since the bottom has not been lost yet.
📊 On the 1H ETHBTC chart, we can observe that if the bottom of the 1H box at 0.03972 is lost, more Ethereum will be sold and converted into Bitcoin. This index reflects the relative value between ETH and BTC. Breaking this marked level could serve as a confirmation for a short trade on Ethereum.
💡 The Ethereum alert zones remain the same as before, with the difference that for an early trigger we can consider a break and consolidation above the midline, which is relatively risky.
❤️ Disclaimer : This analysis is purely based on my personal opinion and I only trade if the stated triggers are activated .

EthMarket showing signs of weakening here tbh..
Potential for a sweep of 4k and even retesting 2.618 down at 3.5k
Over all bullish bias unless 3.5k is lost comprehensively but the volume of eth being purchased by institutions (announced already) is significant so I dont think we break down fully from here
But wider market forces also sugges a consodildatory period until the next Sept fomc.

short eth to touch vwap MTitle: Ethereum Short Setup – Targeting Monthly VWAP
Description:
ETH has recently shown weakness after failing to hold above the weekly VWAP and rejecting from supply levels. The order flow is shifting bearish with big sell imbalances appearing.
I’m looking for a short position targeting the monthly VWAP as the next liquidity magnet.
Price is currently below daily and weekly VWAP → bearish bias.
CVD shows continuous sell pressure.
Multiple big sell signals confirm absorption from buyers and dominance of sellers.
Trade Idea:
Entry: Current zone (after confirmation of rejection from intraday VWAP).
Target: Monthly VWAP (white line).
Stop: Above recent swing high / weekly VWAP.
This is a short-term intraday-to-swing setup aiming for continuation to the downside.

Don’t Buy Ethereum Until You Watch This!In this episode, I take a skeptical look at Ethereum’s latest price action. We’ll break down the recent pullback, identify clear triggers for long setups, and discuss what happens if key levels fail. Plus, a quick educational tip on how ETH.D and BTC.D can signal the start of altseason.
⚠️ This content is for educational purposes only and not financial advice.

ETHUSDT - weakining strength over 4H & 1D T.FsA Rising Wedge pattern: This is a classic bearish reversal pattern where the price makes higher highs and higher lows, but within a converging, upward-sloping channel. It suggests that the upward momentum is weakening.
Bearish RSI Divergence: The RSI indicator (value 36.51) is showing a clear divergence. While the price chart was making higher highs (as in the wedge), the RSI was making lower highs. This is a strong signal that the underlying momentum is fading and a price reversal to the downside is likely.

Perfect ETH AnalysisAs we mentioned in the previous analysis, Ethereum’s bullish fake move triggered by the U.S. interest rate news has fully retraced and even more. It has now reached an important support zone, and there’s a possibility it could drop further since the overall trend is stronger to the downside. However, there are several strong support levels along the way, any of which could hold and push the price up. At the moment, it’s not a buying opportunity until a proper trigger appears.

Middle East Tensions, Upcoming Iran War, Crypto FearThe crypto market is more influenced by collective emotions than any other market. The Fear and Greed Index is a clear example of this reality. Under normal conditions, it can indicate whether traders are overly greedy or fearful. However, when regional crises, such as a potential war in the Middle East, emerge, this index alone is not enough, and sudden panic can disrupt all calculations.
Hello✌️
Spend 2 minutes ⏰ reading this educational material.
🎯 Analytical Insight on Ethereum:
Ethereum remains within a very strong bullish channel 📈, yet a potential pullback of at least 14% is possible, with the key support level around $3,800. Breaking this area could signal a shift in the short- to mid-term trend. Traders should watch volume and momentum closely to anticipate potential entries or exits ⚡.
Now , let's dive into the educational section,
War and Its Impact on Market Psychology ⚔️
According to political and logistical analyses, the region is on the verge of a potential conflict involving Iran that could be larger in scale than the previous twelve-day war. Historically, global markets, especially crypto, react sharply to such situations. In the initial days of this type of crisis, strong bearish candles and rapid declines are almost inevitable, as investor fear peaks and liquidity quickly shifts to safe assets. However, historical market data shows that such declines are often temporary, and price recovery can happen relatively quickly, especially as whales and large investors use the opportunity to accumulate assets at lower prices. This scenario is not a certainty but a probable outcome that traders should incorporate into their risk management strategies.
Whales Hunting Fear 🐋
Whales, or large market players, use moments of mass fear to their advantage. By executing sudden buys or sells, they amplify the emotions of retail traders and usually capture the main profits from nervous hands. This is why many beginners sell exactly at market lows.
Retail Trader Psychology 😨
Beginners often react to collective sentiment rather than analyzing the data. When they see everyone selling, they panic and sell too. In reality, whales are often buying exactly at these moments. This cycle repeats frequently in the market.
Safe Havens During Crisis 🛡
When negative news and political uncertainty dominate, markets tend to move toward safe assets. In crypto, Bitcoin and stablecoins play this role. The higher the fear, the stronger the flow into these assets.
Practical TradingView Tools 📊
To avoid reacting emotionally, using TradingView tools is essential. One of the most important indicators is Volume Profile , which shows the price levels with the highest traded volume. When you see a significant spike in a specific range, it can indicate whale activity.
On-Balance Volume (OBV) helps determine whether price movements are driven by smart money or pure hype.
Relative Strength Index (RSI) is another key tool. When RSI approaches oversold levels during collective panic, it often signals an attractive entry point for whales.
Combining these tools provides practical insights. For example, when RSI is low and Volume Profile shows high activity, the probability of whales exploiting fear spikes is high. Professional traders use these tools not just for price analysis but to assess market sentiment.
TradingView tools allow you to make data-driven decisions instead of emotional reactions. This makes your analysis more valuable to site editors, as it offers both psychological insight and actionable methods.
5 Trading Tips 🔑
never let news of war or political crises force impulsive decisions, as emotional reactions during fear peaks are often the costliest mistakes.
always keep a portion of your capital in stablecoins or safe assets so you can take advantage of buying opportunities during sharp market drops.
instead of focusing on rumors, rely on TradingView tools and data to gain a clear view of money flow and real market positions.
reduce trading volume and focus on risk management during crises, as the market can move against expectations within minutes.
understand that steep drops caused by collective fear are often short-lived, and those who patiently
✨ Need a little love!
We pour love into every post your support keeps us inspired! 💛 Don’t be shy, we’d love to hear from you on comments. Big thanks, Mad Whale 🐋
📜Please make sure to do your own research before investing, and review the disclaimer provided at the end of each post.

Ethereum Cracks Support—Is $4080 Next?Ethereum Cracks Support—Is $4080 Next?
Ethereum (ETH) is breaking down from a bearish triangle pattern.
The key support level around 4490 has already been breached, indicating that selling pressure is intensifying.
Examining the left side of the chart, ETH has historically responded well to similar patterns.
Once confirmed, they’ve often led to strong moves.
Bitcoin (BTC) also remains slightly bearish, with no signs of upward momentum. This adds weight to the bearish outlook for ETH.
Based on this setup, I expect ETH to drop toward the following levels: 4335, 4215, and possibly 4081.
Taking into consideration also the bigger picture ETH can test 4080 in order to complete even a bigger pattern.
You may find more details in the chart!
Thank you and Good Luck!
PS: Please support with a like or comment if you find this analysis useful for your trading day

Ethereum Market AnalysisEthereum Market Analysis
Introduction
Hello dear traders! In this analysis, I have updated the status of the popular Ethereum chart
In the previous analysis, for Ethereum on a long-term basis, we identified the CHoCH (Change of Character) trend change with precision and specified the best buy zone. { Ideal time to buy with Confirmation }. According to our forecast, after the price enters the buy zone, the market moved up to the main target, which was the old high. Now this is a daily analysis and it shows us the small upward steps. My analysis is very simple and straightforward, and there is no need for further explanation. If the CHoCH trend changes in the daily analysis, I will present a new analysis to you. Wishing you success and enjoy.
Wishing you all success!
Fereydoon Bahrami
A retail trader in the Wall Street Trading Center (Forex)
Risk Disclosure:
Trading in the cryptocurrency market is risky due to high price volatility. This analysis is solely my personal opinion and should not be considered financial advice. Please do your own research. You are responsible for any profits or losses resulting from this analysis.

Ethereum / TetherUSEthereum Market Analysis
Introduction
Hello dear traders! In this analysis, I have updated the status of the popular Ethereum chart. In the previous analysis, I mentioned the presence of a structural change (CHoCH) in the weekly timeframe.
Technical Analysis
Currently, Ethereum is in the process of correcting to gather liquidity in the specified areas on the chart. It seems that a new upward trend has formed, and we can profit from this movement with short-term buying and proper risk management.
Price Targets
First Target: I expect the price to reach the Extreme OB (Day) level at 3555.18.
Second Target: After reaching this level, we may witness a price decline again while hunting for the Liquidity Dayle at the rate of 3525.72.
Possible Path
With the continuation of this trend, there is a possibility that the price may not reach the Secret Order Block (Day) level at 1985.78. If this scenario does not materialize, I will update the chart again and specify the ideal entry areas for you.
Wishing you all success!
Fereydoon Bahrami
A retail trader in the Wall Street Trading Center (Forex)
Risk Disclosure:
Trading in the cryptocurrency market is risky due to high price volatility. This analysis is solely my personal opinion and should not be considered financial advice. Please do your own research. You are responsible for any profits or losses resulting from this analysis.

ETH/USDTLooking at the chart, ETH is currently sitting on the trend line which is acting as a support. If the trend line breaks, price may move to $4200 for a LONG opportunity

$ETH #OUTLOOK CRYPTOCAP:ETH 💰
CRYPTOCAP:ETH 's 4H double top has the potential to break down, right?
I think there will be a correction in CRYPTOCAP:ETH because, based on its structure, its supply is being held back. The target for a decline could be around $3980.

ETHUSD ready to drop below 3200$Distribution looks done, secondary test is in — market ready to drop below $3200.

demand respected, RIVER being challengedThis is the ETH/USDT one-hour chart on Binance, using Heikin Ashi candles. Price has respected the ascending trendline and reacted cleanly off the $4,400 demand zone. That bounce at support, highlighted in the green circle, set the stage for a push higher.
The green dotted line is the RIVER — a descending supply line that has repeatedly capped price. We’re now pressing against it. It hasn’t broken yet, but the buildup suggests pressure is mounting.
Key levels above remain in play: the dark green block between $5,200–$5,400 as the next liquidity target, and the intermediate resistance band around $4,700, which price is testing now. Moving averages are starting to curl up, aligning in favor of continuation.
The setup is straightforward: demand respected, RIVER being challenged, and if it breaks, momentum should carry price into the higher liquidity block.

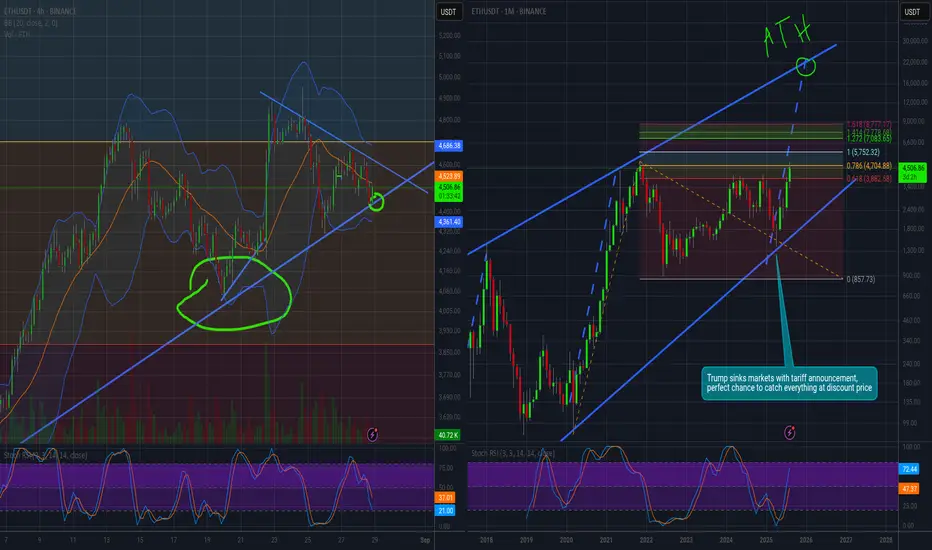
Bull Pennant Almost OverHere's hoping the trend line holds.
If the trend continues we could hit a new price target of 5752 according to trend-based fibonacci extension with 2020's covid impulse dip as the starting point.