ETH/USDT Short Trade SetupCurrent Price: 4480 USDT
Position: Short
Target 1 (TP1): 4433 USDT
Target 2 (TP2): 4390 USDT
Stop Loss (SL): 4510 USDT
Analysis:
ETH failed to break above the resistance zone at 4520 – 4550, showing weakness with increasing selling pressure. Technical indicators (HMA & Range Filter) also provided bearish signals.
If price breaks below 4433, we expect further downside towards 4390.
USDTETH.P trade ideas

Eth Short updateEth has moved accordingly from our entry
Enjoy gains move your sl for trading safely or its upto you if you wanna play full setup


ETH 1H Analysis – Key Triggers Ahead | Day 5💀 Hey , how's it going ? Come over here — Satoshi got something for you !
⏰ We’re analyzing ETH on the 1-hour timeframe timeframe .
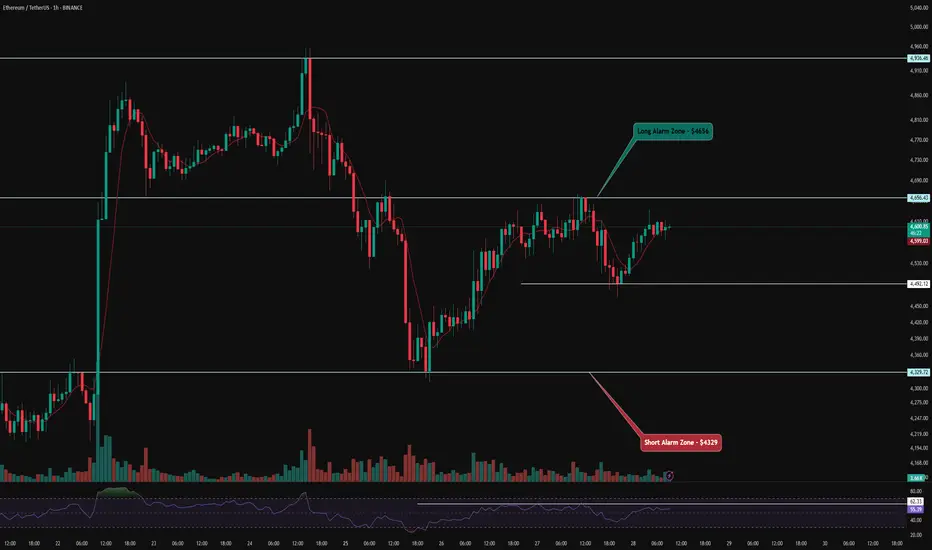
🔭 On the 1H timeframe for Ethereum, we can observe that ETH is moving inside a 1-hour range box, which has also formed with a V-pattern structure. A breakout and consolidation above or below this box can provide us with either a long or short trade setup.
⛏ The key RSI level is around 62, where Ethereum has been ranging for almost 2 days below this level with support around the 50 zone. Once the oscillation surpasses these levels, Ethereum can start its next move.
💰 The volume and number of green and red candles are almost equal. However, with larger green candles and rising volume, we can say that Ethereum is holding a good amount of accumulation volume.
📊 On the 1H timeframe of ETHBTC , we can observe that the alert zone for confirming a long position in Ethereum has slightly shifted lower, now sitting around 0.0415. Breaking this zone could allow Ethereum to move toward higher resistance levels and potentially even register a new all-time high.
💡 Looking at Ethereum’s alert zones, the level for a long position is around $4556, while the level for a short position is around $4329. With a breakout and consolidation above or below these areas, Ethereum gives us trade opportunities. Monitoring price behavior in these zones can be of great help in decision-making.
❤️ Disclaimer : This analysis is purely based on my personal opinion and I only trade if the stated triggers are activated .
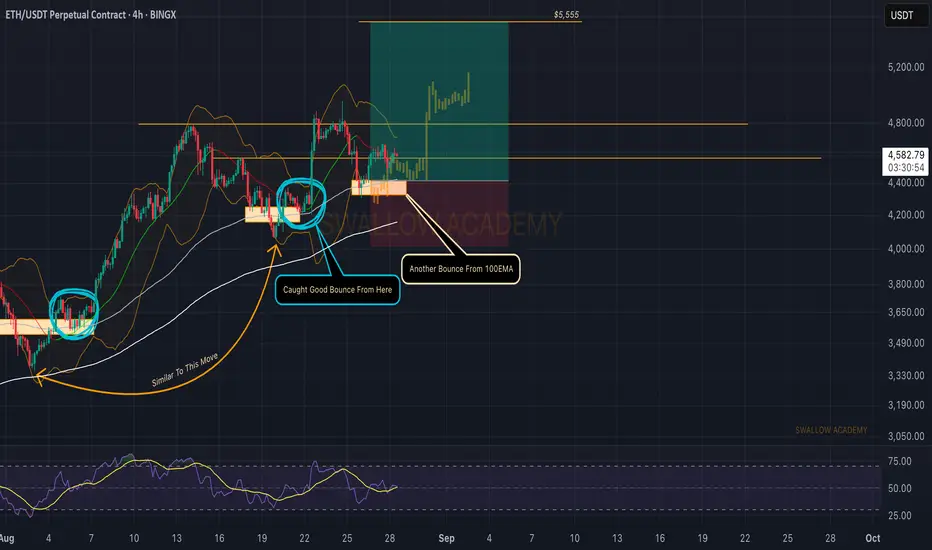
Ethereum (ETH): Just a Matter of Time | New ATH IncomingAfter another bounce on the 100EMA, buyers are now holding control over those areas, giving us a nice foundation for further movement to upper zones from here on.
The game plan remains the same; we are looking for a new ATH.
Swallow Academy
Mistakes vs. Strategy: Braxons Group InsightsFinancial markets are a place where you can either rapidly grow your capital or lose it just as quickly. This is especially true in 2025, as both the crypto and stock markets offer investors a wide range of tools — but demand discipline and risk awareness.
The Braxons Group team works with thousands of investors at different levels, and from our experience, we clearly see: there are certain mistakes that nearly all beginners make. Meanwhile, experienced investors not only avoid these traps — they use the market to its full potential and earn real profits.
Top 7 Mistakes That Cause Beginners to Lose Money
1. Chasing the Hype
Beginners often buy assets heavily discussed on social media or Telegram channels without fundamental analysis. Typically, they enter at the peak — and exit at a loss.
2. No Strategy
Investing on impulse, without clear goals, timelines, or risk understanding, is a fast track to losing capital.
At Braxons Group, every investment starts with a personalized plan.
3. Expecting “Fast Money”
Many hope to double their capital in a month and get disappointed when the market moves sideways — leading to panic selling and losses.
4. Lack of Diversification
Betting on a single coin, stock, or sector is a common beginner's error. Losses in such cases can reach 40–70%.
5. Poor Risk Awareness
New investors often go all-in or use leverage without being prepared for drawdowns.
6. Ignoring Education
Half of all losses come from not understanding simple concepts: volatility, support levels, take-profits, and stop-losses.
7. Overtrading
The desire for fast results leads to chaotic trading. The result: rising costs and worse performance than with a calm strategy.
How Experienced Braxons Group Investors Act
Experienced Braxons Group clients build portfolios and strategies based on proven principles and data. Their key approaches:
1. Clear Strategy with a 6–18 Month Horizon
They know why they’re buying each asset — and how long they’re ready to hold it.
2. Capital Allocation
40–60% in stable assets (stocks, index funds, BTC, ETH)
20–30% in promising altcoins, IPOs, or high-growth stocks
10–20% in cash/bonds/DeFi instruments for flexibility
3. Risk Management
Use of stop-losses, position limits, and regular profit-taking.
4. Portfolio Rebalancing
Portfolios are adjusted at least quarterly, depending on market conditions.
5. Working with Braxons Group Analytics and Support
Clients receive personalized recommendations, sector insights, and entry/exit signals.
Real Investor Case Studies from Braxons Group
Case 1: Beginner (Before Working With Us)
Investment: $10,000
Bet on a single hyped crypto asset
After 2 months: $6,400
Loss: -36%
Case 2: Same Investor After Adopting Braxons Group Strategy
Portfolio reallocated: BTC, ETH, index ETFs, part in DeFi
Return over next 5 months: +44%
Final balance: $12,500
Comment: “Now I don’t hope — I understand what I’m doing.”
Where Experienced Braxons Group Investors Are Earning in 2025
Stock Market
AI companies, cybersecurity, cloud tech
Index funds with moderate returns and low volatility
Portfolio returns: +12–24% since early 2025
Crypto Market
BTC, ETH, SOL, L2 projects
Staking yields: 5–10%
Altcoins with 100–150% growth potential over 6 months
DeFi and Web3 Segment
Using auto-yield platforms
Access to early-stage tokens and airdrop campaigns
Result: Braxons Group experienced investors in 2025 are seeing returns between +38% and +112%, depending on strategy and risk profile.
How Braxons Group Helps Beginners Become Profitable Investors
Personalized strategies based on goals and time horizon
Algorithmic asset allocation with regular rebalancing
Educational modules to build market understanding
24/7 analytics and support Honest feedback on performance and actions
Conclusion
There’s always a clear dividing line between those who lose money and those who make it: strategy, knowledge, and discipline.
Beginners often act emotionally, while Braxons Group investors follow structured, market-adapted plans.
Braxons Group investors make money because they base decisions on experience, data, and guidance. And the mistakes that hold most people back — we turn into lessons and long-term growth.

Ethereum defended the $4310 ┆ HolderStatBINANCE:ETHUSDT on the 6h chart is consolidating under 5000 after a -14% retracement. Flag structures and channel support keep the trend bullish, with 5000 acting as the major resistance. A breakout above this line sets the stage for 5200.

ETHUSDT - SHORT? – Short Squeeze Fading, Risk of PullbackETH Analysis – 26 Aug → Now
Edge:
Price has been trending up since 26 Aug, but data confirms this is a short squeeze, not organic spot demand.
Aggregated OI (Coin + Stablecoin margined): Sharp spike at 12:30 UTC (HyperLiquid) → now steadily bleeding lower. Trapped perp positions are being unwound.
Aggregated Spot CVD: Trending down while price goes up → spot is selling into the rally.
Futures CVD: Showing bearish divergence → perp buying power fading.
Exocharts View (30m Delta Clusters)
Delta: Multiple negative delta bars despite higher price → shorts closed, not strong longs initiating.
OI Delta: Net negative since the pump → confirms liquidation-driven rally, not fresh positions.
Net Longs vs Net Shorts: Shorts puked around 12:30; new longs haven’t stepped up.
VWAP: Price currently above VWAP (buyers still holding the line), but the underlying flow is weak. A VWAP breakdown would likely accelerate the squeeze unwind.
Conclusion
Current structure = Perp-driven short squeeze → OI bleed + spot divergence confirm limited sustainability.
Holding above VWAP buys bulls some time, but without fresh spot demand, risk is for mean reversion back to pre-squeeze levels.
Bias: Bearish unless spot flips positive + OI stabilizes.

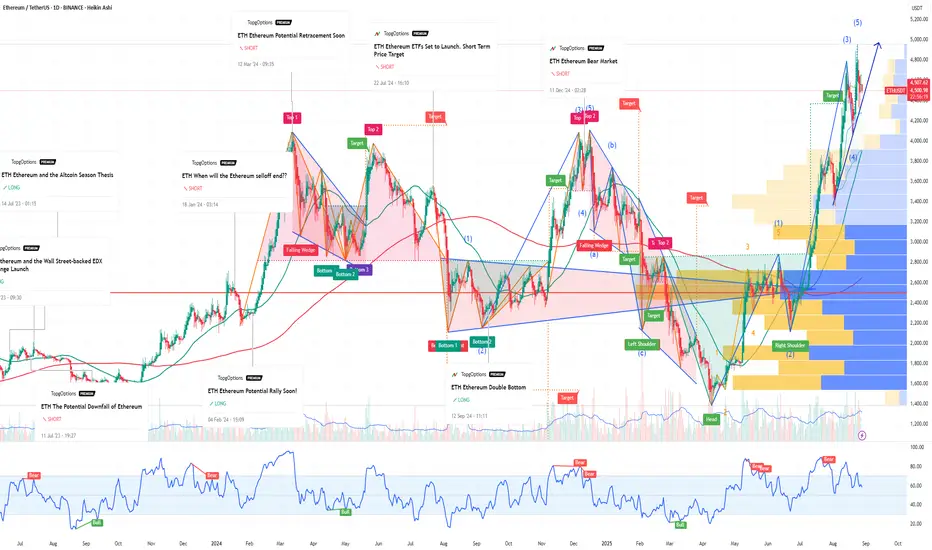
Why ETH Ethereum Could Surpass BTC Bitcoin’s Market CapIf you haven`t sold the previous top on ETH:
Now why Ethereum Could Surpass Bitcoin’s Market Cap:
1. Ethereum’s Network Upgrades Drive Value
Ethereum has undergone significant upgrades, most notably the Merge, transitioning the network from Proof-of-Work (PoW) to Proof-of-Stake (PoS). This dramatically reduced ETH’s issuance rate and energy consumption, positioning Ethereum as a more sustainable and “deflationary” asset. With upcoming upgrades like Sharding, Ethereum is set to become faster, cheaper, and more scalable—critical factors for adoption in decentralized finance (DeFi) and Web3 applications.
2. DeFi and Smart Contract Dominance
Ethereum hosts the majority of DeFi protocols, NFT marketplaces, and decentralized applications (dApps). The network effect is strong: developers and users are deeply entrenched in Ethereum, creating high demand for ETH for transaction fees (gas) and staking. As DeFi continues to grow, ETH’s utility and demand could rise exponentially, putting upward pressure on price.
3. Institutional Interest and Adoption
Institutional interest in Ethereum has increased substantially. Products like ETH ETFs and staking services are attracting large-scale capital inflows. Unlike Bitcoin, which is often treated as digital gold, Ethereum has a dual narrative: store of value and programmable money. This unique proposition makes it appealing not only to investors but also to corporations exploring blockchain solutions.
4. Scarcity and Deflationary Pressure
Post-Merge, Ethereum implemented EIP-1559, which burns a portion of transaction fees, effectively reducing ETH supply over time. During periods of high network activity, ETH becomes increasingly deflationary. This contrasts with Bitcoin, whose fixed supply doesn’t adjust dynamically to network usage, giving Ethereum a potential advantage in a high-demand scenario.
5. Macro Trends and Crypto Evolution
As crypto matures, utility and adoption increasingly dictate valuation. Ethereum’s ecosystem—spanning DeFi, NFTs, DAOs, and enterprise solutions—is far more versatile than Bitcoin’s. This could make ETH the go-to platform for digital finance, giving it an edge in both market capitalization and long-term relevance.
ETH 2H – Demand Zone in Play, Next Liquidity 4,072 or 4,958?Ethereum is pulling back into demand near 4,335 after the recent break of structure. This zone also aligns with a liquidity pool, making it a key level for short-term direction.
Bullish path: A reaction from demand could send price toward the upper liquidity magnet at 4,958.
Bearish path: Failure to hold 4,335 opens a move lower toward liquidity at 4,072.
Momentum is cooling, but ETH remains at a decisive level. Traders should watch for confirmation around the demand zone before the next leg unfolds.

ethereum bearish ideaLooking at Ethereum, i see the 8th of September as the top for this cycle. Took the highs, if we start closing below, and change the market structure, that would confirm the bearish plan

ETH - High Risk ShortPer my BTC analysis, I expect the market to crash very hard and quickly, timed with the US dollar bearish retest on major weekly breakdown.
Entry in green, targets marked and path shown.
ETH fell below this major series of bearish trendlines, targets marked by analyzing liquidity and volume profile levels.

Decline in Ethereum volume.After the U.S. interest rate news, the price surged sharply but then fully retraced. Now it’s climbing again on very low volume. This type of upward move does not indicate strength, since with such low volume the market moves with minimal buying and selling, making it prone to a fakeout. I expect the price to retest 4460 once more, after which an increase in volume could enter the market to support a real rally.

ETHUSDT consolidating after strong impulsive move to the upsideEUTUSDT is currently consolidating after a strong impulsive move to the upside. The recent price action appears to be a corrective downtrend, suggesting a healthy pullback rather than a full reversal
As long as the price holds above the 4.400 support level, this consolidation phase can be viewed as a base for another potential bullish leg. A sustained hold above this structure could trigger a rebound, targeting the 4.800 resistance zone in the near term.
You may find more details in the chart.
Trade wisely best of Luck Buddies.
Ps; Support with like and comments for better analysis .

ETH 1H Analysis – Key Triggers Ahead | Day 4💀 Hey , how's it going ? Come over here — Satoshi got something for you !
⏰ We’re analyzing ETH on the 1-hour timeframe timeframe .
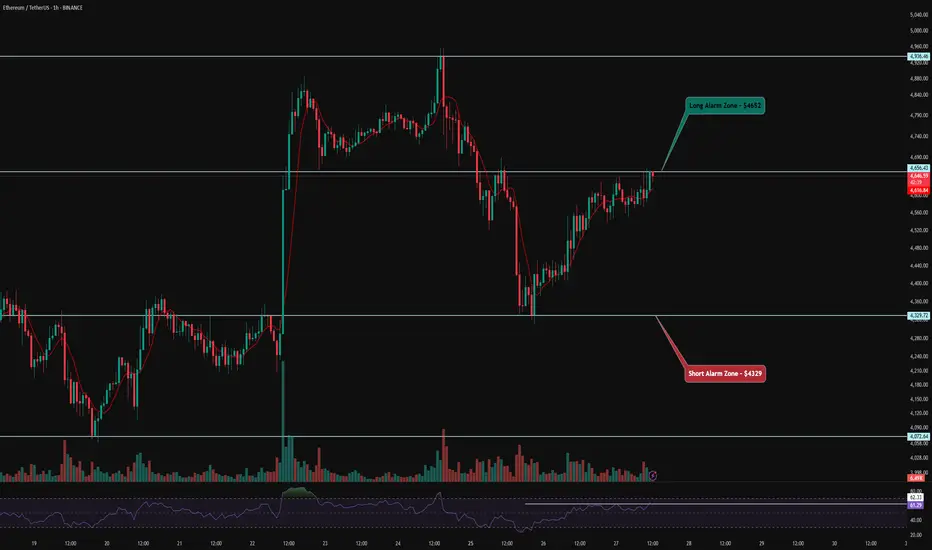
👀 On the 1H timeframe for Ethereum, we can observe that ETH is currently moving inside a V-pattern. If the price breaks out and consolidates above the neckline of this pattern, we could see a strong bullish continuation. Checking ETF flow data also shows heavy accumulation of Ethereum, which supports the bullish bias.
⚙️ The key RSI level for ETH sits around 62. Once the RSI crosses above this threshold, Ethereum has the potential to break the neckline of the V-pattern and push into the overbought zone, signaling further upside momentum.
🕯 Additionally, the volume, candle size, and number of green candles are increasing as ETH approaches this resistance. With rising trading volume, ETH could target higher price levels and potentially confirm a new all-time high.
🪙 On the 1H BINANCE:ETHBTC chart , we see a significant resistance level around 0.04274. A breakout above this zone with strong volume and volatility would provide an additional confirmation for a long position in Ethereum.
🔔 Our long setup alert zone is placed around $4652, while the short setup alert zone is positioned near $4329.
❤️ Disclaimer : This analysis is purely based on my personal opinion and I only trade if the stated triggers are activated .
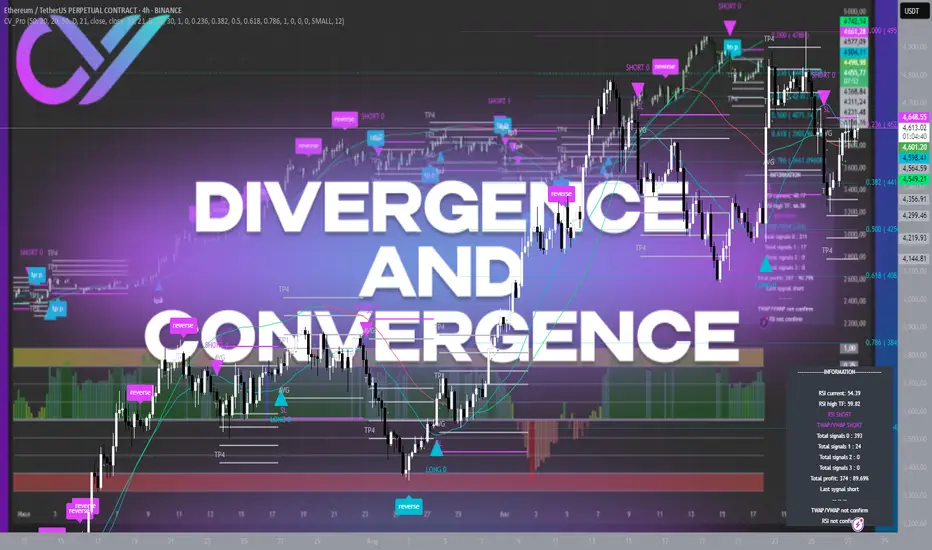
Divergence and Convergence: How to Read Market SignalsThe cryptocurrency market, like any financial market, is full of paradoxes. Price can rise, yet the strength of the trend is already weakening. Indicators may show that the move is “running on fumes,” but most traders keep buying at the top or selling at the bottom. The result is always the same: emotional trading and chaos instead of system and consistency.
The main problem is that most participants only look at price. But price is just the tip of the iceberg. Beneath it lie volumes, momentum, trader sentiment, and recurring statistical patterns. This is where divergence and convergence come into play — signals that often warn of a trend change long before it becomes obvious.
What are Divergence and Convergence
Divergence occurs when the price makes new highs or lows, but a momentum indicator (such as RSI or MACD) shows the opposite — weakening strength. It’s a signal that the trend is losing energy and the probability of reversal is rising.
Convergence is the opposite. The price updates a low, but the indicator shows higher readings. This suggests sellers are losing steam and buyers may soon regain control.
On the chart, these may look like small details, but for an attentive trader, they mark turning points — the very beginnings of shifts that later become obvious to everyone else.
Why These Signals Matter
Imagine Bitcoin climbing from $105,000 to $118,000. Everyone is euphoric, and newcomers rush to open longs, hoping for more upside. Meanwhile, RSI is already showing divergence: price is up, momentum is down. For a careful trader, that’s a red flag.
Moments like this help avoid buying at the peak and prepare for an incoming correction. More importantly, divergences not only give exit signals but also highlight potential reversal zones — places where traders can plan new entries in the opposite direction.
How to Read Divergence and Convergence
Compare price highs/lows with the indicator. If price rises but the indicator falls — it’s divergence.
Check the context. A single signal on the indicator means little. Support/resistance levels, volumes, and candlestick structure matter.
Be patient. Divergence can form over several candles, and the market often makes one last push before turning.
Combine tools. Use divergence alongside TP/SL zones and trendlines to improve accuracy.
Common Mistakes
Many beginners make the same error: they see divergence and instantly trade against the trend. That’s wrong. Divergence isn’t a “buy/sell button,” it’s a warning. It says: “Be cautious, momentum is fading.” The actual reversal must still be confirmed by price structure and volumes.
Another mistake is ignoring timeframe. Divergence on a 5-minute chart may only play out for a few dollars, but on a 4H or daily chart, the move could be massive.
Building it Into a System
This is the crucial part. An indicator alone won’t make a trader successful. Divergence and convergence need to be part of a system where:
- entry and exit zones are pre-defined,
- profit targets are clearly marked,
- risk is limited by stop-losses,
- and decisions are made without emotions, based on structure.
This is where algorithms and automation prove invaluable. An automated model spots divergence earlier than the eye, flags conditions for a probable trend shift, and guides the trade step by step.
Why It Works
Markets move in cycles, and history repeats. Divergence and convergence are not magic, but a reflection of market physics: momentum fades, energy runs out, and no trend lasts forever. Ignoring these signals means trading blind.
Integrating them into a structured process means having a map of potential scenarios ahead of time. It doesn’t guarantee perfection, but it eliminates guesswork and replaces it with probabilities and discipline.
Conclusion
Divergence and convergence are market warnings for those who pay attention. They help traders exit on time, avoid entering at peaks, and prepare for reversals. Most importantly, they train discipline and patience — the qualities that separate long-term survivors from those who get washed out.
In a world where emotions break strategies, systematic analysis provides the edge. Automation, technical tools, and the ability to read market structure turn chaos into a structured process. For traders seeking to look deeper than just price, divergence and convergence are signals worth learning to read as carefully as a book.
Ethereum Eyes $5K Breakout — Is a New ATH Coming?Ethereum is approaching its major resistance zone near $5,000, showing strong bullish momentum after bouncing off the supportive trendline. The recent candle confirms a macro bullish reversal.
If CRYPTOCAP:ETH breaks and closes above the resistance zone, it could open the path toward new all-time highs. As long as it holds above $2,900–$3,000, the structure remains bullish.
DYOR, NFA

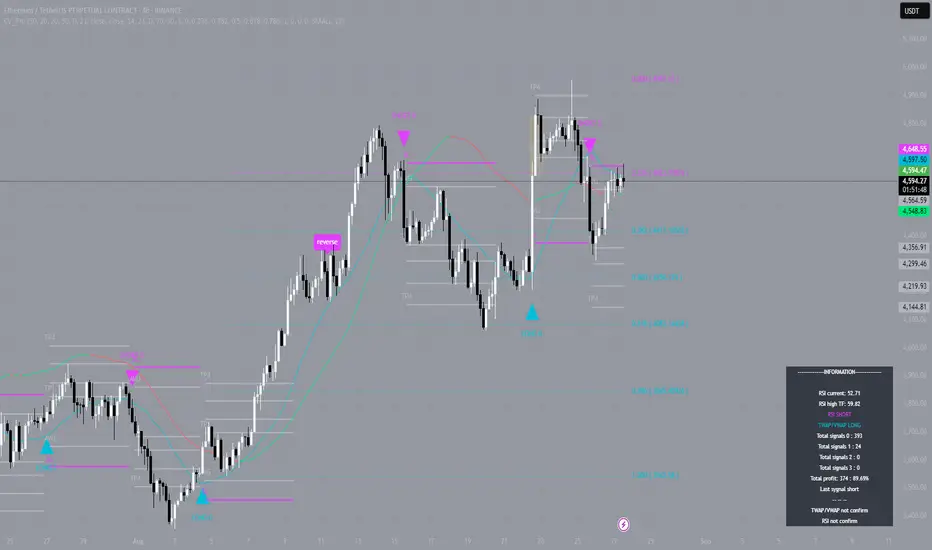
Ethereum: when levels guide the tradeEvery trader knows: entering the market is one thing, but understanding where to take profit is another. Without a system, the chart turns into chaotic candles, and decisions are driven by emotions.
A recent move on Ethereum’s 4-hour timeframe clearly showed the value of structured visualization. The entry was around $4274, with price developing up to $4650, where many participants could have locked in profit before the trend shifted.
This isn’t randomness. It’s the power of levels that outline the market’s roadmap in advance: where strength is concentrated, where reversals may happen, and where profit-taking makes sense.
For beginners, such levels serve as a navigator: they reveal patterns that would otherwise take years to master.
For intermediate traders, it’s an accelerator: a tool that eliminates chaos, enforces discipline, and reduces mistakes caused by emotions.
For advanced traders, it’s about saving time and keeping strategy under control without redrawing charts manually.
For investors, it provides a visual layer of clarity: entry and exit points become easier to track, and long-term strategies gain transparency.
The market will always move on its own terms. But traders have a choice — react to chaos or build structure. Visualization of levels provides the system: it shows the market map and helps maintain discipline regardless of volatility.
ETH SHORTHey everyone
I have analyzed a Untapped supply 4H zone which I will be shorting and targetting weekly lows.
as thats where most of the liquidity sits.
Its a basic boring setup but lets see.

***ETH Moonshot***-> Long to $5700 ?!?!?!Entered long on ETH near support, close to the monthly and previous weekly POC that had never been tested before. There’s also a daily order block and an H4 breaker confirming my idea.
**Cons:**
This area is very obvious, BTC looks weak, and September could bring a month of ranging and poor price action. I’ll be very conservative with break even and partials if we get a bounce.

Ethereum (ETH): Bounce From 100 EMA (once again) | BULLISHAnother bounce from the 100EMA happened on ETH, where a sharp bounce resulted in the break of structure on smaller timeframes, opening for us an opportunity for a long position.
Price is up by 5% (approximately) and most likely we will see the retest of ATH; the target remains the same: $5,555.
Swallow Academy

ETHUSDT 4H SETUP.ETHUSDT | 4H Bullish Setup
🗝 Key Structure Update
Price broke structure to the upside (BOS) and confirmed bullish bias.
Currently retracing after a strong push.
📍 POI Zone
Two potential Points of Interest (POI):
First POI: Minor retracement zone near 4,450 (demand area).
Second POI: Stronger Order Block around 4,300 with confluence.
📊 Trade Plan
Waiting for price to retrace into either POI zone for confirmation before entering long.
Two possible bullish continuation paths are marked on chart.
🎯 Targets & Invalidation
Upside targets above 4,900–5,000 region.
Invalidation if price closes below 4,300 OB zone.

Ethereum (ETH/USDT) 1-hour chartRecent Movement: Price recently rebounded from a low near 4,400 USDT but is now consolidating just below 4,600 USDT.
Trend: The short-term trend shows a recovery from a significant dip on the 26th but with visible resistance overhead.
Key Levels
Resistance Levels (upside targets):
4,630.06
4,695.88
4,761.70
4,827.52
Major resistance at 4,940.14 (previous swing high)
Support Levels (downside risk):
Immediate: 4,564.24 (close to current price)
Next: 4,498.42 (orange line, critical support zone)
Trend & Momentum
Short-term trend: Neutral to slightly bullish (due to prior recovery), but momentum is weakening.
Potential Scenarios
Bullish Case
Price must reclaim 4,564.24 and sustain above 4,630 to challenge 4,695–4,761 zones.
Breakout above 4,827 can lead to a retest of 4,940.
Bearish Case
Failure to hold 4,498.42 could trigger a deeper pullback toward 4,400–4,350 zones.
Volume spike on red candles would confirm stronger selling pressure.
⚠️ Disclaimer : This chart is for educational purposes only.
Regulatory Note: We are an independent development team. Our services are not registered or licensed by any regulatory body in India, the U.S., the U.K., or any global financial authority. Please consult a licensed advisor before making trading decisions.
