Ethereum · Crash or Higher?I see Ethereum and I look at Ethereum and all I see is rising prices. I can see the potential for a retrace and the bearish signals short-term but still, all I see is rising prices and a rising trend, it will continue.
Here we have a very strong rising trend and it seems Ether is peaking. There was a high 10 days ago and now we are seeing a double-top. Yesterday was a new all-time high and the candle ended with a small real body and large upper wick. This can be read as bearish but also as resistance being challenged.
Trading volume is standard for a continuation. All general signals are bullish. The trend is bullish. The market tendencies are bullish. The sentiment is bullish, etc.
Between May and July we had a period of sideways action, two months. Something similar can happen but instead of two months, two weeks or four weeks. I believe this one will be shorter than the last.
Prices can drop just to recover the next day. Prices can continue rising without a drop. It is hard to predict the very short-term.
Ethereum is bullish on all timeframes and no signals point to a top being present.
The day with high bearish volume 14-August was matched by a day of high bullish volume 22-August. So the market remains positive on the upside. The market bias continues bullish.
Ethereum is bullish long-term, and we expect to continue rising as long as the action is happening above $4,100. If it moves below, we will rethink.
Thank you for reading.
Namaste.
USDTETH.P trade ideas

Ethereum 4620 $ ---- 4374 $ after correction to $5400 ???Given the downward trend of Bitcoin, there is a possibility of a correction in the price of Ethereum to $4,375
We should also wait for Bitcoin movement

Ethereum above the $4400 ┆ HolderStatBINANCE:ETHUSDT on the 1D chart is consolidating after a steep rally from triangle breakouts. Price action is hovering above $4,440, with potential to briefly dip below $4,500 before recovering higher. As long as $4,400 holds as support, the broader bullish channel targets remain at $5,000–5,200.


ETH 4H Analysis – Key Triggers Ahead | Day 3💀 Hey , how's it going ? Come over here — Satoshi got something for you !
⏰ We’re analyzing ETH on the 4-hour timeframe timeframe .
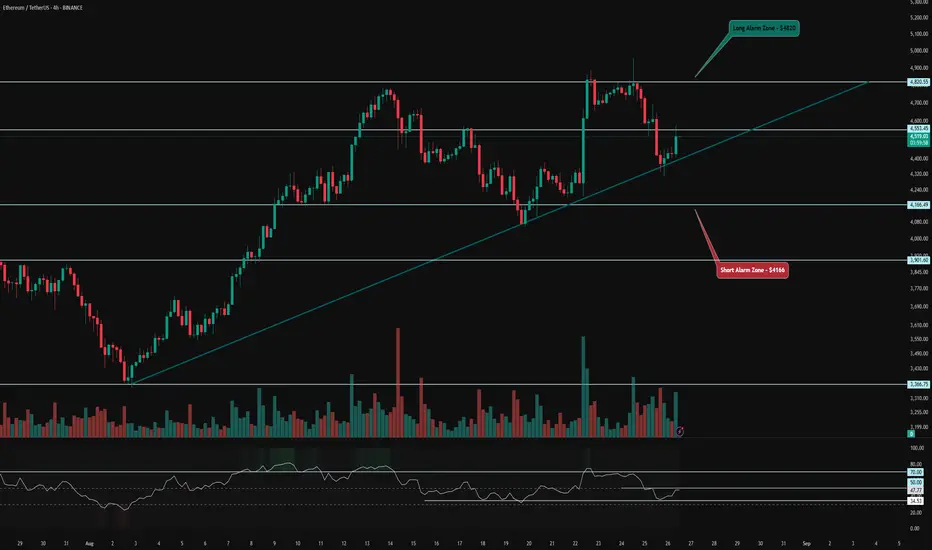
👀 We’re observing the 4-hour Ethereum chart, and ETH is trading within a 4-hour box. The ceiling of this box is at the $4,820 level, and the floor is at $4,166. The floor was once faked out, showing a reaction toward the ceiling but got rejected from this area. Buyer makers have kept the price near the midline of the box. A trendline has been drawn from the box’s lower level, and each time ETH hits this trendline, it has shown an upward reversal. Breaking and holding above the midline of the box could push ETH toward the ceiling, with the midline acting as an early trigger .
⚙️ Key RSI levels are at 50 and 70. With increased volatility, long trades on Ethereum could drive it upward, and crossing the 50 level could push ETH’s price into the upper part of the box, giving it another chance to test breaking the 70 level and setting a new high. If rejected and this scenario fails, ETH could experience a deep correction, as it hasn’t entered oversold territory or seen a deep correction for several days .
🕯 The size and volume of green candles have increased compared to red candles, which prevents a deep correction in ETH. However, yesterday in ETFs, people bought a significant amount of Ethereum, and this weakness in the corrective trend suggests that ETH has a stronger tendency to rise and climb .
🪙 We’re observing the 4-hour ETH/BTC index chart, and ETH has a strong support level against Bitcoin at 0.03972, where increased volume triggered a reversal. There’s also a resistance level at 0.04275, and breaking this level with increased volume and RSI entering overbought territory could confirm a long trade for ETH .
🔔 Our trading alarm zones for ETH positions are at $4,820, where breaking this level could signal a long position. An early trigger for a long trade could be at $4,553, where breaking this level increases the likelihood of breaking the ceiling of the 4-hour box. The short trade alarm zone is at $4,166, where breaking this level could initiate a deep correction for ETH .
❤️ Disclaimer : This analysis is purely based on my personal opinion and I only trade if the stated triggers are activated .
EthusdtSeems to mee eth can bounce off this support on bottom of channel I don’t think the bull market is over yet , too many alt coins etfs been filed none approved yet market still has room to go btc dominance has still a lot of room for altcoins to grow

$ETH-4H just ran buy-side liquidity… now hunting the lowsPrice swept buy-side liquidity above the recent highs and created a BOS.
Fair Value Gap (FVG) formed, aligning with internal liquidity below.
Expecting a retracement into internal liquidity zone.
CONFLUENCES -
1. Bos + liquidity sweep ( price break the resistance and close back in the range.)
2. Engulfing candle + RSI DIV ( Price making HH and the RSI making LL.)

ETHUSDT ETHEthereum has shown bullish strength in recent weeks and has formed several positive patterns. I believe it will target the $8,500 level after breaking the top at $4,900.

ETHUSDT: Trade 15 min Next TradeContinuing the previous trade we had in Ethereum, we are now trading this currency downwards. May you be profitable and successful.

Ethereum (ETH): Back To 100EMA and 200EMA | Look For BounceETH is back near the 100 and 200 EMA area, where last time we had a decent bounce from this zone.
Although we had a good catch last time, the price fell back and did not give us the breakout we were expecting after reaching our target. So looking for another attempt to breach the ATH zone and potentially break it as well! -The MAJOR target here is over $5000 (aiming for the nice $5555 number).
Swallow Academy

Quick Update: EthereumEthereum is stuck between the trendline and the 200-hour moving average. These two levels will likely guide short-term moves ahead of the GDP and PCE data. Watch for a breakout in either direction to set the intraday trend.

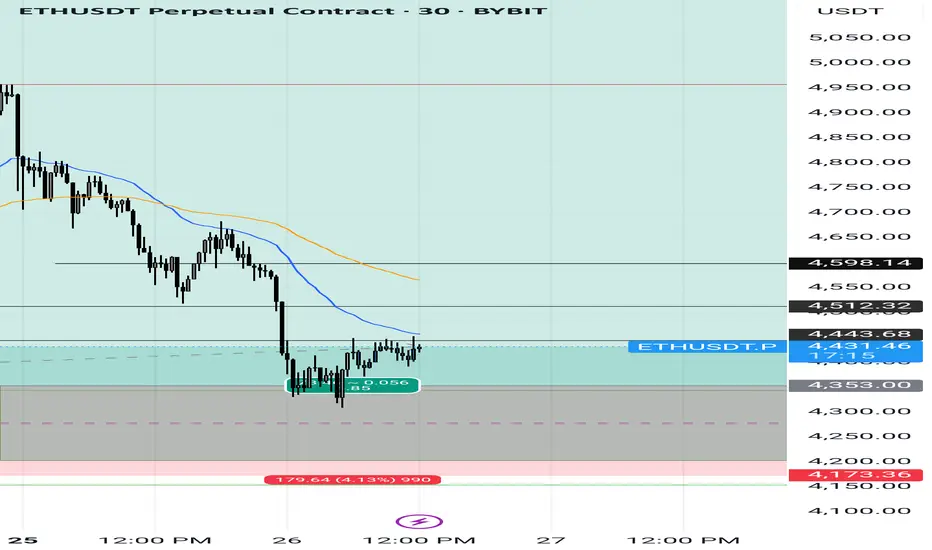
Weekly trading plan for EthereumLast week, Ethereum showed excellent volatility, moving according to our plan. But at the moment, the price is in a correction phase and trading below the weekly pivot point.
The key level for this week is 4,290 — if it breaks, we’ll likely continue the downtrend toward the second support level. As long as the price holds above it, there’s still a chance to see growth toward 4,598 (the weekly reversal level), and if that breaks, the uptrend could continue with a target of a new ATH.
If the price meets resistance at this level, the correction may extend down to 4,077 .

Eth tp areas Short termEth tps updated in the chart for reference as tps are just reference you should always book where you see good profit depends on you position size and risk

ETHUSDT: Trade 15 min FractalsThe Ethereum chart is growing up to the specified point and a small long trade can be taken, after which the downward trend will continue until the observed area, of course, it remains to be seen how it will close in that area.

Latest Update on ETHUSDTHello, my wonderful friends! What are your thoughts on BINANCE:ETHUSDT ?
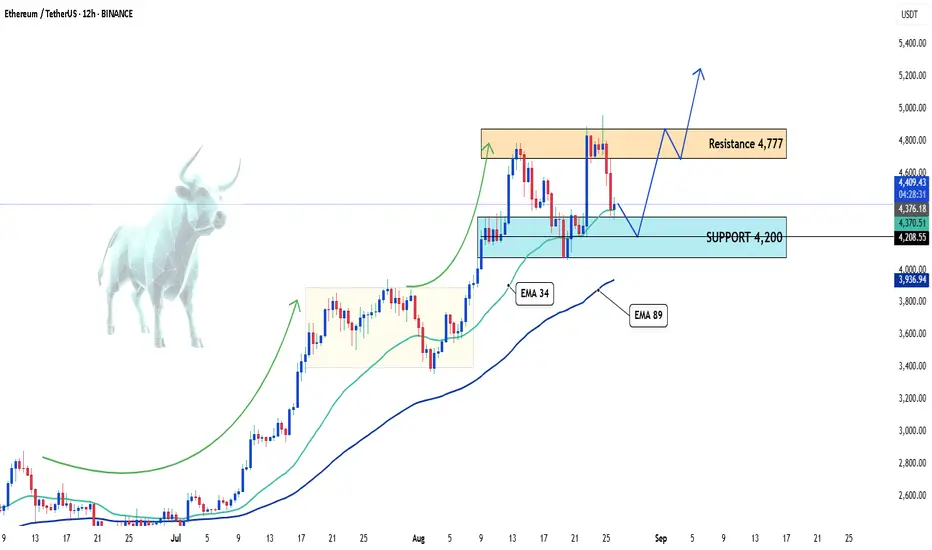
Recently, ETHUSDT has shown a strong correction after reaching a high of nearly 4,777 USD. From this point, ETH has slowed down and pulled back, but the key support level at 4,200 USD is holding up, helping the price bounce back in the short term.
We are seeing ETH trading above the EMA 34, with both EMA 34 and 89 acting as crucial dynamic support zones. If the price maintains stability above this support, the chance to push towards the 4,777 resistance level could open again.
My view is bullish. What about you? Do you think ETHUSDT will continue to break above 4,777, or will it struggle at this level? Feel free to share your thoughts!
Eth update ETH is up for from our entry enjoy guys don't forget to take profits and let it run with sl

Ethereum New Analaysis (4H)Now, Ethereum may face a serious correction after making one more high. So pay close attention to the $4900–$5000 zone.
For this bearish scenario to play out, the SWAP zone on the 12H or daily timeframe must be broken and price must hold below it.
A daily candle closing above the invalidation level would nullify this analysis.
For risk management, please don't forget stop loss and capital management
When we reach the first target, save some profit and then change the stop to entry
Comment if you have any questions
Thank You

ETH LONG OR RANGE?Since we have left the earlier self claimed range on 5H and consolidate above the significant highs and previous swing high, I wonder which scenario we see, if the blue rectangle gets touched by the candles wick and we do not inverse it, its a good bullish scenario, however, if we inverse the marked fvg and get to the inefficiencies below we can expect more of a choppy price action or favored earlier range idea

Range again $ETHDue to typical ETH behavior we can form a range
Can be identified without any lines where I suppose will stay for a month or so consolidating

ETH can be taken entry hereWe can try ETH here
For long and buy an order block is there if price stays above can once again go

AltcoinPioneers | Etherium Daily Analysis Day1BINANCE:ETHUSDT
AltcoinPioneers | Etherium Daily Analysis Day1
👋 Welcome to Altcoin Pioneers Group TRADING ™!
Let’s analyze Etherium. Let’s explore the reason behind it and what Bitcoin’s next move might be.
It features a bearish pennant pattern 🔻, marked with red lines ❌, indicating a potential downward trend 📉.
The price rose initially ⬆️, forming higher highs and lower lows, before a sharp decline ⬇️.
A target price 🎯 is indicated around 4,458.85 USDT 💰, suggesting a possible continuation of the downward movement after the breakout 🚪.
The current price is near this target level 📍.

4300 is an important zone.Ethereum, just like Bitcoin, formed a strong bullish candle after the U.S. interest rate news, but it has completely retraced. It’s now approaching an important support zone, and there’s a possibility that the price could dip lower before making a fake move upward.
