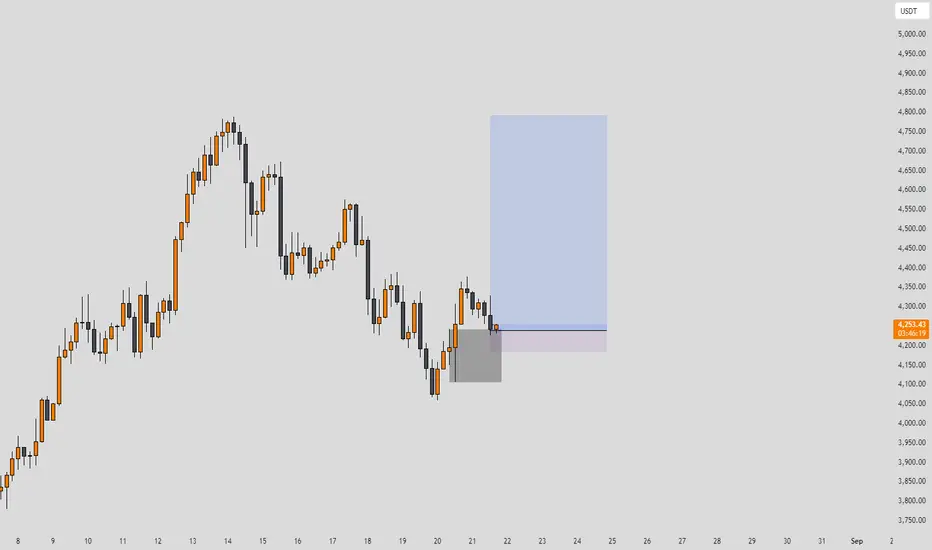
Ethereum's ATH: What's Next?Ethereum recently hit a new all-time high (ATH), but its upward momentum has met a significant resistance level. Based on this technical signal, there is a possibility that the price could pull back and correct to a support range of approximately $4,121 to $3,936.
USDTETH.P trade ideas

Ethereum's ATH: What's Next?Ethereum recently hit a new all-time high (ATH), but its upward momentum has met a significant resistance level. Based on this technical signal, there is a possibility that the price could pull back and correct to a support range of approximately $4,121 to $3,936.

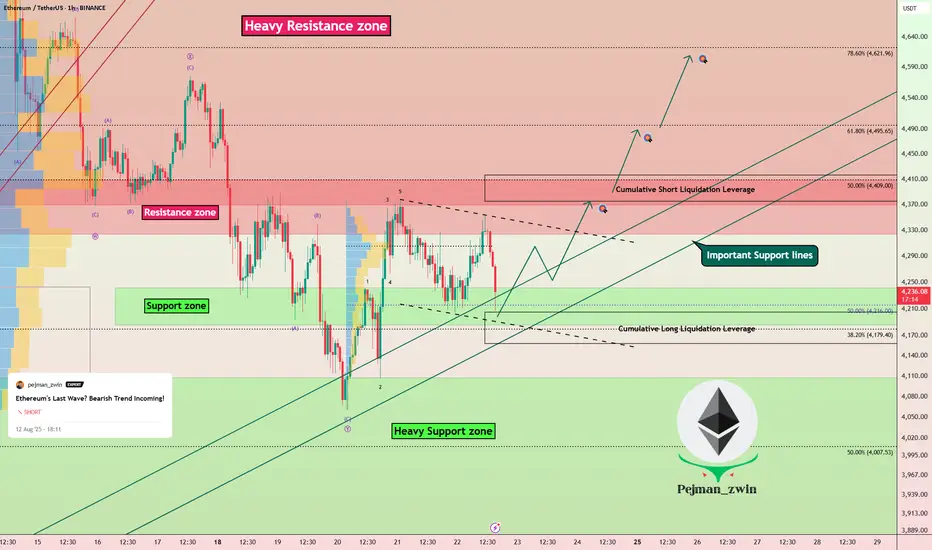
Ethereum Correction Ending? Next Bullish Wave Loading!In the previous idea , I was able to find the Ethereum price top at $4,788 . The question is, has the Ethereum correction begun, or is there still hope for the creation of a new All-Time High(ATH)?
Ethereum ( BINANCE:ETHUSDT ) is currently trading near the Support zone($4,240-$4,186) , Cumulative Long Liquidation Leverage($4,205-$4,158) , and important Support lines .
In terms of Elliott Wave theory , it seems that Ethereum has completed a corrective wave . The corrective wave has a Double Three Correction structure(WXY) . If the Resistance zone($4,410-$4,324) and Cumulative Short Liquidation Leverage($4,416-$4,375) are broken, we can confirm the end of the corrective wave .
I expect Ethereum to start rising from important support lines and rise to at least $4,373 .
Second Target: $4,484
Third Target: $4,607
Stop Loss: $4,097
Note: Today's Fed Chair Powell Speaks can create excitement in financial markets, especially crypto.
Please respect each other's ideas and express them politely if you agree or disagree.
Ethereum Analyze (ETHUSDT), 1-hour time frame.
Be sure to follow the updated ideas.
Do not forget to put a Stop loss for your positions (For every position you want to open).
Please follow your strategy and updates; this is just my Idea, and I will gladly see your ideas in this post.
Please do not forget the ✅' like '✅ button 🙏😊 & Share it with your friends; thanks, and Trade safe.
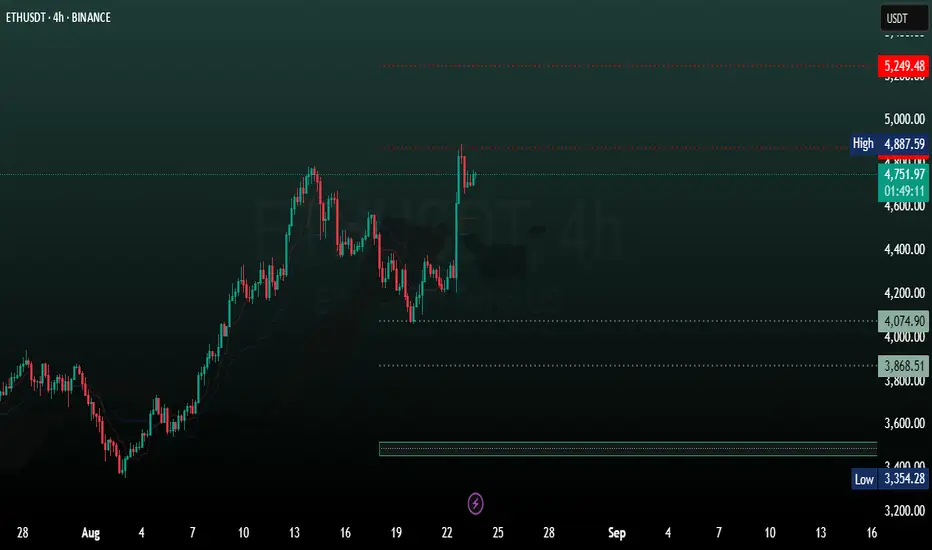
Ethereum 4H AnalysisBased on ichimoku data, the ethereum long-term trend is upward.
we are expecting new ATHs!
Resistence levels:
5249
5773
Support levels:
3500
3118
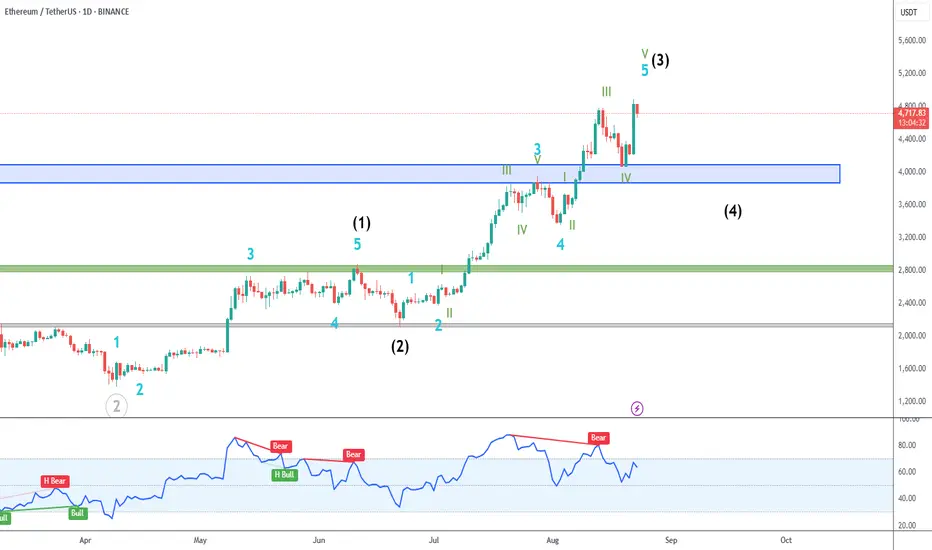
ETH/USDT: Final stages of Wave 3> Wave structure: ETH appears to be completing black wave (3), with signs pointing to an imminent wave (4) corrective move.
> RSI warning: Bearish RSI divergence suggests weakening momentum—typical before a wave (4) pullback.
> Wave (4) target zone: Correction likely into $3,800–$4,000, aligning with previous structure and acting as a potential accumulation zone.
> Strategy: Wait for a pullback into the blue zone to accumulate on weakness, aiming for a breakout toward black wave (5).
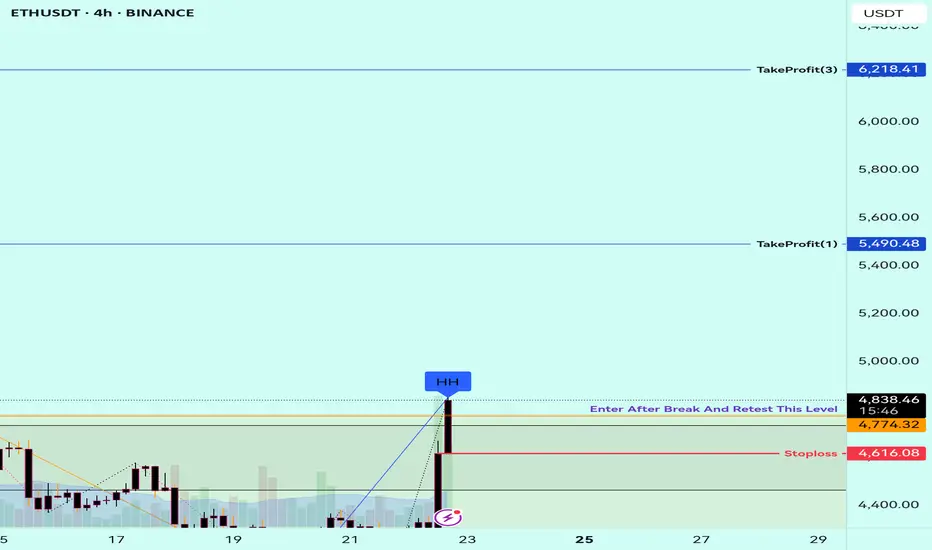
ETHUSDT - 20RR - simple setupETHUSDT - 20RR - simple setup, this il be my last trade setup, i will focus on community and analysis
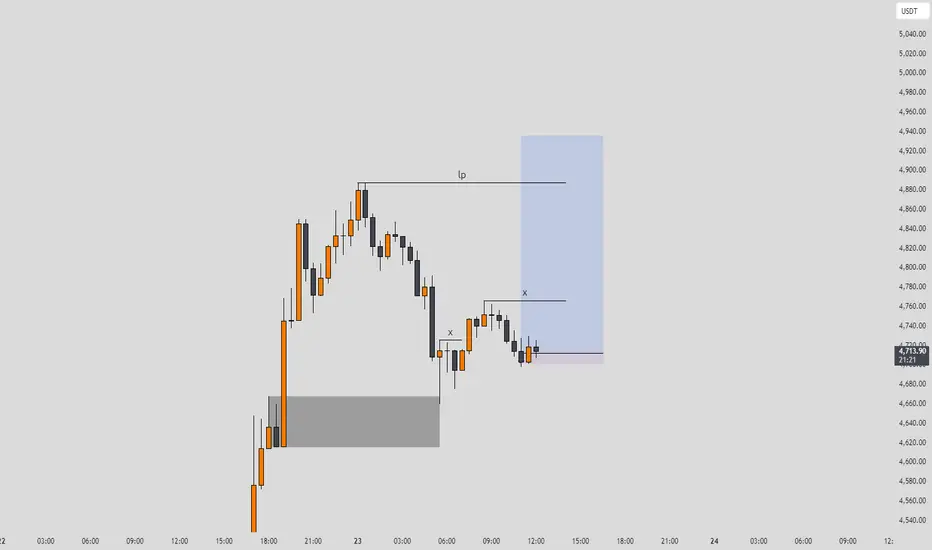
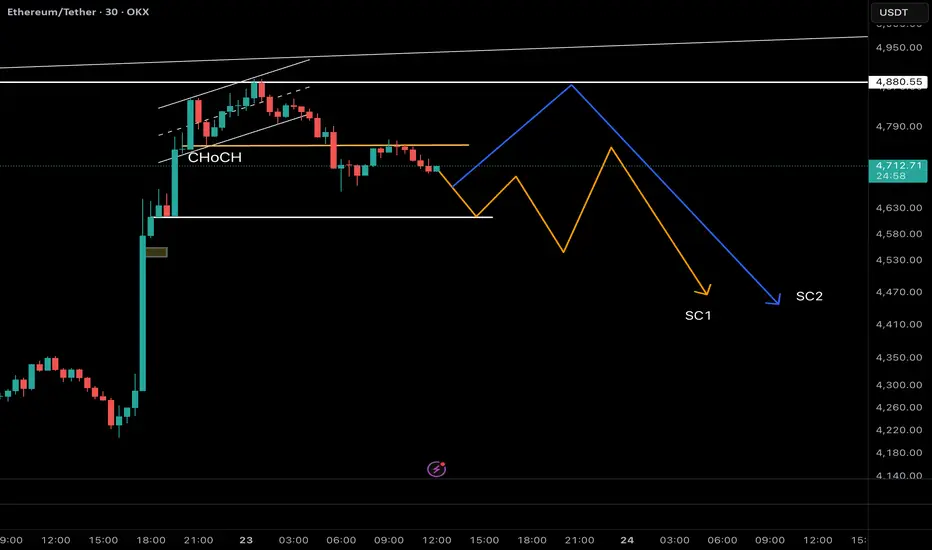
Ethereum Update: CHoCH Confirmed – Waiting for BOS & Wave C! As mentioned in my previous Ethereum analysis, ETH has completed its 5-wave impulsive rally and is currently inside wave B of a corrective ABC structure. Wave B often breaks above the wave ⑤ top to trap liquidity before a sharp wave C sell-off.
📊 Latest Price Action (30m TF):
• ETH has already shown a CHoCH by breaking the first key support at $4,753 and retesting it.
• The next crucial support lies at $4,613. If this level also breaks, it would confirm a BOS (Break of Structure) and strengthen the bearish case.
🔀 Two Possible Scenarios from Here:
1. Price retests the broken $4,753 level as resistance → then resumes the downtrend.
2. A deeper pullback toward $4,845 (acting as a left shoulder liquidity zone) → before the real wave C decline begins.
🎯 Trading Strategy:
• Wait for confirmation of BOS at $4,613.
• Once confirmed, look for bearish entry triggers (CHoCH / MSB) on lower timeframes.
• First targets: $4,100 → $3,800.
• Stop-loss invalidation above the swing high at $4,845 to maintain strict risk control.
⚠️ Remember: patience is key. Don’t get trapped in wave B’s fake breakouts — let the structure confirm wave C.
👉 Like & Follow to stay updated as we track ETH’s potential wave C move step by step!
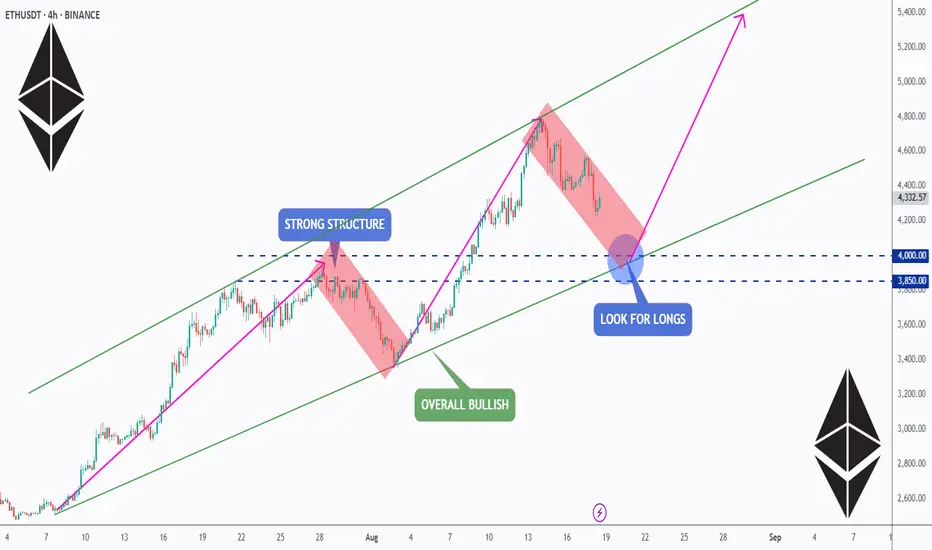
ETH Setup: Retest, Reload & Rally?ETH is pulling back after a strong run , but the bigger picture stays bullish. 📈
The $3,850–$4,000 zone is key — a solid structure + channel support. 🔑
If buyers step in here, we could see the next leg toward $5K and beyond. 🚀
Watching closely… time to retest, reload, and ride the rally? 👀
📚 Always follow your trading plan regarding entry, risk management, and trade management.
Good luck!
All Strategies Are Good; If Managed Properly!
~Richard Nasr
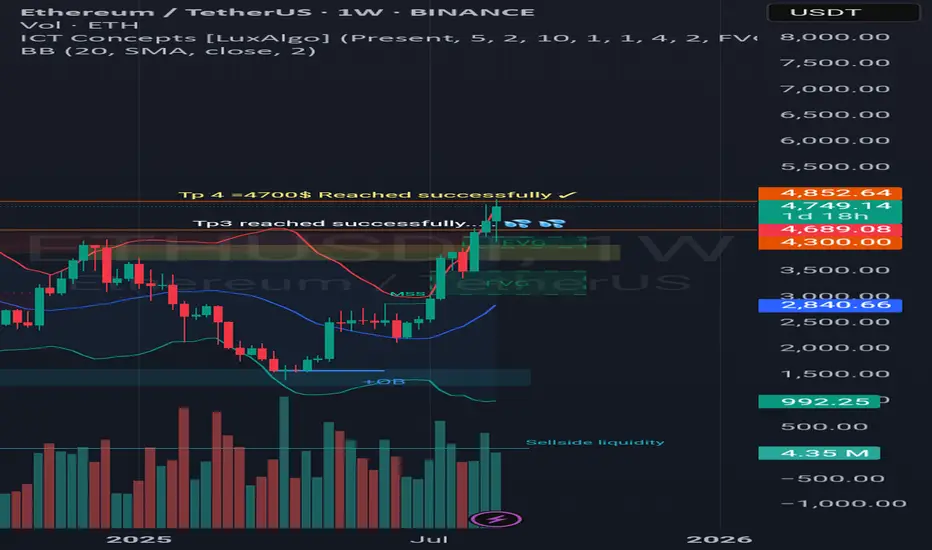
Update of analysis of ETH/USDT Hello sexy friends, ETH very successful filling the tp4 and get to 4700$.
Next TP is over the 10,000$
The goal is coming soon... please wait spring is near ... 💋
ETH 4H👁️This is an untradable zone. Although short positions are possible, it's not advisable to trade bearish pullbacks within an uptrend with strong fundamentals. The 4500 zone seems attractive to me; it's worth monitoring closely to rejoin, gauging mass sentiment and predicting market-makers' moves.

this is how I see $ETH 1D OBV Ethereum 1D OBV break out . How I view the OBV which is a leading indicator. Ethereum to 7k

ETHUSDT - trust your strategy and use risk managment ETHUSDT - trust your strategy and use risk managment , big move are the real deal in trading, be patient
"Ethereum Targeting $5,500 Before Key PCE Data on August 29""Ethereum is likely to reach a new high around $5,500. After that, the market will be waiting for the PCE data on August 29."
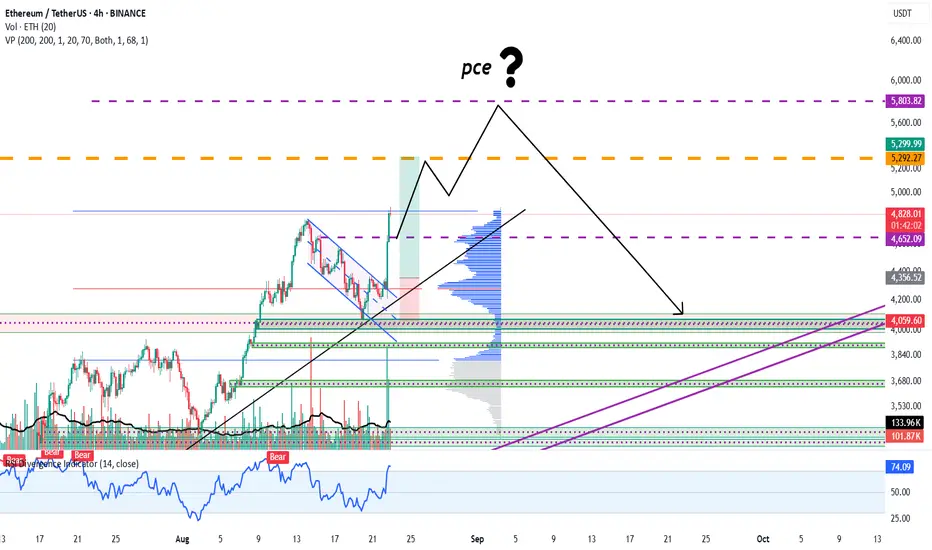
Check for support near 4302.41-4372.72
Hello, traders!
Follow us to get the latest updates quickly.
Have a great day!
-------------------------------------
(BTC.D 1M chart)
For an altcoin bull market to begin, the price must either fall below 55.01 and hold or continue its downward trend.
(USDT.D 1M chart)
I believe that USDT dominance must remain below 4.91 or continue its downward trend for the coin market to continue its upward trend.
The maximum decline in 2025 is expected to be around 2.84-3.42.
After that, the coin market is expected to enter a bear market with an upward trend.
------------------------------------
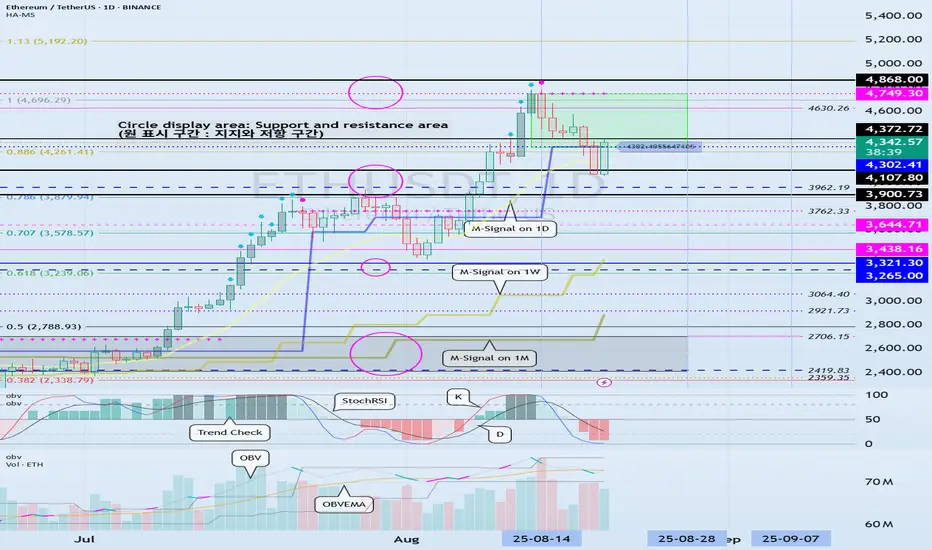
(ETHUSDT 1D chart)
It touched the previous all-time high (ATH) range of 3900.73-4107.80 and is showing an upward trend above 4302.41.
Therefore, we need to check whether it can find support around 4302.41-4372.72.
To continue the step-up trend, it's expected to rise above 4749.30.
-
When a new candlestick is formed, a low trend line is expected to form, consolidating the trend line as shown below.
Therefore, the key question is whether the price can rise along the rising channel after the volatility period around August 28 (August 27-29).
-
The 4302.41-4749.30 range represents a high-boundary zone, requiring a short and quick response when trading.
Therefore, if the price finds support near 4302.41 and rises, it would be wise to develop a trading strategy based on the assumption that the first sell-off will occur around 4749.30.
For the uptrend to continue, rising above 4749.30,
- the StochRSI indicator must remain upward with K > D,
- the OBV must rise above the High Line and remain upward,
- the TC (Trend Check) indicator must remain upward. (Preferably, it should show an upward trend above 0.)
If the above conditions are met, I believe the uptrend is likely to continue.
-
If the price falls below 4302.41,
1st: 3900.73-4107.80
2nd: M-Signal on the 1W chart
We need to check for support near the 1st and 2nd levels above.
-
The basic trading strategy is to buy in the HA-Low ~ DOM (-60) range and sell in the HA-High ~ DOM (60) range.
However, if the price rises from the HA-High to DOM(60) range, it is likely to exhibit a step-like upward trend, while if it falls from the HA-Low to DOM(-60) range, it is likely to exhibit a step-like downward trend.
Therefore, the basic trading strategy should be a segmented trading strategy.
If you purchase a new position because the price appears to be supporting the HA-High to DOM(60) range, you should execute the trade quickly and with short-term responses.
Otherwise, if the price falls below the HA-High indicator, it is likely to decline until it meets the HA-Low or DOM(-60) indicator.
-
Thank you for reading to the end.
I wish you successful trading.
--------------------------------------------------
- This is an explanation of the big picture.
(3-year bull market, 1-year bear market pattern)
I will explain in more detail when the bear market begins.
------------------------------------------------------
Ethereum Elliott Wave Analysis: The Bull Trap Before Wave C!As mentioned in my previous two analyses, Ethereum rejected the $4,740 high and dropped to the $4,050 support zone, where it bounced exactly as projected.
From an Elliott Wave perspective, ETH has already completed a 5-wave impulsive structure and is now inside a corrective ABC phase. At the moment, price action is developing within wave B. Historically, wave B has the tendency to break above the top of wave ⑤, creating a bull trap and sweeping liquidity before the real wave C sell-off begins.
📉 What does this mean for traders?
Wave C is usually sharp, aggressive, and offers great risk-to-reward opportunities on the short side. But instead of rushing into shorts, the smart play is to wait for confirmation.
🎯 Trading Strategy:
1. Allow wave B to complete – watch for a liquidity grab above the $4,840–$4,800 zone.
2. Look for a CHoCH (Change of Character) / market structure break on lower timeframes (4H / 1H) as your entry trigger.
3. Enter short after confirmation, targeting the $4,100 → $3,800 zones first, with potential extension lower depending on momentum of wave C.
4. Place invalidation above the recent swing high to keep risk controlled.
⚡ This is a high-probability short setup forming, but patience and timing are crucial — don’t get trapped in wave B’s fake breakout.
👉 Follow for updates as we track the confirmation of wave C and refine the short targets!

Ethereum (ETHUSD) – Technical Outlook with Key FundamentalsDescription:
Ethereum (ETH) is the second-largest cryptocurrency by market capitalization and a leading blockchain for decentralized applications, smart contracts, and DeFi ecosystems. Its network is continuously evolving, with Ethereum 2.0 upgrades focusing on scalability, security, and sustainability. Market participants often view ETH not only as a digital asset but also as a fundamental infrastructure for the Web3 economy.
This analysis highlights potential technical levels and market structure for ETH. Traders are closely monitoring price action to assess possible continuation or reversal scenarios, taking into account both short-term momentum and broader market conditions.
⚠️ Disclaimer:
This content is for educational and informational purposes only. It does not represent financial advice or investment recommendations. Always conduct your own research and risk management before making trading decisions.
ETH - 4H Elliott Wave Analysis - 22.08.25Greetings ^^
We did get our rally from the support area that we had on the chart.
We assume that high of the 14th of August formed the top of the white Wave 3 and that we are currently in a correction displayed as yellow ABC which would form the white Wave 4.
The support area of this Wave 4 is between the 0.236 FIB at 4059 USD and the 0.5 FIB at 3370 USD. The Wave A is in and today's rally is the B Wave which we thermalized in yesterdays analysis and did expect it to be strong. We assume this ABC is an expanding flat which means the B Wave overshoots which it did. It touched the 1.05 FIB at 4833 USD which is a common target but it also is right below the ATH. Further targets for the B Wave would be the 1.236 FIB at 4985 USD and the 1.382 FIB at 5105 USD.
Next we would look for a Wave C to the downside.
The targets for this C Wave are the 0.618 FIB at 4375 USD the 1 to 1 FIB at 4106 USD, the 1.236 FIB at 3947 USD, the 1.382 FIB at 3853 USD and the 1.618 FIB at 3705 USD. A lot of targets, the most common is the 0.618 and the 1.618 FIB. The 1.618 FIB would also be in confluence with the 0.382 FIB of the Wave 4 support area which is the optimal target for a Wave 4.
Alternatively you can count the recent low as blue Wave 4 instead yellow A Wave and the move up today could potentially be the blue Wave 5 which would than finished white Wave 3. We do think the count mentioned above is more likely as the yellow A touched the 0.236 FIB of the white Wave 4 support area which is a common target for an A Wave and additionally the structure of today's rally look more corrective on the smaller timeframes. Overall it does not make a big difference for the moment except that in the blue Wave 5 we could go a bit higher compared to the overshooting B Wave.
Thanks for reading.
NO FINANCIAL ADVICE.

Ethereum Hits a New All-Time High · $5790 Next Followed by $8513Ether is now on a path to a new all-time high and this week is hyper-bullish, as bullish as it gets.
Notice the lower wick on the current session; the week started negative and as it reaches its end, it turns positive. The action is happening at the top of the candle and this means we will see green Saturday, Sunday and for months to come.
The lack of bearish strength on the last retrace shows that sellers are simply not present.
The strong advance today and marketwide bullish action reveals a huge demand for crypto, so strong, that prices can only grow.
Ethereum (ETHUSDT) is now set to hit a new all-time high but that's not all. As I explained in a previous publication, the all-time high is not a major resistance level, it will break easily. This means that Ether will continue growing with the first target being $5,790 on the current move. $8,513 is also a high probability target later this year. We might go even higher.
The bullish bias is now fully confirmed. Ether is going up.
The cryptocurrency market will continue growing. The altcoins market will continue to heat up. This is only the start.
Namaste.

ETH Shatters Downtrend with Explosive Breakout | Bulls Take FulChart: ETHUSDT, 1H
Bias: Bullish
Analysis:
Hello, traders! We are witnessing a dramatic and powerful shift in the ETHUSDT market structure that warrants immediate attention.
The Previous Bearish Context:
For several days, Ethereum has been trading within a well-defined bearish channel. This downtrend was characterized by:
A clear descending trendline that has been respected with multiple touches, acting as dynamic resistance.
A series of confirmed lower lows and lower highs, with multiple breaks of structure to the downside (indicated by the "Strong" lows being broken).
Overall seller dominance, pushing the price down from the $4,788 high to a low of around $4,042.
The Bullish Takeover (The Main Event):
The narrative has completely changed in the last few hours. A massive wave of buying pressure has resulted in an explosive move to the upside. The key developments are:
Decisive Trendline Break: A very strong, high-momentum bullish candle has completely shattered the long-standing descending trendline. This is the most significant bullish signal on this chart, indicating the previous downtrend is now invalidated.
Break of Market Structure: This upward thrust has also broken through several previous resistance levels, including the swing high around $4,400. This constitutes a major Change of Character (CHoCH) and confirms a shift in control from sellers to buyers.
Potential Scenarios & Key Levels:
Bullish Continuation (Primary Scenario): With such strong momentum, the path of least resistance is now to the upside. Traders might look for long opportunities.
Potential Entry: A textbook entry would be on a successful retest of the broken trendline or the recently broken resistance level around $4,400, which should now act as support.
TP 1: The previous major high at $4,788 (the '1' on the Fibonacci scale).
TP 2: The next major area of resistance, identified by the indicator as the "Perfect Sell Zone 1", starting around $4,880.
Invalidation Scenario: While the breakout looks powerful, traders must always manage risk. The bullish thesis would be invalidated if the price were to reverse, fall back below the broken trendline, and close decisively below the $4,300 support area. This would suggest the breakout was a bull trap.
Conclusion:
The evidence on the chart is overwhelmingly bullish in the short to medium term. The break of the multi-day trendline is a significant technical event that cannot be ignored. The immediate bias has shifted firmly in favor of the bulls. The key will be to watch for a potential pullback for entry opportunities and to see how the price reacts as it approaches the next major supply zone around $4,900.
Disclaimer: This is not financial advice. This is for educational purposes only. Always do your own research (DYOR) before entering any trade.

ETH Swing Long Opportunity ETH Daily Recap & Game Plan – 20.08.2025
📊 Market Sentiment
Overall sentiment remains bullish, supported by expectations of a 0.25% rate cut in the upcoming FOMC meeting. A weakening USD and increasing global risk appetite are creating favorable conditions for further upside in crypto assets.
📈 Technical Analysis
Price has been climbing in recent weeks, and we are currently in a retracement phase along with global markets (NQ and ES).
Price tapped into an untapped swing high, which is a strong zone I’m watching for reactions.
Additionally, price reached the equilibrium level of the Fibonacci (0.5), which places it in discount territory for me.
📌 Setup Trigger
The setup has already been triggered for me.
A 1H demand zone formed right after the EQ level was tested, so I entered the trade.
📋 Trade Management
Stoploss: 4035$
Targets:
TP1: 4279$
TP2: 4672$
TP3: 4888$ (ATH)
💬 Like, follow, and comment if you find this setup valuable!
⚠️ Disclaimer: This content is for informational and educational purposes only and does not constitute financial, investment, or trading advice. Always do your own research before making any financial decisions.

ETH - Ranges overviewWe’ve finally broken through 4K on ETH and we are currently trading around new highs.
From here let’s see how we play out.
IF we break through 5K and hold expect us to continue higher towards new all time highs at 6K and higher - on the longer term.
IF we fail to hold the “support” (sellside liquidity) around 4K-3.5K expect us to trade back lower.
As always when in new highs territories…do not BECOME A VICTIM OF EUPHORIA.
Position yourself and be PATIENT. THE MARKET WILL SHOW YOU ITS HAND.
Stay safe and never risk more than 1-5% of your capital per trade. The following analysis is merely a price action based analysis and does not constitute financial advice in any form.

ETHUSDT.PLets see if price repeat the previous pattern.
As fas as i expect the price is trying to make an inverse head and shoulder pattern..
But we should always wait for our entry level.
As soon the price reaches at our level we should wait for the confirmation signal. Which can be bullish patterns with strong volume..
Lets see how it plays..
Keep following guys for more analysis..
Thanks

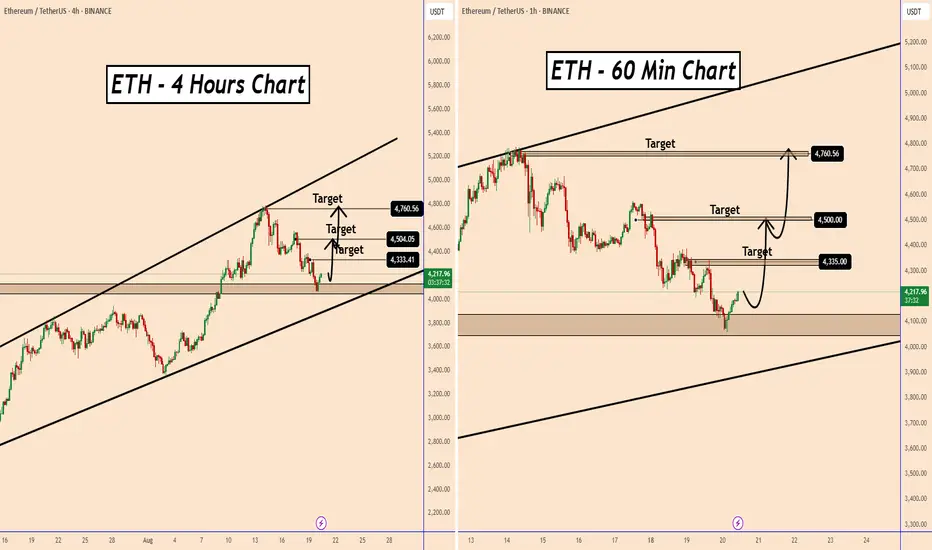
Ethereum Technical OutlookEthereum Technical Outlook
Ethereum remains in a well-defined bullish trend and is currently hovering near the lower boundary of its ascending support zone.
The $4000–$4050 area also aligns with a key structural level from previous price action, increasing the probability of a renewed upward move.
However, short-term sentiment may be influenced by speculation around Powell’s remarks, either in the FOMC minutes or during tomorrow’s Jackson Hole Symposium.
Key Resistance Levels to Watch:
$4335
$4500
$4760
A break above these levels could confirm continuation, while any hawkish tone from the Fed may temporarily weigh on momentum.
You may find more details in the chart!
Thank you and Good Luck!
PS: Please support with a like or comment if you find this analysis useful for your trading day