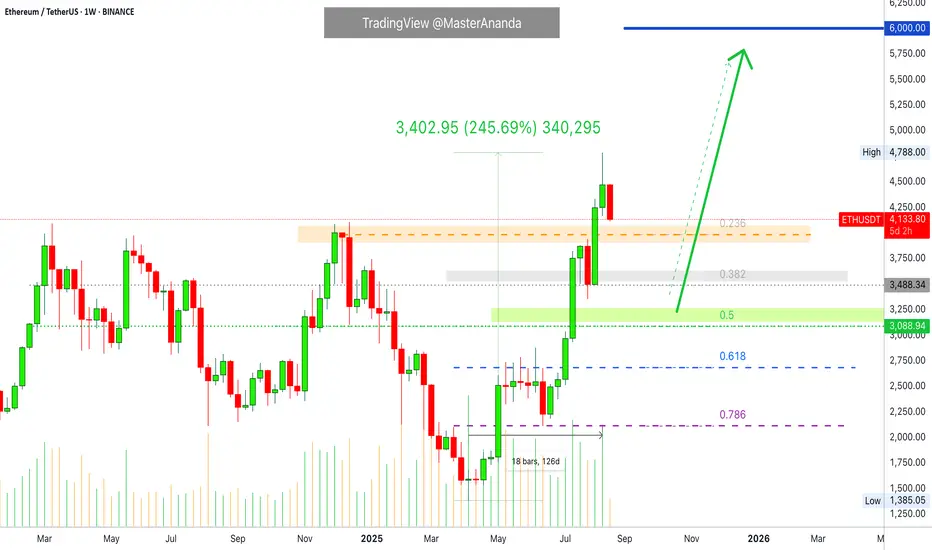
Ethereum: What About Support? $3,000 Next? Watch!Ethereum grew a massive 245% from its 7-April 2025 low and market bottom. The last low pre-2025 bull market. And we are here and this chart is awesome because there is no doubt where we are in this market cycle. We know the market is experiencing growth, Ether is growing, and we know this is only the start.
After strong growth, there is always a correction.
The market tends to seek balance.
ETHUSDT growing straight up for 126 days, four months. 245% total rise.
Where are the support levels?
A strong rise within a bull market is followed by: a mild correction or a strong correction? A long-term multiple months long correction or a two weeks long correction?
Let me help you answer those questions.
Four months will never allow for a correction lasting 3-4 months. This is out of the question. Normally a correction deletes only a portion of the previous move and it tends to last a portion of the previous move.
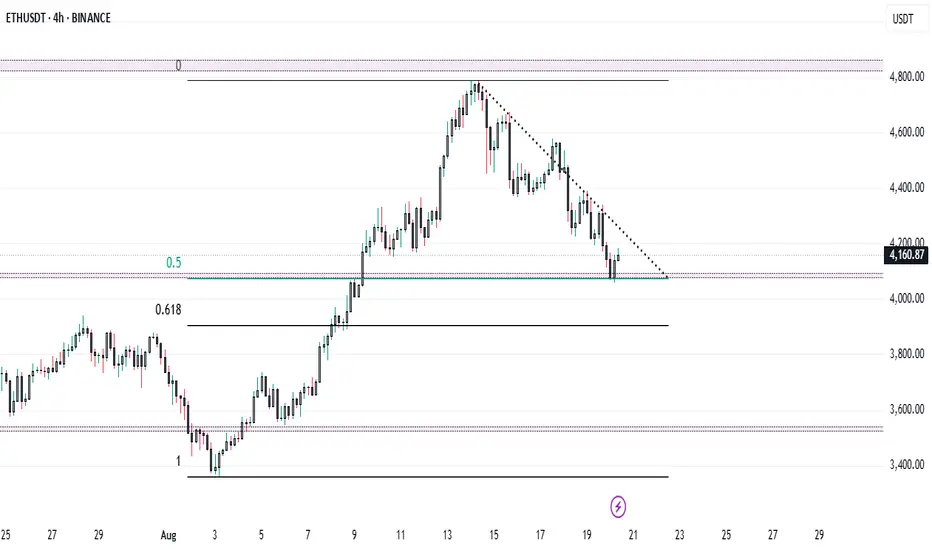
The equivalent to 0.618 and 0.786 was already consolidated back in May and June. This means that this level does not need to be tested or if it is tested, in an extreme case, then it is likely to hold. Why? Because Ether stopped at this point for more than a month creating a baseline.
The 0.236 Fib. retracement, around $3,900, was not consolidated so this level goes bust as support, on the first try. There wasn't any action around this level on the way up, there won't be any on the way down. So we know Ether to move lower on this drop.
The next level is 0.382 Fib. and this is a strong level. Retraces and corrections within a bull market can easily end here. This is a price of $3,485. There is support around this level as it was consolidated for two weeks before the last high. This level has potential to hold because Ethereum is very strong right now and this zone is below the March, May and December 2024 peaks.
The last level is the 0.5 Fib. retracement. This is another strong support and it tends to stop corrections on its track on a strong bull market. This level can be easily tested. If it is tested, the action isn't likely to last long at these low pries. We are talking about $3,100.
Again, the range between $2,100 and $2,700 is the 0.786-0.618 Fib. retracement and this is a dream buy zone right now and very unlikely that such an opportunity will open up. If it does open, this time, will you buy? Buy when prices are low. Sell at resistance, buy at support.
Ethereum is going down. It is still too early to say how long this correction will go for. Just keep in mind that a retrace can last 1-3 weeks while a correction can last 1-3 months. Both scenarios are possible. Regardless of what the market decides, the bull market is not over, we will see additional growth.
Ethereum will continue growing to hit a new all-time high and beyond.
Namaste.
USDTETH.P trade ideas
ETHUSDTETH has risen again.
Let's go to 5K for the first target and then 5700 and 6K next.
See you there !

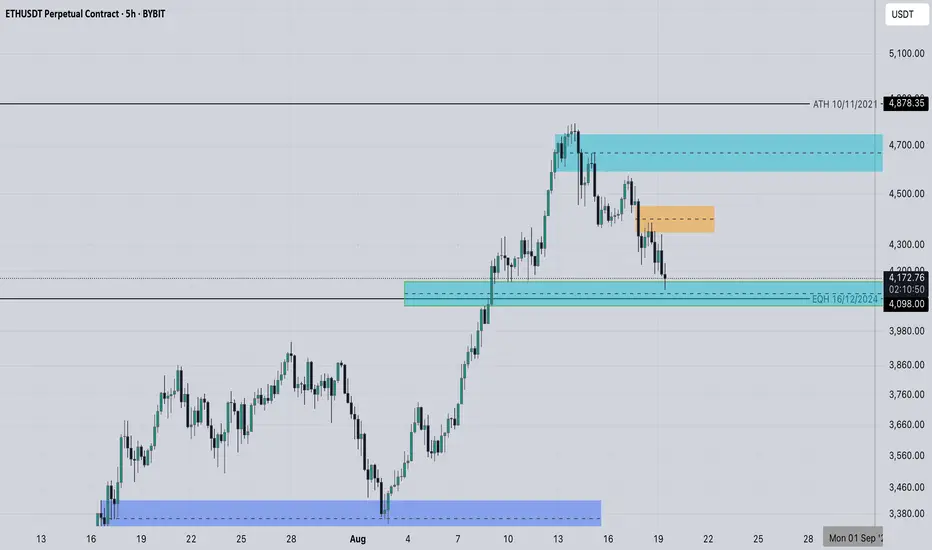
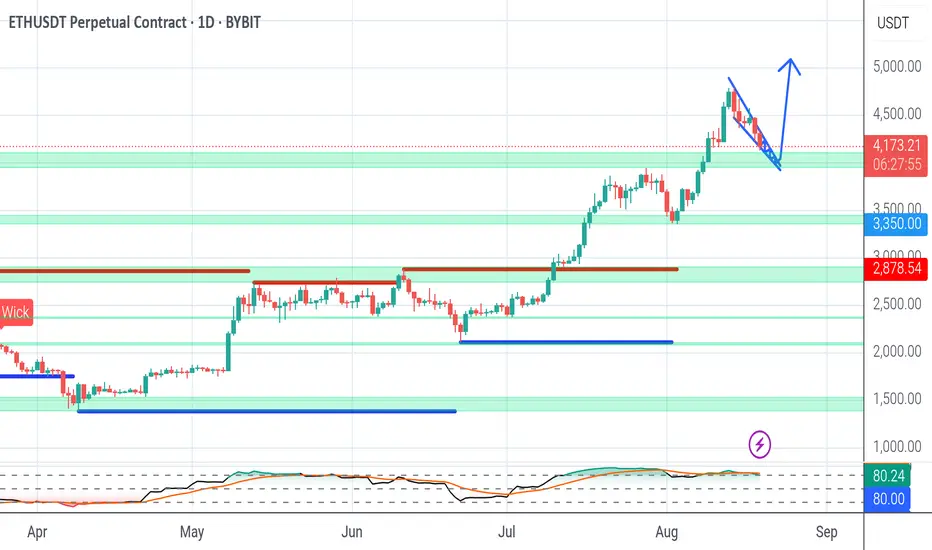
Quick Update for EthereumYesterday, Ethereum broke the local low, pierced the second support level, and reacted from the moving averages.
At the moment, we can draw a new descending local trendline — if it breaks, I expect a move up toward 4,400 .
If the second support level breaks, we could see a drop toward 3,854 .

Ethereum will retest the 4100 level ┆ HolderStatBINANCE:ETHUSDT retesting $4,100 support after recent highs above $4,600. Structure shows strong bullish continuation if buyers hold this zone, with targets at $4,600 and $5,000. Breakdown risks pullback to $3,800–$3,600.
#ETH — A Trade Executed to the EndOn July 29, the indicator on the 1H timeframe triggered a long signal for Ethereum around the $3800 level. At that moment, many traders doubted the strength of the trend as the market moved sideways. Nevertheless, the algorithm identified the optimal entry point and opened the position.
From that day forward, the indicator systematically guided the trade, adjusting support levels and highlighting partial take-profit zones. The move developed steadily, and on August 14 the position was finally closed near $4500.
The trade delivered approximately +18% profit over two weeks of holding. This result demonstrates not only the accuracy of the signal but also the algorithm’s ability to keep a position open until the trend’s potential is fully realized.
This example highlights the key advantage of the indicator: it removes emotions and allows traders to follow a structured system. In a market where uncertainty often misleads even experienced participants, a disciplined algorithmic approach makes it possible to extract maximum value from price movements.

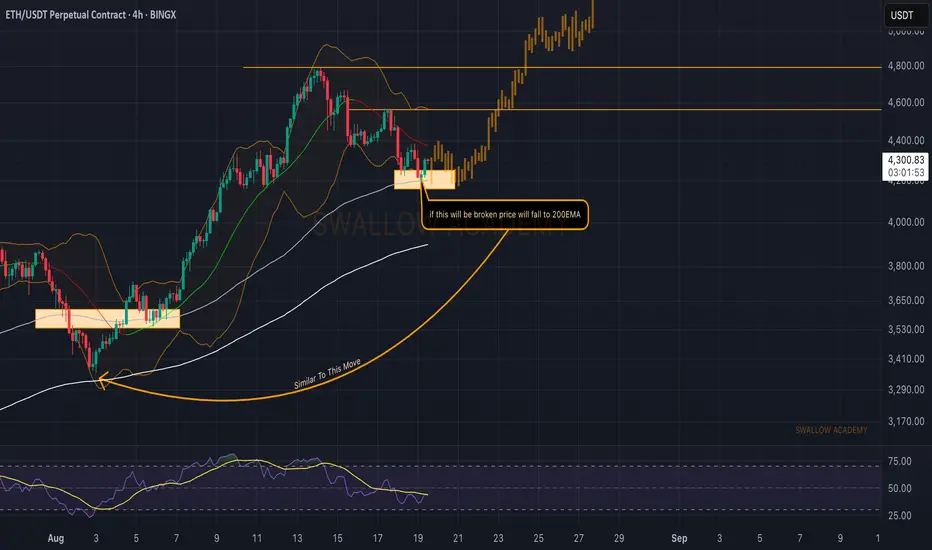
Ethereum (ETH): Buy Zone Between 100-200EMAETH still struggles inside the EMAs, where we are looking for any signs of MSB to form in this region. Currently, the 100 EMA is being retested once again, whereupon seeing a breakout and buyside dominance above it, we might be getting a good buy entry right there.
The overall plan is simple: we want to see a major bounce happen in the zones of EMAs, which would lead the price to a new ATH.
Swallow Academy

ETH RangeActually the same idea as before may be some upward distribution range, or just the consolidation at the highlighted range, if we break below the lower boundary where the fvg is marked, we quite possibly can return to the lower price range
ETH Swing Long with High RRHTF Swing Long Idea with a high RR and tight invalidation which might play out in the next few days, if we see a slightly deeper correction on BTC (c. 109k), or later on down the road.
Confluence around 3.8k with 0.705 FIB (3,777), 3D Breaker Block, and two upward sloping trend lines. There is additional timing confluence for Sunday - which for the past 4 weeks has been a Strong Buy, especially Asia Morning session (GMT +8).
Entry: 3,794
SL: 3,720 (-1.95%)
TP1: 4,788 (+28%)
TP2: 7,400 (+95%)
A deeper / longer BTC correction invalidates.

Our analysis turned out correctThe analysis we gave about the price reaching 4000 has played out. However, in my view, a buy position hasn’t been triggered yet since the trend is still clearly bearish, and we need strong confirmations before buying. That said, there’s also a high chance the trend could reverse sharply, and we might miss the move. In that case, there are two options: either enter with lower risk or, if we miss it, avoid FOMO.

Ethereum actionI would believe that... we took liquidity from August 11.8... right at Monday's low... and I think we're going for 5k +... but I'll be careful at 5k because it's such a psychological price... watch out for that.
good luck my people

ETH at $4,100 – Can Bulls Defend Key Support Before FOMC..?ETH + FOMC = Volatility Ahead ? 🔥
Ethereum at Make-or-Break Zone: $4,100 Support in Focus!
Ethereum (ETH/USDT) on the 4H timeframe is showing a decisive battle between bulls and bears. After topping near $4,700, ETH has been in a steady downtrend, respecting the descending trendline.
🔑 Key Levels to Watch
* Immediate Support: $4,100 – $4,150 (0.5 Fib retracement)
* Major Support: $3,950 – $4,000 (0.618 Fib retracement)
* Resistance Zone: $4,300 – $4,350 (descending trendline)
* Major Resistance: $4,600 – $4,700 (recent swing high)
📈 Bullish Scenario
✅ A breakout above $4,300 trendline resistance could trigger strong momentum toward $4,500 - $4,600.
✅ Holding $4,100 support will keep buyers in control.
📉 Bearish Scenario
❌ If ETH fails to hold $4,100, expect a deeper retracement toward $4,000 (0.618 Fib).
❌ A break below $3,950 may extend the fall to $3,700 – $3,600.
⚠️ Market Note
📌 Today’s FOMC meeting could heavily impact the crypto market trend.
Expect volatility as Fed commentary on interest rates may guide ETH’s next major move.
⚖️ Conclusion
ETH is at a critical support zone where the next move will define short-term direction.
* Above $4,300 → Bulls regain control.
* Below $4,100 → Bears target $4,000 and lower.
ETH - Gives you another chanceETH ~ 3946 good for the last move to 4950 i shall say this is a good place for DCA!

ETH short from 4300 → Targeting 4070 (Let’s see what’s next…)Shorted ETH right at 4300 – looking down to 4070.
For now, let’s ride this leg down and see what the market wants to show us next.
The upcoming news on Thursday & Friday could easily decide the next chapter of this move.
Until then, I’m staying patient, sharp, and two steps ahead – as always.
Remember: the market loves to test emotions… I just love testing the market. 😉
— Alpha Sigma Wolf
#btc #crypto #eth #bitcoin #ethereium #ethusdt #ict #trade


Our analysis was correct.As we mentioned in previous analyses, the price reached 4100, and there’s also a possibility of it dropping to 4000. These zones present a good buying opportunity, but during this pullback, you should be cautious and only enter positions with confirmation and a valid trigger.

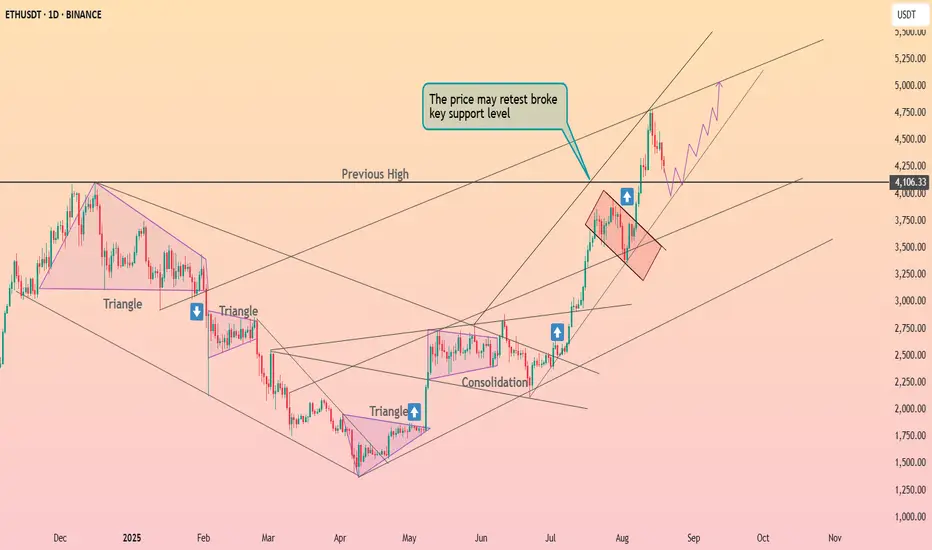
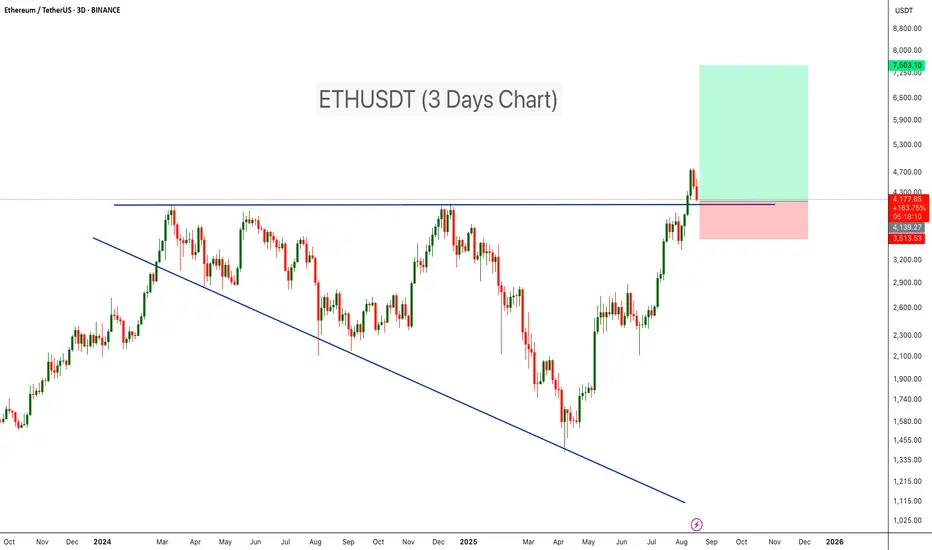
Ethereum Retesting Major Breakout ZoneBINANCE:ETHUSDT has completed a major breakout from a Broadening Wedge Pattern and is now retesting the wedge’s resistance line as support — a bullish continuation signal on the higher timeframe.
- Broadening Wedge Formation: ETH traded within a large broadening wedge throughout 2024 into early 2025, forming expanding highs and lows.
- Breakout Confirmation: The breakout above wedge resistance ($4,10) confirms bullish momentum and shifts market structure in favor of buyers.
-Retest in Progress: Price is currently pulling back, testing the former wedge resistance as fresh support — a textbook technical setup.
-Volume Validation: The breakout was accompanied by a surge in volume, strengthening the case for continuation.
🔷Entry Zone: $4,100 – $4,300
🔷Stop Loss: Below $3,500 to protect against a failed retest.
🔷Targets: $6,500 – $7,500
Cheers
Hexa
ETH daily chart possible scenarioLooks like we heading towards 3900 strong support zone in coming days and bounce toward new ATH 5k+ in couple weeks. Any thoughts?
Is it time to buy Ethereum📉 Since I said Ethereum is in a pullback, price has dropped ~7%.
I’m not a fortune teller — I just understand market logic.
The million-dollar question:
🚀 Is it time to buy Ethereum?
⏳ Not yet… stay tuned & follow for the signal.
م

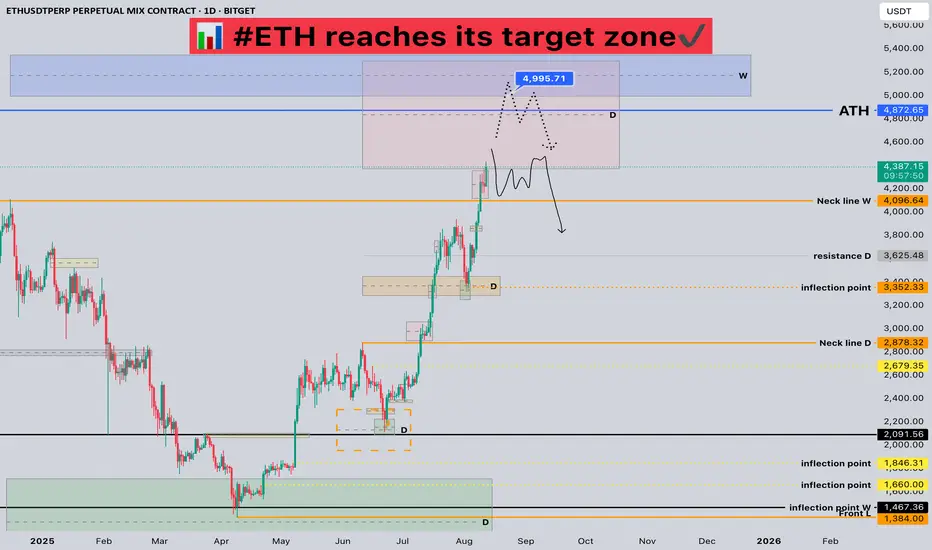
#ETH reaches its target zone📊 #ETH reaches its target zone✔️
🧠From a structural perspective, we've reached the daily bullish target zone, so we need to be wary of the risk of a pullback.
➡️Chasing the gains within the red resistance zone is not recommended, as the expectation of a daily pullback is very strong.
➡️If you want to participate in a short trade, you need to patiently wait for a bearish structure of the same cycle to emerge, or look for shorting opportunities near the overlapping resistance zone around 5000.
🤜If you like my analysis, please like 💖 and share 💬
BITGET:ETHUSDT.P
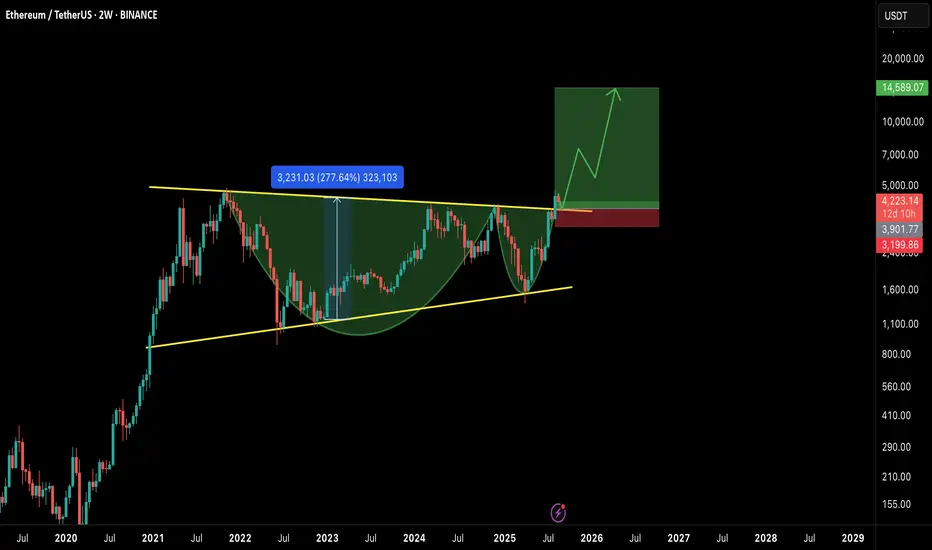
ETH/USDT – Mega Breakout on Higher Timeframe!Ethereum has confirmed a massive breakout on the 2W timeframe, breaking through a multi-year cup & handle and also ascending triangle formation. This is one of the strongest bullish continuation patterns and could fuel ETH into a new long-term rally. 🚀
📊 Chart Analysis
Pattern: Cup & Handle on the 2W chart.
Breakout Zone: Around $4,000–$4,300, now acting as support.
Measured Move Target: ~$14,500 (based on cup depth).
Stop Loss Zone: ~$3,200 (below major support).
✅ Bullish Factors
Multi-Year Accumulation: ETH has spent years consolidating below $4K, and this breakout confirms strength.
High R:R Setup: Risk is limited while the potential upside is ~3x from current levels.
Market Cycle Timing: BTC dominance topping out + potential altseason rotation favors ETH’s outperformance.
Strong Structure: Break above resistance aligns with long-term moving averages flipping bullish.
⚠️ Risk Factors
Macro events (FOMC, inflation data) could cause temporary retracements.
A weekly close back below $4K would invalidate the breakout.
BTC volatility may suppress ETH in the short term before altseason kicks in.
🎯 Targets
TP1: $6,500
TP2: $9,500
TP3: $14,500 (full measured move target)
📌 Conclusion
ETH is showing one of the strongest technical breakouts in years. If $4K+ holds as support, the path to new ATHs and beyond looks wide open. This setup could define the next phase of the bull market.
Bulls are in control — it’s ETH’s time to shine. 🌟
🔔 What’s your target for ETH in this cycle? $10K or higher? Let me know in the comments
Take Profit in Trading: How Profit Levels WorkIn trading, profit isn’t secured when you “guess” the market direction — it’s secured when you already know where to close your trade. For this purpose, traders use a tool called Take Profit (TP).
What is Take Profit?
Take Profit is a pre-set price level at which your position automatically closes with profit. In essence, it’s the opposite of a stop-loss, which protects against loss. A TP removes the need to constantly monitor charts and ensures you capture profit exactly where you planned.
Example: A trader enters a long position on BTC at $114,000 and sets a TP at $118,000. Once the price touches that level, the trade closes automatically and profit is secured.
Why Do We Need Take Profit Levels?
The key role of TP is discipline. Without clear targets, traders risk closing trades too early or waiting too long until the market reverses. Take Profit levels help to:
lock in profit step by step,
avoid emotional decision-making,
move stop-loss to breakeven after reaching the first target.
Take Profit Levels (TP1, TP2, TP3, TP4)
In professional trading, as well as with CV_Pro, multiple TP levels are often used:
TP1 — the first target. Partial profit is taken, and stop-loss is moved to breakeven.
TP2 — confirms trend strength and allows further profit-taking.
TP3 and TP4 — extended goals for strong trend moves, when the market offers maximum potential.
This approach is called partial profit-taking. Instead of waiting for the “perfect” level, traders secure profits gradually. This reduces risk and increases consistency.
Take Profit and Trade Management
Working with TP is always a balance between greed and discipline. If the market moves in your favor, TP helps you capture more from the trend, and if the market reverses, you already leave with gains. Remember: it’s better to take profits according to plan than to wait and lose the entire move.
Conclusion
Take Profit is the foundation of professional trading. It turns random entries into a structured strategy. By using TP levels, a trader gains not only profit but also confidence that their trading is controlled and systematic.
ETHUSDT broke all major resistances ---> retest ---> PumpPrice on weekly chart broke our first target which was near 3800$ and also broke 4K$ resistances and now above 4K$ market is still extremely bullish and we can look for targets like 5K$ and 7K$.
Notice: only and only if the price dump below 4K$ market is a little range or bearish so for now we are still on bullrun.
DISCLAIMER: ((trade based on your own decision))
<<press like👍 if you enjoy💚

Ethereum (ETH): Getting Ready For Another Push | Moving AveragesOur attentions are fully on the EMAs currently, where ETH has reached the 100 EMA zone (which is also the lower zone of Bollinger Bands), giving us a solid support zone right there.
That said, we are looking for some sort of MSB to form from here, which should open for us an opportunity for a long or if we fail to get one, then our attentions shift to 200 EMA, where we will be expecting a similar thing.
Swallow Academy