Ethereum New Update (12H)On the chart, we have a bearish CH and a resistance SWAP zone has formed. This SWAP zone has been broken downward, and now on the pullback to this area, we can look for sell/short positions. As long as the price does not reclaim and hold above this zone, the bearish outlook on Ethereum remains valid
If the price strongly breaks TP1 to the downside, a much deeper drop may occur
A daily candle closing above the invalidation level would invalidate this analysis
For risk management, please don't forget stop loss and capital management
When we reach the first target, save some profit and then change the stop to entry
Comment if you have any questions
Thank You
USDTETH.P trade ideas

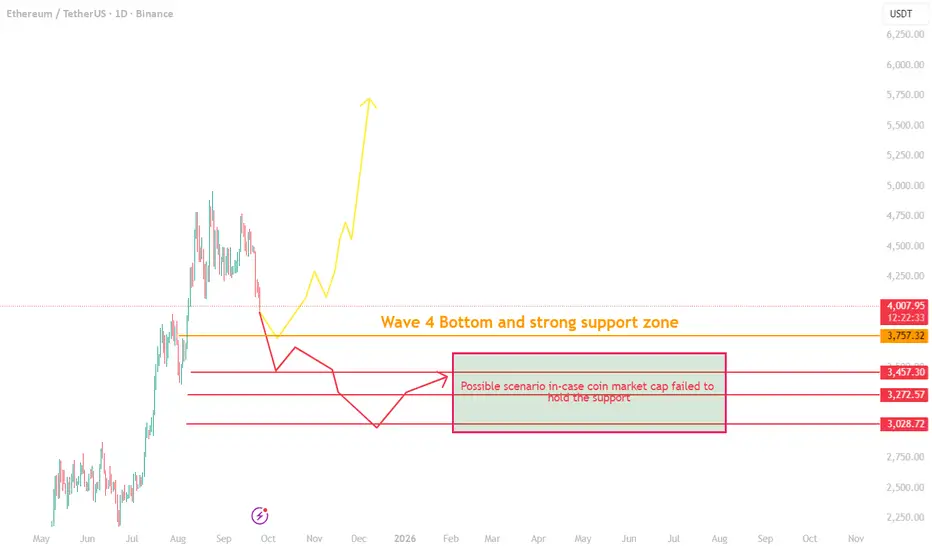
ETH Crash or Bounce? The Critical Level Everyone Is WatchingEthereum (ETH/USDT) – Critical Support Test Ahead
Ethereum is currently under pressure after breaking below the $4,000 support. The next significant level to watch is the $3,760 zone, which is not only a strong technical support but also aligns with the Elliott Wave 4 bottom as well as a key Fibonacci retracement area.
Key Scenarios
1. Bullish Recovery (Primary Expectation)
If ETH holds above the $3,760 support, we can expect consolidation in the range of $4,000 – $4,350.
This zone is likely to act as a base for Ethereum until broader market conditions stabilize.
Once momentum returns, ETH has the potential to resume its upward trend.
2. Bearish Breakdown
If ETH fails to defend $3,760, then deeper downside levels may come into play:
$3,450
$3,270
$3,000
This would represent a sharp and aggressive downturn. While possible, this remains weak scenario, given how violent the move would be.
Why the Answer Lies Outside ETH’s Chart
The real driver here isn’t just Ethereum—it’s the total "crypto market cap excluding BTC" as I have warned 2 days ago that's it's falling into a correction
The altcoin market cap is currently in correction as capital flows back into Bitcoin dominance, which has already broken its downtrend line and reached today 59%.
If the altcoin market cap holds its critical support and BTC dominance starts dropping, we can expect a broader bullish recovery across altcoins, with Ethereum following.
If that support breaks, then the weaker bearish scenario may unfold.
Conclusion
For now, the $3,760 support remains the critical line in the sand. Holding it keeps Ethereum within a bullish recovery path. Breaking it could open the door to deeper corrections.
ETH: Short-Term Trading StrategyETH: Short-Term Trading Strategy
Once again, Ethereum found a strong support zone near 4400.
The price reacted once again for the third time and if ETH respects the previous movements it should rise again to 4600
This is a 60 min setup so it can perform during the weekend.
Targets that I am looking at are near 4445 and 4615
You may find more details in the chart!
Thank you and Good Luck!
❤️PS: Please support with a like or comment if you find this analysis useful for your trading day❤️

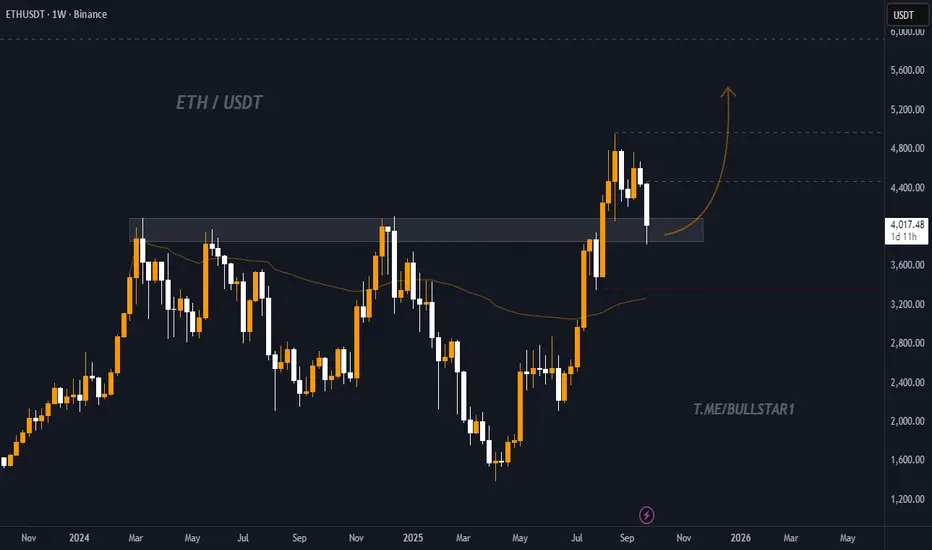
Ethereum — The Big Wave Towards New Highs, Bullish 10k?📝 Full Analysis
Ethereum (ETH/USDT) on the 1W timeframe is showing a clear 5-wave Elliott Impulse structure. Currently, price is assumed to be in the (4) corrective phase after wave (3) peaked around the 4.9k–5k zone.
Wave (4) is now retesting the critical support zone between 3.21k – 3.54k, which perfectly aligns with the Fibonacci retracement 0.5–0.618 levels. This area also acts as a key demand zone (previous resistance now flipping into support).
If this zone holds, ETH is well-positioned to start wave (5), targeting new all-time highs. But if this level breaks, ETH could fall into a much deeper corrective scenario.
---
🔑 Key Levels on the Chart
Main Support (yellow zone):
0.5 = 3,541
0.618 = 3,210
Bullish Extension Targets (Wave 5):
0.5 = 4,940
0.618 = 5,272
1.0 = 6,345
1.618 = 8,082
2.618 = 10,891
These are not just Fibonacci levels, but psychological points where the market often decides whether to continue or reverse.
---
📈 Bullish Scenario
1. Support 3.21k–3.54k holds → confirms wave (4) completion.
2. ETH prints a weekly rejection candle or bullish engulfing → buyer strength confirmed.
3. Breakout above 4.95k activates bullish momentum with staged targets:
Target 1 → 5.27k (0.618 extension)
Target 2 → 6.34k (1.0 extension)
Extended Target → 8.08k (1.618 extension)
Maximal Target → 10.9k (2.618 extension, potential new ATH)
4. Wave (5) is often accompanied by volume surge & market euphoria → a prime opportunity for swing traders and mid-term investors.
---
📉 Bearish Scenario
1. ETH closes below 3.21k weekly → weakens bullish wave structure.
2. Possible deeper retracement:
2.13k (0.5 retracement from macro impulse)
1.95k (0.618 retracement)
3. If ETH breaks below ~1.95k, the 5-wave Elliott structure becomes invalid, and the market could enter a prolonged accumulation/sideways phase similar to 2018–2019.
---
🔍 Pattern Breakdown
Elliott Impulse Wave (1–5) with strong extended wave (3).
Fibonacci retracement & extension for precise S/R validation.
Resistance → Support Flip Zone (3.2k–3.5k).
Potential Bullish Flag Structure (macro) if wave (4) is confirmed as a healthy correction.
---
🎯 Extra Insights
Wave (5) is usually shorter than wave (3) if wave (3) was already extended → realistic target sits around 6.3k–8k.
If crypto market euphoria (ETH ETF narrative, altseason) kicks in, then 10k+ ETH becomes a valid macro target.
Caution: wave (4) often forms complex corrections (flat/triangle), meaning sideways consolidation before the breakout.
---
🛡️ Trading Notes
Conservative entry: wait for weekly rejection confirmation at 3.2k–3.5k.
Aggressive entry: buy the dip in support zone with tight stop below 3.2k.
Breakout entry: wait for breakout + retest above 4.95k.
Take profit progressively: 5.2k → 6.3k → 8k.
---
Ethereum Weekly is forming a 5-wave Elliott Impulse. Currently, price is testing the critical support zone at 3.21k–3.54k.
If this zone holds → ETH is ready for wave (5) rally targeting 5.2k → 6.3k → 8k → even 10.9k.
If this zone fails → ETH risks a deeper correction towards 2.1k–1.95k.
This is the decisive moment for ETH: either break into new ATHs or enter a prolonged correction.
Not financial advice — manage your risk.
---
#Ethereum #ETHUSDT #CryptoAnalysis #ElliottWave #Fibonacci #CryptoTrading #SwingTrading #WeeklyChart #PricePrediction #AltcoinSeason

ETH/USDT Buy-Stop on 1H, Bullish Trend + Bullish DivergenceEther is showing a Bullish Trend on 1H Timeframe. Recently, it also showed a Bullish Divergence on same timeframe. However, there is a slight resistance ahead as well.
So, we can take the risk of taking a 1:1 risk-to-reward "Buy" trade here. Let's see how it goes.
29-09-25
Monday

Ethereum (ETH): Bounced Strong & Re-Testing EMAs | BullishETH bounced strongly from the oversold zone, and the recovery candle looks like a reaction to a liquidity grab rather than an actual dump. Price is now pushing back above EMAs, similar to the previous setups we saw in August (althought this time is is a little different)
The key now is a successful re-test of this reclaimed zone. As long as buyers hold structure and manage to break the zone of EMAs, the next step is continuation toward the $5,555 target.
Swallow Academy

Eth All three corrective patterns in Ethereum have the same shape, with resistance at the top and support at the bottom.
It can be expected that Ethereum might move up to the $7,000 level or to the top of its channel.

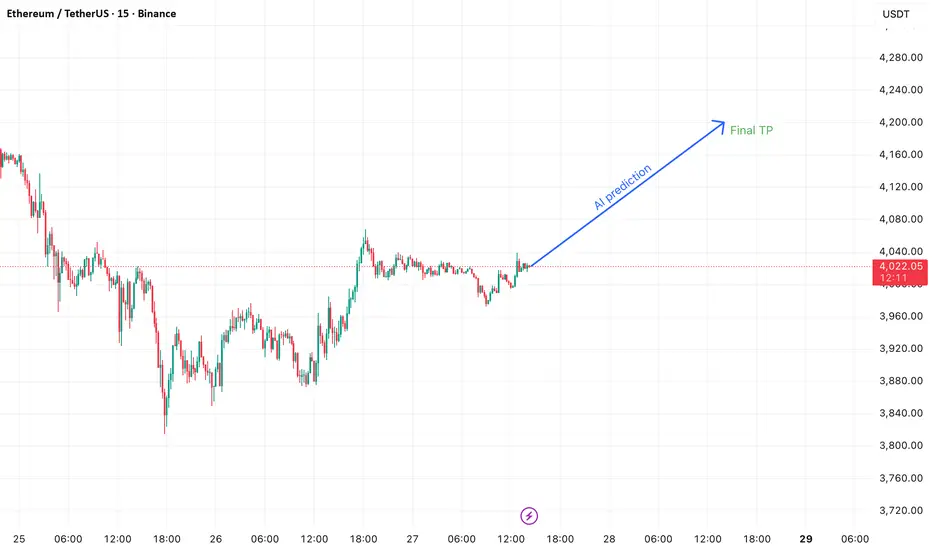
Deep Learning Model for 24-Hour ETH Price PredictionHi everyone,
I’ve developed a deep learning AI model designed to predict ETH’s price movement over the next 24 hours on the 15-minute timeframe.
It’s important to note that this model does not directly provide exact entry points for trades. Instead, it indicates the likely direction of the market, meaning you’ll still need basic trading knowledge to apply it effectively.
After testing it over the course of one month, I achieved a success rate of around 90% in my trades when using the model as part of my strategy.
The model was trained using the following features:
Time-related: Hour, DayOfWeek
Price & volume lags: Close_lag_1, Close_lag_2, Close_lag_4, Close_lag_8, Close_lag_12, Volume_lag_1, Volume_lag_2, Volume_lag_4, Volume_lag_8, Volume_lag_12
Moving averages & statistics: MA_4, Std_4, Dist_MA_4, MA_16, Std_16, Dist_MA_16, MA_48, Std_48, Dist_MA_48, MA_96, Std_96, Dist_MA_96
Technical indicators: Return_log, MACD, RSI
Hourly Forecast for the Next 24 Hours
2025-09-27 13:00:00+00:00 4026.482613
2025-09-27 14:00:00+00:00 4028.550190
2025-09-27 15:00:00+00:00 4036.481202
2025-09-27 16:00:00+00:00 4044.217143
2025-09-27 17:00:00+00:00 4051.725418
2025-09-27 18:00:00+00:00 4059.018598
2025-09-27 19:00:00+00:00 4066.029393
2025-09-27 20:00:00+00:00 4072.871648
2025-09-27 21:00:00+00:00 4079.563074
2025-09-27 22:00:00+00:00 4086.117364
2025-09-27 23:00:00+00:00 4092.561460
2025-09-28 00:00:00+00:00 4098.897422
2025-09-28 01:00:00+00:00 4107.330284
2025-09-28 02:00:00+00:00 4116.884113
2025-09-28 03:00:00+00:00 4126.399899
2025-09-28 04:00:00+00:00 4135.863390
2025-09-28 05:00:00+00:00 4145.268831
2025-09-28 06:00:00+00:00 4154.576873
2025-09-28 07:00:00+00:00 4163.768272
2025-09-28 08:00:00+00:00 4172.835229
2025-09-28 09:00:00+00:00 4181.770921
2025-09-28 10:00:00+00:00 4190.570690
2025-09-28 11:00:00+00:00 4199.232384
2025-09-28 12:00:00+00:00 4207.754681
2025-09-28 13:00:00+00:00 4216.138168
Ethereum (ETH): Back Near $4000 | Huge Shakeout Going OnETH has had a nasty fall since breaking the long trend holders' EMAs. Since then we were looking for a reclaim of EMAs but what happened was the price bottomed at $4000, which is a strong support zone!
Every indicator is telling us the ETH is oversold and so we are looking for some kind of bounce to happen anytime soon, which would lead to a retest of EMAs, and then most likely back above them and movement to a new ATH!
Swallow Academy

Ethereum (ETH): Reclaim of Re-Test and 100EMA | Bullish Monday ETH started the week with a bullish tone after bouncing from the 100EMA and reclaiming the breakout zone.
Yesterday’s candle showed clear buyer strength, and today’s continuation keeps the pressure on the upside. As long as this level holds, we are watching for a break of structure on the upper zones — that’s the next step, and after that only a new ATH!
Swallow Academy

ETH 4H trade Idea Here is an idea to trade Ethereum on 4 hour TF. Entry and Exit points are given. NFA DYOR

ETH market snapshotFor ETH to continue its upward movement, it needs to break above 4200. Currently, the attempt to approach resistance looks weak and unconvincing. Support is at 3900, but on the next test, there’s a high chance it could fail down to 3500–3600

ETH/USDT – Weekly Support Retest Before ContinuationEthereum (ETH) on the 1W chart has pulled back to a key resistance-turned-support zone around 3,800 – 4,000 USDT. This level also aligns with the 50-week moving average, creating a strong liquidity and demand area.
After a sharp rally towards 4,800 USDT, the price is currently correcting and consolidating above support. As long as this zone holds, a bullish continuation towards higher targets is expected.
🔑 Key Idea
As long as ETH holds above the 3,800 – 4,000 USDT zone, upside momentum remains valid.
A breakdown below this level would invalidate the mid-term bullish scenario.
📈 Targets:
Target 1: 4,400 USDT
Target 2: 4,800 USDT
Target 3: 5,200 USDT
⛔ Stop Loss:
Below 3,600 USDT to limit downside risk if support fails.
ETH Salaam
Just see and share a possible scenario.
ETH could make a bull flag on daily time frame just below the weekly key level of 4,000.
Also in weekly time frame, ETH broke the large triangle to the upside and now retesting, it should build it there is any will to contribute rise!
Look at 4h candle with high volume make it like accumulation.
For now confirmation wait for daily and weekly close above 4k.
Break the bill flag, retest and go for tp1 and 2.
Have great trade
Consider risk management

ETH about to reach the new ATH👉 Overall, Ethereum has completed an ABC correction, with wave C beautifully bouncing off the 1.272 Fibonacci level. Today, we saw the price break through the key $4,200 level and stabilize above it.
📈 In my view, a new bullish trend has begun for Ethereum, and I expect a breakout from the trendline toward a new all-time high soon
🎯 Targets : 4700$ and 5250$

ETH Long-Term Outlook📊 Current Setup
ETH just cracked down from consolidation and is now sliding toward that $3750–$4000 pocket 📉. This zone’s a straight-up make-or-break spot for the long-term trend — no cap.
🚦 Scenarios
👉 If price taps the zone and rejects strong (big wicks, strong closes, volume surging) 🔥 — ETH could gear up for a bounce that not only reclaims upper ranges but maybe even pushes toward fresh ATHs 🚀.
👉 If the zone cracks and we consolidate under it, that’s a midterm bearish flip 🐻, and the market could stay heavy for a while.
🧭 My Take
No clean setup to ride yet. Patience is key — the next few candles and ETH’s reaction to the $3750–$4000 zone will lay it all out.
This is one of those levels where legends get made, fam. Either we catch the next monster wave 🌊, or we sit tight and protect the bag until the tide shifts. Stay locked in 💯.
💬 What do you think about this scenario? Only share your idea if you’ve got another opinion — otherwise just hit that button 👍

ETH -- THE WOLf Hunts Below 3500ETH is chilling above $4150 right now…
but let’s be honest — a dip below $3500 is loading ⬇️📉
Here’s why:
• 🔴 The red zone = where bulls get trapped.
• 🟢 The green zone = where real support should show up.
• 📊 Bitcoin dominance is rising — classic confirmation that altcoins (yes ETH too 😅) are ready to bleed.
So yeah, don’t act surprised when ETH decides to take a little “vacation” under 3500.
Correction isn’t the end of the world… it’s just the market reminding us who’s boss 🐺😉
Chart Speaks for itselfBullish divergence at a double bottom. This is important because it is at a very critical zone where multiple times was used as resistance is now support; not shown on the graph but zooming out into higher intervals shows this.

#ETHUSDT (4H Chart)#ETHUSDT
(4H Chart)
🔹️ Ethereum Analysis 🔹️
For Ethereum, we have two important resistance levels that could lead to a significant correction:
🔴 Resistances (marked with red boxes):
🎯 First range: 4260 to 4352 USD
🎯 Second range: 4550 to 4635 USD
Supports:
🟡 Yellow box (short-term support): 3525 to 3445 USD — likely to be touched if Bitcoin reaches 100,000 USD
🟢 Green box (main support): 2800 to 2700 USD
💡 Summary:
We expect a small initial rise, then a correction down to the yellow box, and after the yellow box is touched, this analysis will be updated.
🚀 If you enjoyed this analysis, please give it a boost 💙
And to not miss any new analyses or setups, make sure to follow me 📊
🆔️ @Rasoolahmadi

ETH 4H Analysis - Key Triggers Ahead | Day 28❄️ Welcome to the cryptos winter , I hope you’ve started your day well.
⏰ We’re analyzing BINANCE:ETHUSDT on the 4-Hour timeframe .
👀 On the 4-hour chart, after the recent drop, Ethereum managed to hold above $3,900 thanks to support from its maker-buyer zone. Price is currently trading below a key resistance at $4,034. A breakout and confirmation above this level could lead ETH toward its next major trend-shift resistance.
The primary resistance for initiating a new bullish leg sits at $4,133. A break and stabilization above this zone could trigger a solid upside move, potentially extending toward the $4,800 area.
🧮 The RSI oscillator shows that during the recent sell-off, ETH dipped twice into deep oversold territory, with significant time spent under selling momentum. The key RSI zone now is the 50 baseline, which acts as resistance. A momentum break above this level would support price stabilization over $4,034, and allow ETH to retest and potentially break its resistance on the way to the overbought zone.
🕯 The candle size and volume on the rebound from the maker-buyer support have been reasonably strong, suggesting that ETH has likely established a key floor around $3,837. As price approached the $4,034 resistance, red candles have become smaller — signaling weakening bearish pressure and absorption of sell orders at that zone.
Given the weekend environment, volume has cooled off, and price is moving in a range. With the start of the new week, increased volume could spark a breakout, and trader reaction on ETH may be notable.
💸 The BINANCE:ETHBTC pair is also sitting below a key resistance zone. A breakout and confirmation here could shift ETH’s trading behavior and momentum. On RSI, the pair is around the 50 level, showing reduced volatility due to weekend conditions.
The first key resistance is at 0.03687. A breakout and confirmation above this level could support a long setup on ETH. However, the critical resistance sits at 0.03853 — which aligns with the pair’s overbought potential. Breaking and stabilizing above that level would likely trigger notable bullish continuation, but only if RSI enters the overbought zone as confirmation.
🧠 Since CRYPTOCAP:USDT.D recently rejected from 4.72% and Bitcoin has shown some support, Ethereum now holds a reliable floor that can be used for long setups once the specified resistances break. Two main scenarios are in play:
1️⃣ Scenario 1: We need a higher-timeframe candle close above key resistance, starting with $4,034, which also aligns with RSI’s 50-level resistance.
After that, spotting a multi-timeframe indecision candle could allow an entry with controlled risk.
Upon a confirmed break of the major resistance at $4,133, or signs of trend reversal, additional position size can be added.
Essentially, we require a higher low above $4,034, enabling formation of a higher high and eventual breakout through $4,133.
2️⃣ Scenario 2 : A short on ETH is less favorable due to strong buying interest at current levels and weaker risk-to-reward. However, if price breaks and confirms below the key support and maker-buyer zone, a deeper correction could follow.
❤️ Disclaimer : This analysis is purely based on my personal opinion and I only trade if the stated triggers are activated .

#ETH is in heavy resistance, cautiously bullish📊#ETH is in heavy resistance, cautiously bullish ⚠️
🧠From a structural perspective, we've reached overlapping resistance zones, so be wary of a pullback. If we can establish a bearish short structure here, consider taking some short trades.
➡️Aggressive resistance is near 4330, while standard resistance is near 4410.
Let's see 👀
🤜If you like my analysis, please like 💖 and share 💬
BITGET:ETHUSDT.P

ETH Trade Plan 27/09/2025Dear Traders,
📊 Ethereum (ETH) Technical Analysis
As shown on the chart, ETH has broken out of the upper range box and is currently making a pullback.
🔻 If this breakout is not a false trap, we could see a decline toward the key levels of 3700 – 3500 – 3400.
💡 Such a heavy drop would create a strong buying opportunity at lower prices, potentially leading to a new all-time high 🚀.
🟢 Support levels: 3700 – 3500 – 3400
🔴 Resistance: Previous broken box high
Regards,
Alireza!

Ethereum $ETH crypto trade idea using the weekly demand levelThere is an Ethereum CRYPTOCAP:ETH crypto trade idea using the weekly demand at $3,872. This is a very similar crypto swing trade idea I recently shared with BitCoin. Let's see if it wants to rally for a couple of weeks. You can use the smaller timeframes to trade crypto intraday strategies or scalping strategies.
