ETH_USDT 4H Possible Scenario I'm expecting ETH will Rejecte From above black box. Keep watching on market to catch the best trade.
HAPPY TRADING 💐
USDTETH.P trade ideas
Etherum to test resistance BINANCE:ETHUSDT My prediction 5% increase till monday. no more bear cycle here. gonna test resistance at 4500 if it clears, then resistance at 4600. resistance at 4600 seems weak, so we can expect target closer to 4700.

ETH on track for new All-Time Highcurrently, Ethereum is moving within a channel on the daily timeframe and the midline of the channel has temporarily limited further price growth. this price correction could present an entry opportunity for those who missed the 2000$, or a chance for re-accumulation. however the overall trend remains bullish. the support lines are clearly marked on the chart and it is expected that ETH will reach a new all-time high in the future, with the potential to grow up to $8000
ichimoku analysis was also used, but it has been removed for chart clarity.

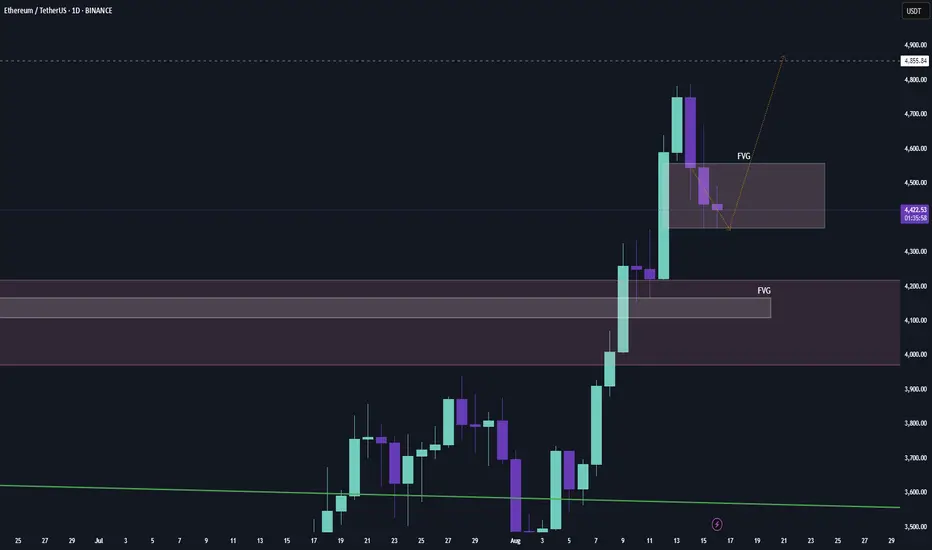
ETH Fair Value Gaps and current resistanceBINANCE:ETHUSDT shortly before potential resistance at around 5k (last ATH roughly), as well as looking at BINANCE:ETHBTC pair it's hitting a major downward resistance that upheld since 2024.
Additionally two unfilled fair value gaps between 4100 and 4600 formed, which tends to be filled in a swift (or not so swift) correction. ofc I hope that #ETH still pushes through ATH, but that's the setup I see. Going into a very short ETH short with tight stop loss to test the waters.
But the narrative still says "Altseason", so use with caution.

ETH fair value gap filledBINANCE:ETHUSDT has filled its fair value gap from august 13th. - to the teehee
now we'll see what ethereum really is made out of. if we go up from here again the altseason starts to go full swinging. on my x account I already explained that CRYPTOCAP:BTC.D is on the brink - currently barely holding onto its support since 2023. if that falls - we can expect a nice rally (imho)
ETH 1W – Testing ATH Resistance at 4.8K–5.3KEthereum has rallied strongly into the 4.8K–5.3K resistance zone — the same level that capped price during the 2021 bull cycle. This region is historically significant and is now the final barrier before potential all-time highs.
If ETH rejects here, traders should watch for support retests around 3.6K and deeper at 1.6K–1.8K. However, a confirmed weekly close above 5.3K would signal a breakout and likely continuation toward price discovery, with upside momentum favoring higher valuations.
This zone is critical — ETH is either setting up for a major breakout or forming another macro double top.


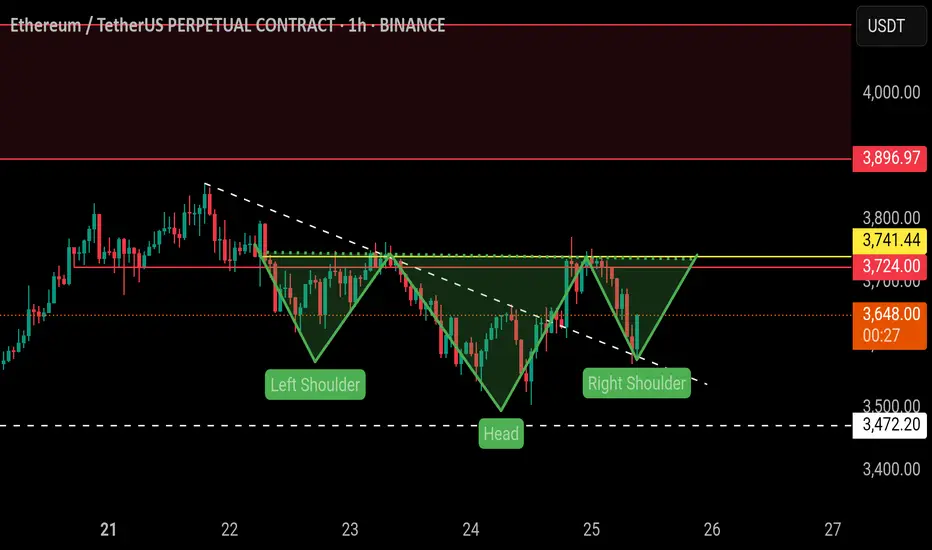
$ETH | Ready to fly (Inverted head and shoulders)BINANCE:ETHUSDT.P
On 1H TF, the price is forming inverted head and shoulders pattern, which is a strong bullish pattern.
The price has retested the trendline support and bounced back.
Expecting it to breakout above yellow line soon.
A breakout above the yellow line will be a bullish and pattern confirmation.
We can initiate a long entry from here.
Please do proper risk management and must use stop loss.
NFA, DYOR
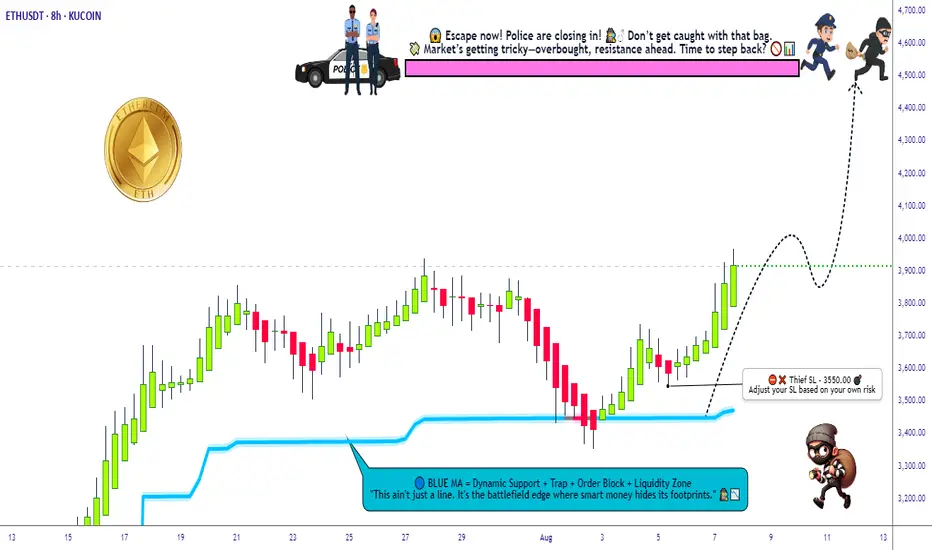
ETH/USDT Grid Plan » Bullish Loadout » Stealing the Top🚨ETH/USDT Crypto Heist Plan 🔓💰
Asset: ETH/USDT "Ethereum vs Tether"
Plan: 🟢 Bullish – Multi-Layered Entry Grid
Strategy: Thief-style limit orders (GRID / DCA stacking)
Entry: Any Dip is a Heist Opportunity 💸
Stop Loss: 🔻 3550.00
Target: 🎯 4500.00
👋 Hey Thieves & Money Makers!
Get your gear ready – it's time to loot the Ethereum Vault 💎🚀
🔥Thief Trader's ETH/USDT Master Robbery Blueprint🔥
This ain’t your average plan — we break in with layered entries, lock in on breakout volatility, and ride the bullish train to the moon 🌕.
💼 Entry Strategy:
No need to overthink. Any dip = loot zone!
Stack multiple limit orders like a pro (15M–1H level).
We're playing the grid game. The more dips, the bigger the stash! 🧱🪙
🚨 Stop Loss:
Set SL at 🔻3550 or under recent swing lows.
Adjust by risk appetite and how many entries you stack.
Thieves don’t chase – they calculate risk.
🎯 Target Zone:
We're eyeing the 4500 mark. But remember – exit before the vault shuts if momentum slows. 🏃♂️💨💰
🔁 Scalpers Alert:
Only long. Only bullish. Only profit. 🧲💥
Stack it, trail it, and let it run with a sniper's precision. 🎯🧠
📊 Market Context:
ETH bulls gaining control post-accumulation.
Strong on-chain metrics, solid macro tailwinds.
Bears trapped in the shadows – we move in daylight. 🐂🆚🐻
📰 Warning – News Bombs Ahead!
💣 Avoid fresh positions during high-impact events.
🎯 Use Trailing SLs to protect your loot.
Smart robbers never get caught unguarded.
💥BOOST This Idea if you're part of the robbery crew 🔐💰
Every boost powers our next move.
Let's rob the crypto market together – one breakout at a time! 🏴☠️📈🤑
Thief Trader™ – Locking Targets. Looting Charts.
💎🕵️♂️📊 #CryptoHeist #ThiefStyle #ETHBreakout #GridGang #BullMode
ETHEREUM WEEKLY CHART ETHEREUM weekly chart shows the retest of the current all time high supply roof of 5000k zone by heavy sell order from retail and institutional investors who are taking profit from the supply zone after a heavy bullish rally.
the rejection at 5000k zone is correct and it is based on market structure. This correction will be monitored for aggressive sell off.if we uphold the weekly candle close ascending trendline acting a dynamic resistance to upswing on three different occasion than we are looking for buy opening.
i see a break of the current high of 5000k to reach a high above 6000k region after a correction phase by market participants .
trading is 100% probability, manage your risk
protect your capital at all time.
no trade is better than a bad trade
think like a hunter,a hunter save his bullet for a big kill.
GOOD LUCK
AND START THE WEEK STRONG.
BYE.

ETH SHORTETH has gotten bearish recently by breaking 100 and 50 ema as well as creating a big bearish liquidity void
I have analyzed a 4H supply area which matches 3Day POC and hence why I will be placing my entries there.
Feel free to comment !

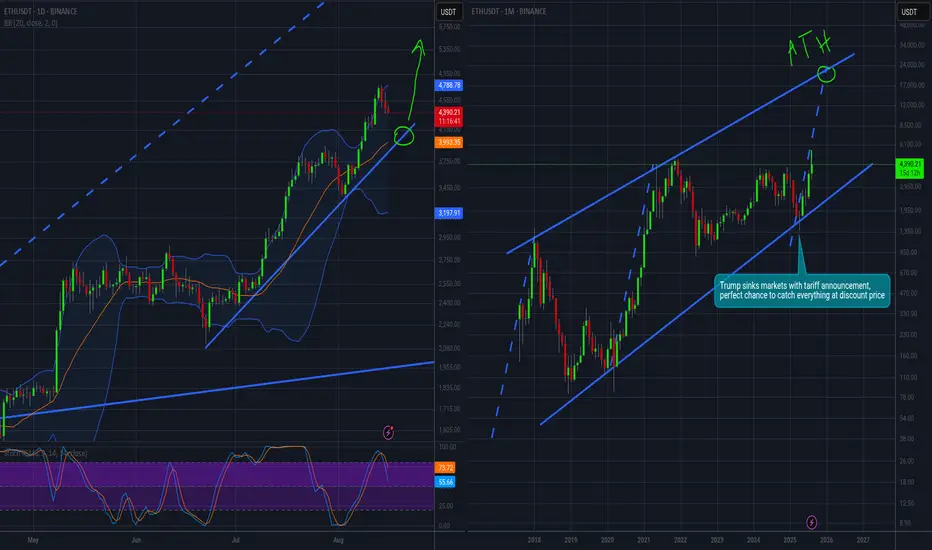
ETH - short to 4k, then 20k by ChristmasETH bollinger meridian band lining up with recent upward trend.
With institutional investors pigging out on Ethereum for the past few months, and the historical pattern of ETH all time highs, I expect a short term downtrend to 4000 and then shooting up towards 20k by Christmas.
Happy trading!
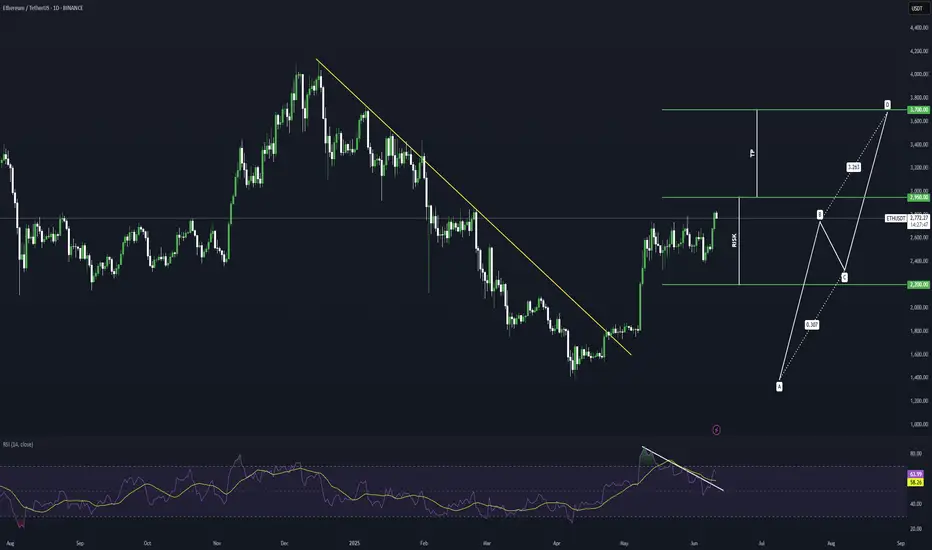
ETHEREUM Potential Bullish BreakoutEthereum price seems to exhibit signs of overall potential Bullish momentum if the price action forms a prominent Higher High with multiple confluences through key Fibonacci and Support levels which presents us with a potential long opportunity.
Trade Plan:
Entry : 2950
Stop Loss : 2200
TP 1 : 3700
ATH FOR Ethereum!!!Hello friends🙌
As you know, Ethereum has been on an upward trend these days and we can say that buyers have entered, but not completely...👀
🔊Now, considering the resistance that Ethereum is facing, namely the number 3900 to 4100, we need to see what reaction the price will see this time when the price reaches this resistance for the 4th time?
✔We will most likely make a small correction and this time this major resistance will be broken again and we will witness a higher ceiling.
✔Otherwise, I have an important and key support that we have identified for you and if the price drops, this support is a good area to buy again.
And finally, observe risk and capital management⚠
🔥Follow us for more signals🔥
*Trade safely with us*

ETH: LIVE TRADEHello friends🙌
✅Given the good rise we had, we had a small correction that was a buying opportunity and there is another support area where we can buy the second step in case of further correction.
We have also specified targets for you, be careful and do not act emotionally and observe capital and risk management.
🔥Follow us for more signals🔥
*Trade safely with us*

ETH/USDT | 1H Analysis & Key TargetsOverview:
Ethereum is currently showing a corrective pattern after hitting recent highs near $4,880. Price action indicates a potential bearish continuation within a descending channel. The chart highlights a possible ABCD harmonic formation that may lead to further downside movement.
Key Observations:
Current Price: $4,445
Pattern: ABCD correction (potential reversal at D)
Resistance Zones: $4,600 – $4,700
Support Zones / Targets:
Target 1: $4,200
Target 2: $3,900
Target 3: $3,700
Target 4: $3,200
Notes:
Price may attempt a short-term pullback towards the D point before continuing downward.
Watch for confirmation at the descending channel’s upper trendline for potential short entries.
Target levels are based on previous support zones and Fibonacci projections.
Risk management is crucial—set stop-loss above the $4,600–$4,700 resistance area.
Trading Plan:
Consider scaling into short positions on rejection at resistance or after confirming the bearish continuation.
Partial profit-taking at each target zone to manage risk and lock in gains.
Summary:
ETH/USDT is showing early signs of a wave 4 correction in a bearish sequence. Keep an eye on the descending channel and ABCD completion for optimal entry and exit points.

ETH 2H – Trendline & Support ConfluenceETH is pulling back into a confluence of ascending trendline support and prior resistance now acting as support near $4,400. Holding this level could set up a continuation toward recent highs around $4,720. Structure remains bullish while price respects the trendline.

ETH's next volatility period: around August 28th
Hello, traders!
Follow us to get the latest information quickly.
Have a great day!
-------------------------------------
(ETHUSDT 1D chart)
This volatility period for ETH is expected to last until August 15th.
Therefore, caution is advised when trading.
The key question is whether the price can rise above the previous all-time high (ATH) of 4868.0.
Currently, the key support and resistance levels are 3900.73-4107.80.
Therefore, even if there is a further decline, if the price remains within the 3900.73-4107.80 range or higher, the upward trend is expected to continue.
Currently, the HA-High indicator is formed at 3708.87, so it's important to check whether a new HA-High indicator is formed if a further decline occurs.
The formation of the HA-High indicator indicates a decline from the high, so determining whether support is found near that level is crucial.
While ETH's volatility period is around August 28th, BTC's volatility period is around August 24th. Therefore, it's important to monitor how the price moves during this period.
-
Thank you for reading.
We wish you successful trading.
--------------------------------------------------
- Here's an explanation of the big picture.
(3-year bull market, 1-year bear market pattern)
I'll explain more in detail when the bear market begins.
------------------------------------------------------

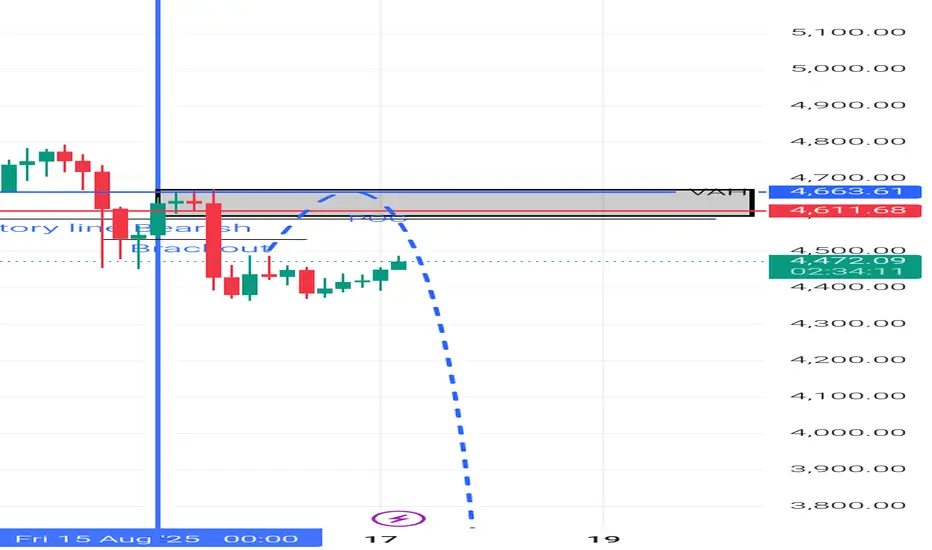
ETH Daily Recap & Game Plan – 15.08.2025ETH Daily Recap & Game Plan – 15.08.2025
📊 Market Sentiment
Overall sentiment remains bullish, supported by expectations of a 0.25% rate cut in the upcoming FOMC meeting. A weakening USD and increasing global risk appetite are creating favorable conditions for further upside in crypto assets.
Ethereum is approaching all-time highs, fueled by a $1B single-day ETF inflow. Additionally, rumors of potential SEC approval for Ethereum staking policy could directly boost ETH’s utility — strengthening the long bias.
📈 Technical Analysis
Price has started a retracement move after Bitcoin reached new all-time highs.
Currently, ETH is testing the daily demand zone (blue box) — a level where we may see a reaction. For confirmation, I want to see a 4H break of structure before initiating any trades.
Since it’s the weekend, I expect some choppy price action and possibly a deeper retracement. I’m watching two potential scenarios (Blue vs. Red).
📌 Game Plan
Scenario 1 (Blue)
→ Price sweeps 4H swing liquidity at 4255$, then rejects.
Scenario 2 (Red)
→ Price dips deeper, tapping the untested swing high at 4112$ and possibly into the equilibrium discount zone (0.5 Fibonacci), before rejecting.
🎯 Setup Trigger
Waiting for a 4H break of structure before entering any position.
📋 Trade Management
Stoploss: 4H swing low confirming the BOS
Target: Run directly toward all-time highs at 4867$
💬 Like, follow, and comment if you find this setup valuable!
Disclaimer: This content is for informational and educational purposes only and does not constitute financial, investment, or trading advice. Always do your own research before making any financial decisions.

ETH Long Idea - Daily Recap - 14.08.2025📊 Market Sentiment
Overall sentiment remains bullish, supported by expectations of a 0.25% rate cut in the upcoming FOMC meeting. A weakening USD and increasing global risk appetite are creating favorable conditions for further upside in crypto assets.
Ethereum is approaching all-time highs, fueled by a $1B single-day ETF inflow. Additionally, rumors of potential SEC approval for Ethereum staking policy could directly boost ETH’s utility — strengthening the long bias.
📈 Technical Analysis
Price has pulled back to the daily fair value gap. HTF fair value gaps are historically strong zones for potential bounces.
📌 Game Plan
I expect possible expansion toward all-time highs here, as we have broken the LTF market structure.
📋 Trade Management
Entry: 4602$
SL: 4455$
TP: All-time highs at 4867$
💬 Like, follow, and comment if you find this setup valuable!
Disclaimer: This content is for informational and educational purposes only and does not constitute financial, investment, or trading advice. Always do your own research before making any financial decisions.

ETH/USDT 4H chart review1. Trend
• Direction: a downward trend, confirmed by a series of lower peaks and lower holes.
• The black line is a downward trendline - a course from a few candles reflects it down.
• The increase in volume in declines suggests that the seller is still dominating.
⸻
2. Key levels
• Resistance:
• 4 634 USDT - the last strong resistance from which the price has reflected.
• 4,527 USDT - local resistance, coincides with Trendline.
• Support:
• 4,415 USDT - the current level of support tested, the price consolidates here.
• 4,300 USDT - another strong level of support; Breaking can accelerate the inheritance.
⸻
3. Current situation
• The price has fallen below 4,527 and is currently supporting 4 415.
• The candle formation on support is mixed - small green candles after a large red impulse suggest a temporary pause or a correction attempt.
• The volume on inheritance candles is higher than on growth → Seller still stronger.
⸻
4. Scenarios
🔴 Negative (more likely if the sales volume persists)
• If 4,415 is pierced with an increased volume, the purpose of the inheritance is 4,300 USDT, and in case of further pressure even 4,200.
• The downward trend is maintained.
🟢 positive (less likely at the moment)
• If the course reflects from 4 415 and breaks Trendline + Level 4 527, then possible movement in the direction of 4 630.
• This requires an increased volume of buyers.

ETH - 1H Elliott Wave Analysis - 15.08.25Greetings! We hit 100 Followers, welcome to all the new joiners :) Happy to have you here with us, thank you! ^-^
We assume the recent high was a Wave 3 and we are now looking for a pullback in a Wave 4 as an ABC. The Wave 4 support area lies between the 0.236 FIB at 4463 USD and the 0.5 FIB at 4121 USD. As we already entered the support area by touching the 0.236 FIB the correction could be over but we think it is more likely that that was only the A Wave of a bigger ABC correction.
The Wave B resistance area is between the 0.382 FIB at 4582 USD and the 0.886 FIB at 4754 USD. Be aware that B Waves resistance areas are not strong which makes B Waves harder to predict and trade. Additionally the B Wave could extend higher and take out the ATH in an overshooting B Wave especially with the bullish market sentiment we have around Ethereum at the moment.
Thanks for reading.
NO FINANCIAL ADVICE.

ETH/USDTCurrently holding a local bullish structure. Within the corrective move, two key zones are marked where a potential reaction may occur.
Positions to be taken only after clear confirmation.
