ETH's next volatility period: around August 28th
Hello, traders!
Follow us to get the latest information quickly.
Have a great day!
-------------------------------------
(ETHUSDT 1D chart)
This volatility period for ETH is expected to last until August 15th.
Therefore, caution is advised when trading.
The key question is whether the price can rise above the previous all-time high (ATH) of 4868.0.
Currently, the key support and resistance levels are 3900.73-4107.80.
Therefore, even if there is a further decline, if the price remains within the 3900.73-4107.80 range or higher, the upward trend is expected to continue.
Currently, the HA-High indicator is formed at 3708.87, so it's important to check whether a new HA-High indicator is formed if a further decline occurs.
The formation of the HA-High indicator indicates a decline from the high, so determining whether support is found near that level is crucial.
While ETH's volatility period is around August 28th, BTC's volatility period is around August 24th. Therefore, it's important to monitor how the price moves during this period.
-
Thank you for reading.
We wish you successful trading.
--------------------------------------------------
- Here's an explanation of the big picture.
(3-year bull market, 1-year bear market pattern)
I'll explain more in detail when the bear market begins.
------------------------------------------------------
USDTETH.P trade ideas

ETH Daily Recap & Game Plan – 15.08.2025ETH Daily Recap & Game Plan – 15.08.2025
📊 Market Sentiment
Overall sentiment remains bullish, supported by expectations of a 0.25% rate cut in the upcoming FOMC meeting. A weakening USD and increasing global risk appetite are creating favorable conditions for further upside in crypto assets.
Ethereum is approaching all-time highs, fueled by a $1B single-day ETF inflow. Additionally, rumors of potential SEC approval for Ethereum staking policy could directly boost ETH’s utility — strengthening the long bias.
📈 Technical Analysis
Price has started a retracement move after Bitcoin reached new all-time highs.
Currently, ETH is testing the daily demand zone (blue box) — a level where we may see a reaction. For confirmation, I want to see a 4H break of structure before initiating any trades.
Since it’s the weekend, I expect some choppy price action and possibly a deeper retracement. I’m watching two potential scenarios (Blue vs. Red).
📌 Game Plan
Scenario 1 (Blue)
→ Price sweeps 4H swing liquidity at 4255$, then rejects.
Scenario 2 (Red)
→ Price dips deeper, tapping the untested swing high at 4112$ and possibly into the equilibrium discount zone (0.5 Fibonacci), before rejecting.
🎯 Setup Trigger
Waiting for a 4H break of structure before entering any position.
📋 Trade Management
Stoploss: 4H swing low confirming the BOS
Target: Run directly toward all-time highs at 4867$
💬 Like, follow, and comment if you find this setup valuable!
Disclaimer: This content is for informational and educational purposes only and does not constitute financial, investment, or trading advice. Always do your own research before making any financial decisions.

ETH Long Idea - Daily Recap - 14.08.2025📊 Market Sentiment
Overall sentiment remains bullish, supported by expectations of a 0.25% rate cut in the upcoming FOMC meeting. A weakening USD and increasing global risk appetite are creating favorable conditions for further upside in crypto assets.
Ethereum is approaching all-time highs, fueled by a $1B single-day ETF inflow. Additionally, rumors of potential SEC approval for Ethereum staking policy could directly boost ETH’s utility — strengthening the long bias.
📈 Technical Analysis
Price has pulled back to the daily fair value gap. HTF fair value gaps are historically strong zones for potential bounces.
📌 Game Plan
I expect possible expansion toward all-time highs here, as we have broken the LTF market structure.
📋 Trade Management
Entry: 4602$
SL: 4455$
TP: All-time highs at 4867$
💬 Like, follow, and comment if you find this setup valuable!
Disclaimer: This content is for informational and educational purposes only and does not constitute financial, investment, or trading advice. Always do your own research before making any financial decisions.

ETH/USDT 4H chart review1. Trend
• Direction: a downward trend, confirmed by a series of lower peaks and lower holes.
• The black line is a downward trendline - a course from a few candles reflects it down.
• The increase in volume in declines suggests that the seller is still dominating.
⸻
2. Key levels
• Resistance:
• 4 634 USDT - the last strong resistance from which the price has reflected.
• 4,527 USDT - local resistance, coincides with Trendline.
• Support:
• 4,415 USDT - the current level of support tested, the price consolidates here.
• 4,300 USDT - another strong level of support; Breaking can accelerate the inheritance.
⸻
3. Current situation
• The price has fallen below 4,527 and is currently supporting 4 415.
• The candle formation on support is mixed - small green candles after a large red impulse suggest a temporary pause or a correction attempt.
• The volume on inheritance candles is higher than on growth → Seller still stronger.
⸻
4. Scenarios
🔴 Negative (more likely if the sales volume persists)
• If 4,415 is pierced with an increased volume, the purpose of the inheritance is 4,300 USDT, and in case of further pressure even 4,200.
• The downward trend is maintained.
🟢 positive (less likely at the moment)
• If the course reflects from 4 415 and breaks Trendline + Level 4 527, then possible movement in the direction of 4 630.
• This requires an increased volume of buyers.

ETH - 1H Elliott Wave Analysis - 15.08.25Greetings! We hit 100 Followers, welcome to all the new joiners :) Happy to have you here with us, thank you! ^-^
We assume the recent high was a Wave 3 and we are now looking for a pullback in a Wave 4 as an ABC. The Wave 4 support area lies between the 0.236 FIB at 4463 USD and the 0.5 FIB at 4121 USD. As we already entered the support area by touching the 0.236 FIB the correction could be over but we think it is more likely that that was only the A Wave of a bigger ABC correction.
The Wave B resistance area is between the 0.382 FIB at 4582 USD and the 0.886 FIB at 4754 USD. Be aware that B Waves resistance areas are not strong which makes B Waves harder to predict and trade. Additionally the B Wave could extend higher and take out the ATH in an overshooting B Wave especially with the bullish market sentiment we have around Ethereum at the moment.
Thanks for reading.
NO FINANCIAL ADVICE.

ETH/USDTCurrently holding a local bullish structure. Within the corrective move, two key zones are marked where a potential reaction may occur.
Positions to be taken only after clear confirmation.

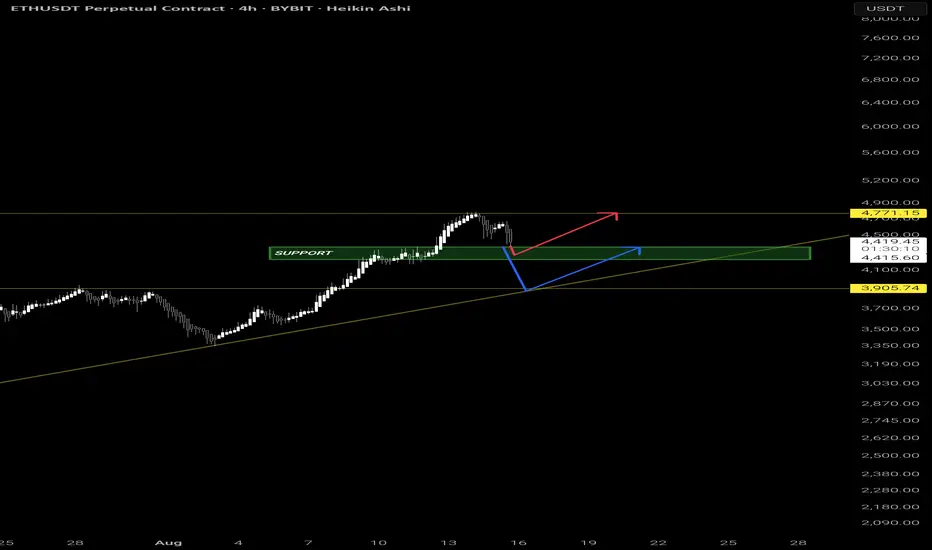
ETH POSSIBLE SCENARIOThe ethereum or the market right now is bullish, so we expect a bullish pattern. Hoping to see a bounce at key level support. Scenario 1 red line. Scenario 2 blue line.
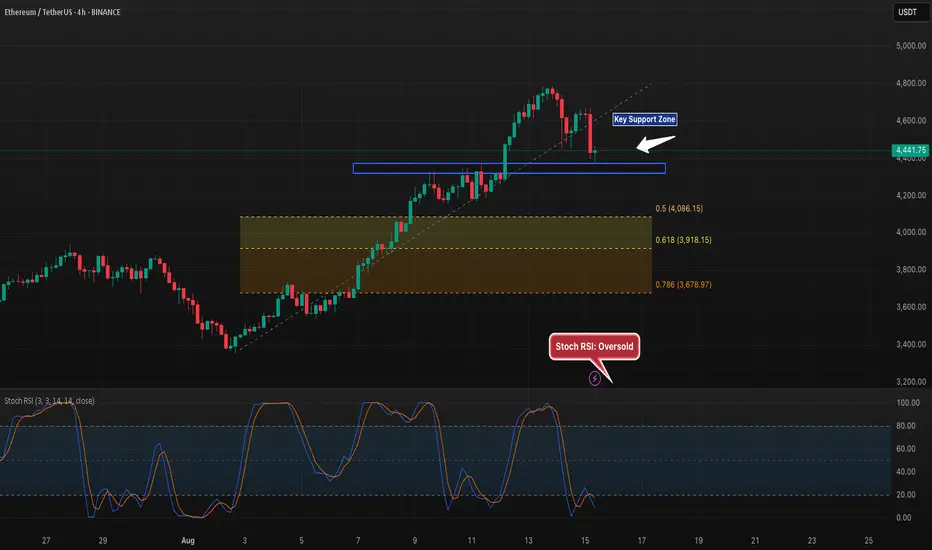
ETH 4H – Retesting $4.4K Support, Next Stops if It Breaks?ETH is currently retesting the $4,400 horizontal support after pulling back from recent highs. This level is critical as a breakdown could send price toward the $4,086 (0.5 Fib) and $3,918 (0.618 Fib) retracements, with $3,678 (0.786 Fib) as a deeper target. The Stoch RSI is in oversold territory, hinting at possible short-term relief if buyers defend $4,400. A bounce here could keep the broader uptrend intact, while a close below increases the likelihood of a larger retracement.
Will $ETH remain bullish below $4,000?Ethereum hasn’t yet broken above its previous ATH.
The colorful lines you see are mostly Fibonacci retracement & extension levels, tools traders use to identify potential support and resistance zones.
• Support: a level where price might stop falling and bounce (e.g., $4,141, blue line).
• Resistance: a level where price might struggle to go higher (e.g., $4,728 and $4,781, red lines).
The RSI (Relative Strength Index) shows market momentum:
• Above 70 = overbought (possible pullback).
• Below 30 = oversold (possible bounce).
Currently, RSI is at 25.82, indicating oversold conditions, which could lead to a bounce, though oversold doesn’t guarantee an immediate reversal.

ETH/USDT ANALYSIS ETH has had a very strong bullish momentum and now in a corrective mood and know where there would be a great support and entry for potential LONG opportunities is very crucial. The entry level from the chart is around $4100 😘😍

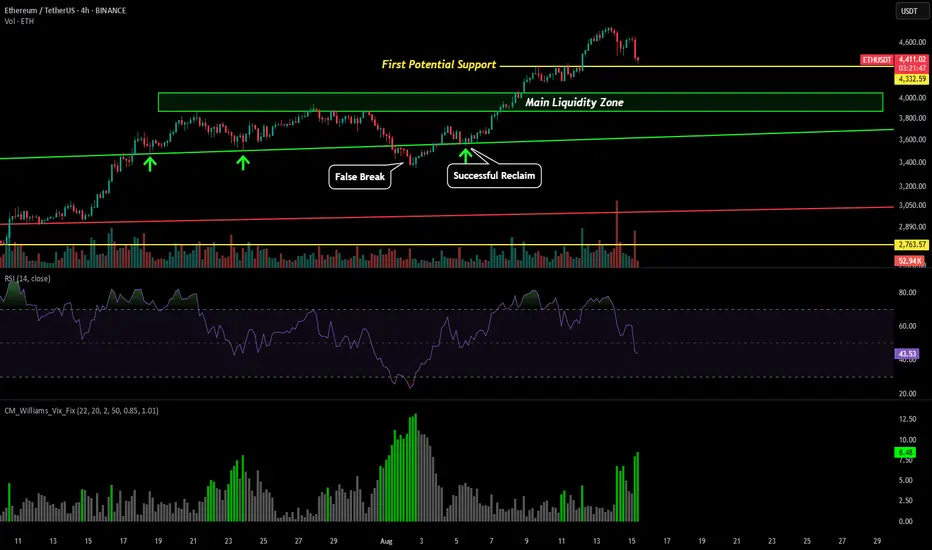
ETH - Current Levels to WatchSo far everything about ETH's breakout move has played pout perfectly. We had the successful reclaim of the green trendline (from all my previous ETH posts), followed by the break of the key $4k level (multi-year resistance), then the expansion move to $4,800 (our previous ATH).
Now we are seeing a cooloff from the previous ATH so what should we expect next?
The first level we are watching as a potential support level is our yellow line. This level was old resistance before breaking above to make our move to $4,800. Therefore, can this old resistance become new support? This is the first key level we are watching on this downturn ranging from about $4,260-$4,375 with the main interest around $4,315.
The next level would be our MAIN LIQUIDITY ZONE raging from $3,800-$4,100. This was our past multi year resistance that we would love to see a retest of new support. Demand at the moment for ETH seems to be pretty high, therefore buyers should find this level very appealing if we get a dip to there. The main interest level would lie between $3,850-$3,950. If just depends if whales front run this level or not.
Eth next target All time high1D bullish FVG with a strong weekly bullish FVG will definitely push ETH to All time high

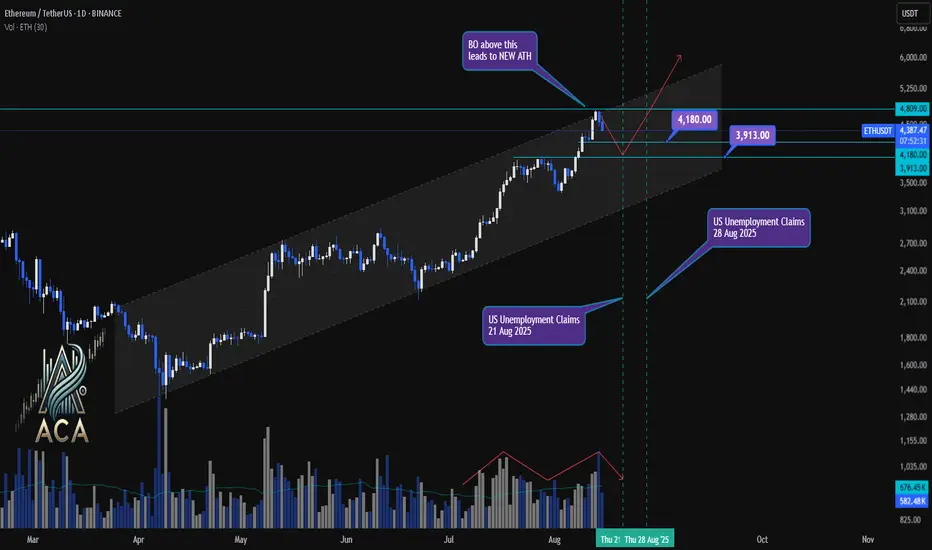
ETHUSDT 1D Chart Update | Channel Structure, Economic EventsETHUSDT 1D Chart Update | Channel Structure, Economic Events & ATH in Focus
🔍 Here’s the latest breakdown of ETH/USDT price action on the daily chart—channel dynamics, correction levels, and upcoming catalysts.
⏳ Daily Overview
Ethereum is trending strongly within an ascending channel, respecting both mid-level and upper resistance. After a local correction, price is rebounding with sturdy volume participation—signaling renewed interest from buyers.
📉 Correction Levels & Volume
- Recent correction found support at the $3,913 zone, with the $4,180 mark now acting as next key level.
- Volume has picked up on bullish candles, confirming the strength of this bounce.
- Correction appears healthy: price stayed within the channel, higher lows maintained.
📊 Channel, Economic Events & Breakout Setup
- ETH continues trading inside the established channel, posting higher highs and higher lows.
- Two major US economic events ahead—Unemployment Claims releases on Aug 21 and Aug 28, 2025—that could trigger volatility.
- Watch for a breakout (BO) above $4,809: crossing this sets the stage for a new all-time high (ATH).
🎯 Key Levels & Scenario
- $3,913: Correction support zone; ideal spot for high RR (risk/reward) long entries if retested.
- $4,180: Immediate resistance; flipping this could attract trend-following bulls.
- $4,809: Channel top and major breakout threshold. If price closes above, expect acceleration toward new ATH territory.
🚨 Conclusion:
ETH is pushing firmly inside its channel, with correction and volume patterns favoring bullish continuation. Key economic events may provide the volatility needed for a breakout move. Above $4,809, watch for new ATHs; dips to $3,913–$4,180 offer attractive re-entry zones for aggressive traders. Stay adaptive as August catalysts unfold.
Ethereum PullbackETH is dipping to the 🔥 $4,000 zone — strong resistance + 50% Fibonacci level.
💡 Could this be the perfect entry for the ones left behind? 🚀
Pullback sing in the NEW RSI indicator.

ETH Elliot Wave to Smash the BIG 5k ATHmarked out some precise Elliot Wave levels on ETH:
recently closed W3 at 4788, which gives a W4 targets 4343.56 and 4167
leading to W5 breaking the big 5k mark with targets 5081.20 or 5171.78 (with deeper pullback in W4).
this gives a nice short opportunity entering just below the HTF supply zone at 4618.92 (divergence suggests another small bounce)
followed by an epic long to new ATH entering at 4313.56 (and 4167 on a deeper W4) with TPs at 4899 and 5081

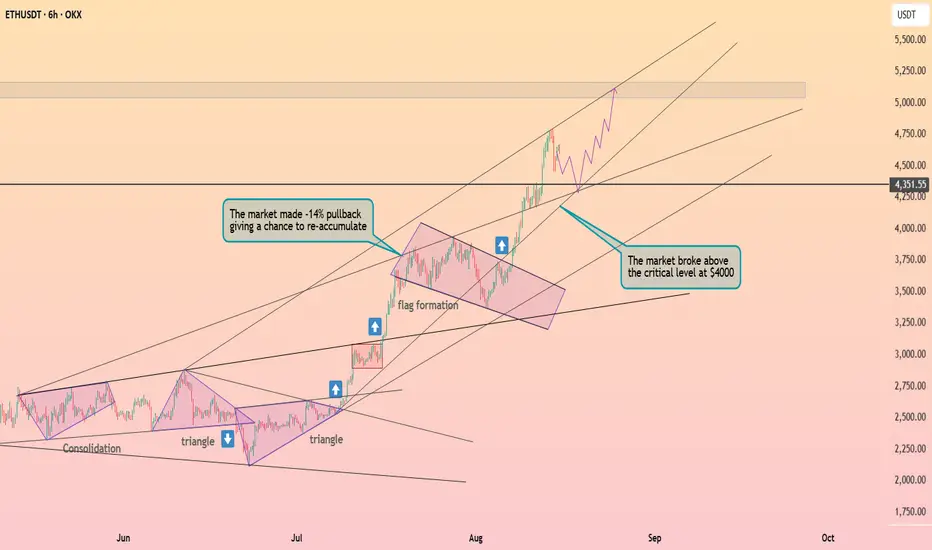
Ethereum above the $4300 level ┆ HolderStatOKX:ETHUSDT broke above the $4,000 mark after a healthy -14% pullback, signaling continuation toward $5,000–$5,200. Support at $4,000 remains the key level for bulls.
The season of Ethereum has arrived!
Do you know that Ethereum is currently the strongest coin in the market?
Even its targets and chart look stronger than Bitcoin’s.
Exactly 4 months ago, I posted an Ethereum analysis saying it had reached its lowest bottom, and at that time its price was exactly $2,180.
Take a look at the chart below.
Now my view is playing out, and Ethereum is only a few steps away from a new all-time high.
But did you know it’s still early, and you haven’t missed the opportunity yet?
Ethereum just broke a megaphone pattern on the weekly timeframe with a massive candle.
Even with all this upward movement, it only started breaking the pattern in the last couple of days, and it still has around 5% left to climb before hitting a new peak and entering price discovery mode.
And even with the crash that happened yesterday, it didn’t drop much and bounced back very quickly, as if it were just a normal day.
Overall, Ethereum will be in the 5-digit range—just like I told you exactly 4 months ago, when many didn’t believe it—and it will reach that by the end of the year. Remember my words, just like every time I’ve told you before.
Best Regards:
Ceciliones🎯


ETHUSDT is in Bullish TrendETHUSDT is showing a good bullish trend but there is a divergence showing on daily chart which indicate it can be slow down or it can make an lower high and if the price maintain between 4000 to 3800 then it can go for the next higher high and continue the bullish trend for a while or if the price breaks down side then it can go toward 2800 which is good for buyers

ETHEREUM bearish-divergenceA bearish divergence exists on Ethereum's daily RSI, but since $4,000 is broken, it should hold above that price.

Ethereum (ETH): We Are Almost Near Our Last TargetETH has been one of the top performers of 2025 for sure, where price has done amazing work reclaiming the upper zones, leading price back closer to the ATH zone.
But that's not all; as soon as we reach the last target on ETH, we are going to look for a breakout and a new ATH to form on it, with targets sitting for us at $5000, $6000, $7000 and $8000 (extreme measures).
Swallow Academy

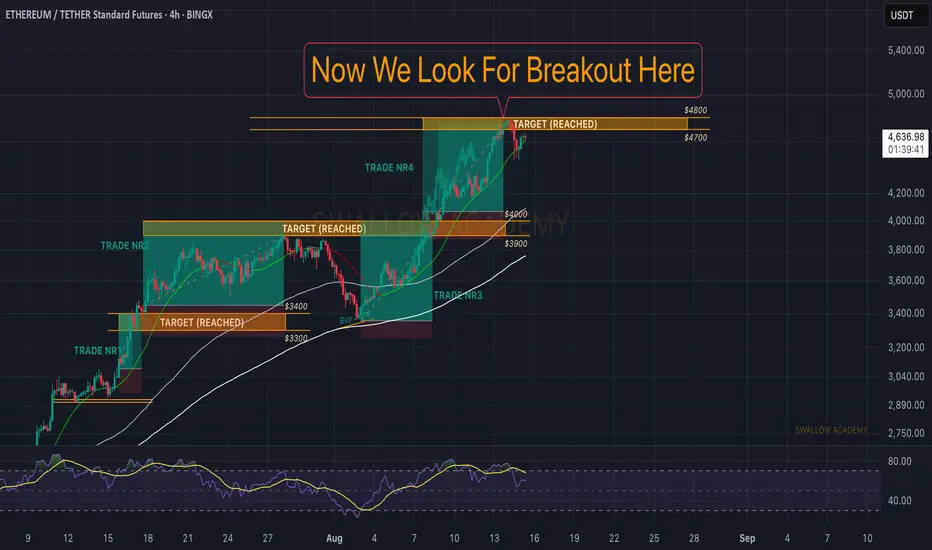
Ethereum (ETH): $4800 Incoming | Time To Shine!Ethereum is cooking, where the price recently broke our local resistance zone like nothing and now is heading towards the ATH zone.
Now it is not a secret that we are looking for proper upside movement from here, even after the breakout so that's the game plan—currently aiming for the $4800 zone and after that we will be looking for a BREAKOUT!
Swallow Academy

Ethereum (ETH): Still Looking For Proper Breakout | Not RushingEthereum has not yet broken the ATH zone, which means we are doing nothing!
Currently it is not very clear if we see that breakout or not or even when do we see it, but what we know is, if we see the breakout here, this will explode the chart heavily and that'here our r buy ent most probably will be sitting at as well.
Swallow Academy