ETH/USDT 12h chart1. Punction of the downward trend
• The black inheritance trend line has been broken up - this is a strong signal of Bycza.
• Breaking was confirmed by a strong candle movement and high growth dynamics.
⸻
2. Key levels of support and resistance
• Support:
• 3930 USDT - previous resistance, now the defensive zone with possible correction.
• 3709 USDT - deeper support.
• 3488 USDT - critical support, below which the upward trend would be negated.
• resistance:
• 4048 USDT - current local resistance (the candle touched and lightly reflected).
• 4304 USDT - another strong resistance.
• 4484 USDT - long -term resistance and potential goal when continuing to grow.
⸻
3. RSI
• RSI is around 70 - close to the purchase zone.
• suggests the possibility of a short correction or consolidation before the upward trend continues.
⸻
4. Scenarios
Bycza (continuation of growth)
• Maintenance above 3930 USDT.
• Breaking over 4048 USDT opens the road to around 4300–4480 USDT.
Bear (correction)
• Rejection to USDTT 4048 and a decrease below 3930 USDT may bring a rate to around 3709 USDT.
USDTETH.P trade ideas

Ethereum Wave Analysis – 8 August 2025- Ethereum broke the resistance level 3925.00
- Likely to rise to resistance level 4108.00
Ethereum cryptocurrency recently broke the resistance level 3925.00 (which stopped the previous impulse wave 1 at the end of July).
The breakout of the resistance level 3925.00 continues the active impulse wave 3, which started earlier from the support zone lying at the intersection of the support level 3400.00 and the upper trendline of the daily up channel from April.
Given the clear daily uptrend, Ethereum cryptocurrency can be expected to rise to the next resistance level 4108.00 (multi-month high from December) – the breakout of which can lead to further gains toward 4400.00.

ETH 4k to 3.2kThere is a major fib here which I don't think will break.
Price has been going up consistantly to remove shorts from the market.

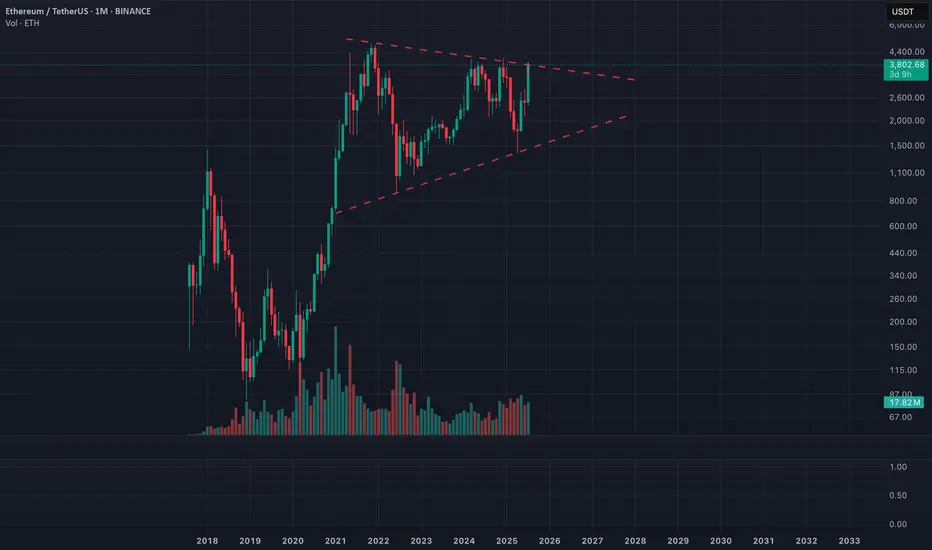
ETHUSDT - Multi-year Symmetrical Triangle ETH has formed a massive symmetrical triangle since the 2021 top (~$4,800).
This triangle has been tightening since 2022 with:
- Lower highs from $4,800 → ~$4,000
- Higher lows from ~$850 → $1,370 → $1,850+
We now close to the apex, meaning a major breakout or breakdown is imminent in the coming weeks/months.
Price Action
ETH is pressing against the upper resistance of the triangle (~$3,850–3,950).
A monthly close above $4,000 would be the first breakout in over 2 years.
Volume
Volume has decreased over time, typical for a symmetrical triangle.
We are looking for volume increase on breakout to confirm it’s on the right track.
Momentum (Laguerre RSI: 0.67)
Momentum is rising, supportive of a bullish breakout.
RSI is not yet overbought, so there’s room for continuation.
Scenarios
Bullish Breakout Scenario:
Trigger: Monthly close above $4,000–4,200
Target: ~$7,000–7,500
Timeline: Could play out over 3–6 months
Bearish Breakdown Scenario
Trigger: Monthly close below $2,500
Target Zone: $1,850 → $1,300 (last major supports)
Would invalidate the higher low structure
I am bullish but it is hard to not to be cautious given its crypto and this is a pretty tough resistance.
Do your own research and make responsible decisions all.
Peace out.
Ethereum Technical Analysis | August 8, 2025📊 Ethereum Technical Analysis | August 8, 2025
Ethereum has shown a strong bullish reaction after bouncing from the key $3,893 support zone, confirming the move with a solid bullish candle. If this support holds and further bullish signals appear, the next upside targets will be:
$4,088
$4,140
And potentially $4,291.
🔻 However, if the $3,893 support fails and price closes below it, the next important support to watch is around $3,757, which could act as a barrier against deeper declines.
📌 Summary:
Holding above $3,893 keeps the bullish scenario alive for Ethereum, while losing this level may increase selling pressure. Mark these key levels on your chart to make more precise trading decisions.

Market update for EthereumThe price managed to hold above the weekly pivot point, triggering growth according to the bullish (green) scenario. At this point, the price has reached the first two targets and set a new local high. However, it is now in a resistance zone, and only 4% remains before breaking a key level.
If the 4,116 level is broken, the path toward 4,600 will open, potentially leading to a new ATH. But if the price breaks below 3,736 , the bearish (orange) scenario is likely to play out, and the price may start to decline.


ETHUSDTConsidering Ethereum’s movement steps, 4320 is the end of Ethereum’s second leg. As big whales are adding to their holdings and there is a lot of optimism, we would expect to see higher numbers for Ethereum in the long term.

my view on ethAfter carefully observing the current ETH price structure, I’m leaning toward a bearish bias in the short to mid-term.
As always, this is not financial advice — just sharing my personal view based on market structure and price action. Risk management remains the most important tool in this game.

ETH – Possible Pullback After Sharp Rally | Watching Buy ZoneAfter a strong breakout toward the 4014 USDT area on ETH/USDT, we might be seeing signs of a local top forming. Based on technical analysis, I’m watching for a potential pullback to the support zone around 3447 USDT, which is where I’ve placed a Buy limit order.
Key levels:
Sell zone: 4000–4100 USDT (already reached) SELL NOW
Buy zone: around 3447 USDT (waiting for possible dip)
Strategy: Buy the dip and prepare to sell on the next upward move
🔁 Repeating the cycle: Buy low – Sell high
⚠️ This is not financial advice – just my personal market view.
Let me know in the comments if you’re watching similar levels or using the same kind of strategy.
Trade active
Trade was activated
ETH | Ethereum Game Plan - Swing Long IdeaETH | Ethereum Game Plan - Swing Long Idea
📊 Market Sentiment
Market sentiment remains bullish, supported by expectations of a 0.25% rate cut at the upcoming FOMC meeting. The weakening USD and rising risk appetite across global markets are favoring crypto assets in particular.
📈 Technical Analysis
Price swept the range low (Weekly Fair Value Gap), resulting in a deviation.
It then aggressively reclaimed higher levels and closed above key resistance.
A 12H demand zone was formed during this move.
We’re now seeing a retracement towards that 12H demand zone.
📌 Game Plan
I’m looking for price to hit the 12H demand zone at $3,530 and show a strong reaction.
This level is also below the 0.5 Fibonacci retracement, placing it in the discount area — an ideal entry zone for me.
🎯 Setup Trigger
After price taps the demand zone, I want to see a 1H–4H bullish break of structure to confirm the reversal before entering.
📋 Trade Management
Stoploss: Below 1H–4H swing low
Targets:
• TP1: $3,872
• TP2: $4,090
I’ll trail my stop to lock in profits aggressively as price moves in my favor.
💬 Like, follow, and comment if this breakdown supports your trading!
More setups and market insights coming soon — stay connected!

Sell Short trade Good probability in eth to sell off daily and weekly
has bearish diversion and price took liquidity from recent top

Ethereum is seeking to break through the $4k ┆ HolderStatKUCOIN:ETHUSDT recovered from a swift correction into rising trend support and is pressing back toward the 3.76–3.80k pivot. The broader pattern shows sequential triangle breakouts and a strong sideway accumulation that launched the last vertical leg. If 3.55–3.60k holds on dips, targets sit at 3.85k, 3.95k and the round‑number magnet at 4k. Only a decisive daily close beneath 3.50k would threaten the higher‑low sequence and re‑open 3.35k–3.40k. With breadth improving, the bias remains upward while price consolidates beneath resistance.

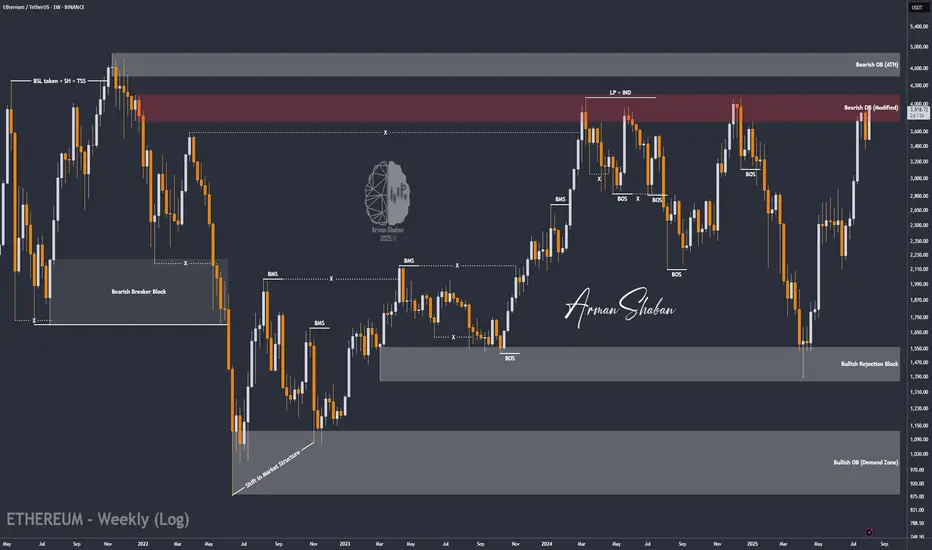
ETH/USDT | ETH Surges 18% – Next Targets Above $4000 in Sight!By analyzing the Ethereum chart on the weekly timeframe, we can see that, as expected, the price continued its rally, gaining over 18% and reaching $3969. It is now trading around $3915, and I expect this bullish momentum to continue, with the price soon pushing above $4000. The next targets are $4100, $4400, and $4900. This analysis will be updated soon!
Please support me with your likes and comments to motivate me to share more analysis with you and share your opinion about the possible trend of this chart with me !
Best Regards , Arman Shaban
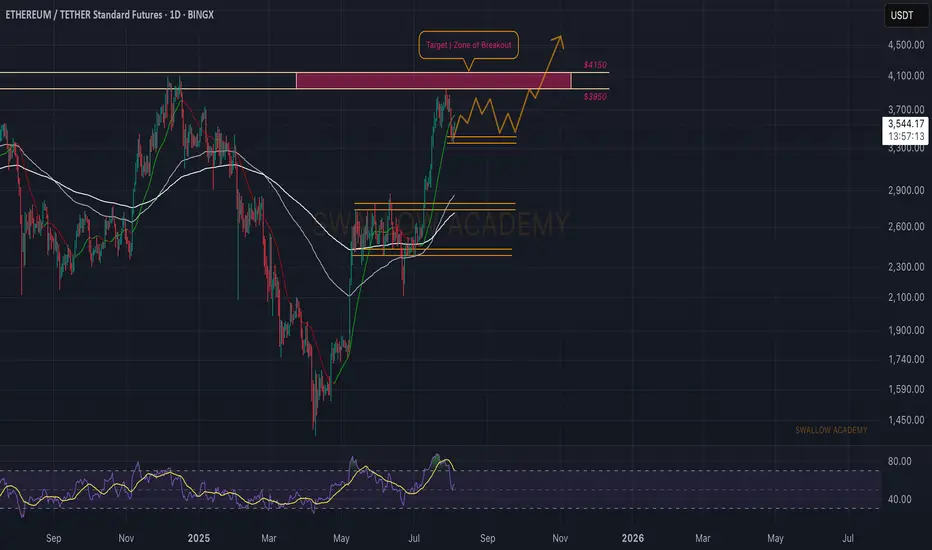
Ethereum (ETH): Zone of Rejection Turning Into Zone of BreakoutSince last time, we were looking for a zone of rejection, which happened as well, where price had a smaller pullback, and now upon the start of a new week, we might be seeing the start of recovery as well.
Which means, as long as we are above the $3,350 zone (which is the local low area), we are bullish; if we break that zone, this would be the ideal area for a short!
Swallow Academy
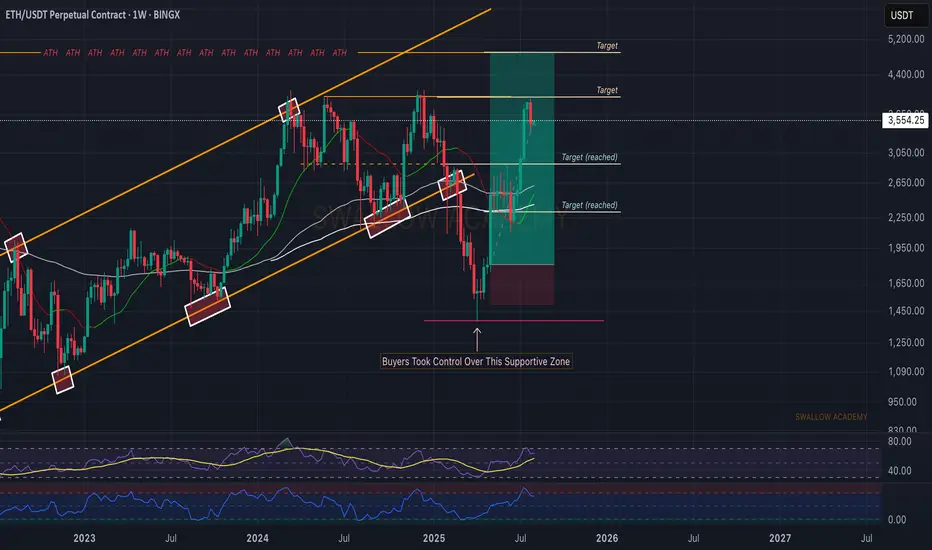
Ethereum (ETH): Looking For Break of $4000 | We Are BullishETH is still bullish in our opinion;recently we had a really good upside movement that got stopped right before reaching the $4000 zone.
Now we had a smaller pullback, which is normal as we had a really strong upside movement so we see it as a natural pullback, which will give us another bounce opportunity (accumulation zone).
Since our entry we have had a good movement, and we are keeping the position open until we reach the ATH zone!
Swallow Academy
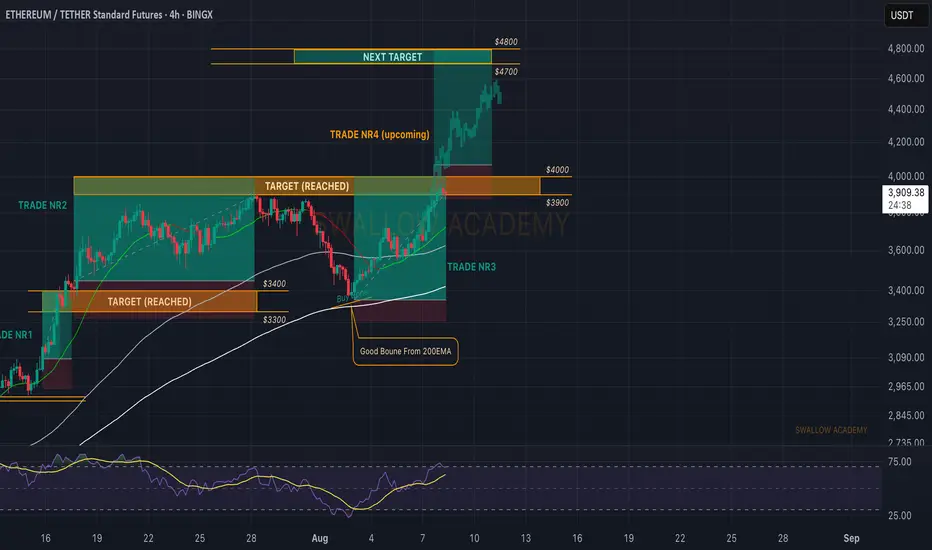
Ethereum (ETH): Caught 45% of Movement in Total | $4800 Is Next3 trades we had on ETH, in combined 45% of market price movement. Now that we are at the end of the current week, we are going to look for a proper breakout from $4000, where then we will be opening yet another long with the target being at $4800.
Swallow Academy
[SeoVereign] ETHEREUM BEARISH Outlook – August 10, 2025In this idea, I would like to present a bearish perspective on Ethereum.
This perspective was derived based on the Elliott Wave Theory.
Until this pattern is confirmed, I have been continuously tracking the Elliott Waves and adding reasons for the bearish scenario one by one.
As a result, I have concluded that the next major move is likely to be downward, and while searching for a specific entry point, I detected the recent trendline break.
If this wave is clearly confirmed, I believe there is a high possibility of a decline to around the average take-profit level of 3763 USDT without much difficulty, and therefore, I am considering entering a short position.
All the details have been drawn on the chart, so please refer to it.
Thank you very much for reading, and as time goes by and the chart becomes clearer, I will continue to update this idea accordingly.
Thank you.

ETH Important Update 08.08.2025🚀 #ETH Update 🚀
This is the third attempt on the major timeframe for ETH to break through this yellow resistance zone. 📊
I strongly believe that this time ETH has a high chance to break it.
📌 Possible Scenario:
* ETH pushes up to this zone
* Small retracement 🔄
* Then a strong breakout 💥
We’ll monitor closely to catch the move.
⚡ Important Point:
If ETH starts retracing while:
1️⃣ Bitcoin stays in range
2️⃣ Bitcoin dominance drops 📉
➡️ Then we could see a solid rally in TOTAL3 (altcoins excluding ETH) — meaning a lot of altcoins will have good upside potential.
💡 Be prepared with liquidity — opportunities don’t wait! Insha’Allah, we’ll ride this wave together. 🌊
🔥 Stay focused. Stay ready. This could be the moment the market wakes up!

ETH Testing Critical $4K Resistance!BINANCE:ETHUSDT is trading inside an ascending triangle on the weekly chart, with price compressing between the resistance line and a rising support line. After a strong rally from the $1,500 demand area, ETH has reclaimed the 100- and 200-week EMAs and is testing the triangle’s upper trendline with increasing volume.
A weekly close above $4,000–$4,200 would confirm a triangle breakout and open upside toward $6,000–$7,500, while a rejection could send price back toward $3,200–$3,000 for further consolidation. Wait for a clear weekly close and volume confirmation.
Cheers
Hexa
BITSTAMP:ETHUSD CRYPTOCAP:ETH

Long trade
15min TF overview
🟩 Trade Type: Buyside Trade
Pair: ETHUSDT
Date: Sunday, 3rd August 2025
Time: 5:15 PM
Session: London–New York Overlap (LND Session PM)
Timeframe: 15 minutes
🔽 Entry Parameters
Entry Level: 3,455.23
Stop Loss: 3,436.73 (-0.54%)
Take Profit: 3,877.00 (+12.21%)
Risk-to-Reward (RR): 22:8
📉 Market Structure & Technicals
Trend Context:
Price reversed from a steep bearish trend and showed signs of a bullish momentum shift.
EMA/WMA Levels:
EMA (blue) and WMA (yellow) show a bullish crossover at the point of entry
Both MAs began to slope upward, confirming the trend shift.
Liquidity Observations:
Clean sweep of prior lows below 3,500 preceding entry.
Price traded back into a premium zone after reacting from a deep discount.
🧠 Narrative / Rationale
Set up Narrative:
ETH completed a strong downtrend and printed a bullish market structure shift (MSS) on the 15-minute TF. Entry was taken after price reclaimed the (POI) and confirmed a higher low.
Current Status: Trade in progress, profit levels partially hit.
TP aligns with the previous supply zone or relatively equal highs around 3,784.
Additional liquidity above 3,877–3,915 for extended targets if trade continues.

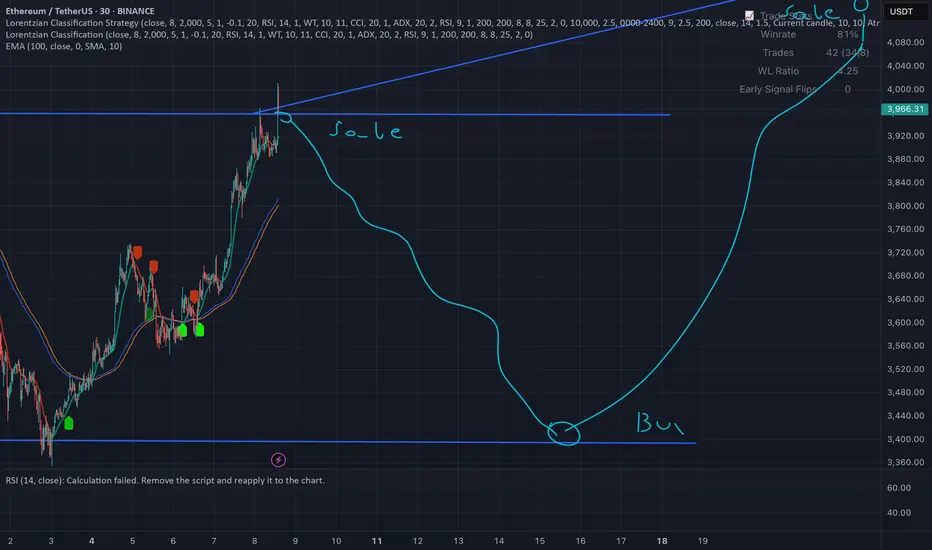
ETH updateIF you remember this:
Current chart show prospective, not targets (sure they are), but step-by-step)
Good luck

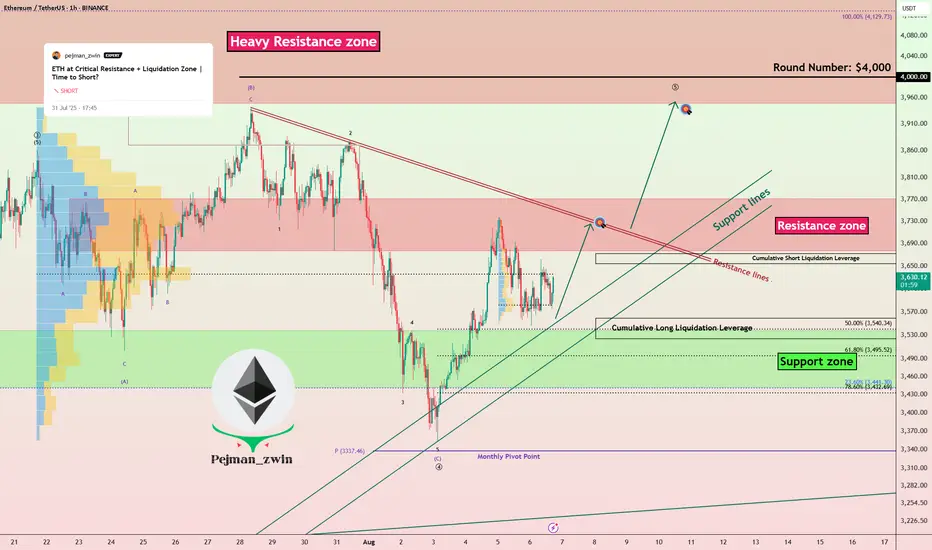
Ethereum Ready to Attack Resistances — Time to Long ETH?Ethereum ( BINANCE:ETHUSDT ) fell to the Support zone($3,538-$3,442) and Support lines as I expected in the previous idea .
Ethereum is currently trading near the Support zone($3,538-$3,442) , Support lines , and Cumulative Long Liquidation Leverage($3,559-$3,524) .
In terms of Elliott Wave theory , it seems that Ethereum has completed the main wave 4 . The main wave 4 has an Expanding Flat structure(ABC/3-3-5) . To confirm the main wave 4, we must wait for the Resistance zone($3,771-$3,677) and Resistance lines to be broken.
I expect Ethereum to trend higher in the coming hours and attack the Resistance lines and Resistance zone($3,771-$3,677) .
Cumulative Short Liquidation Leverage: $3,672-$3,645
Note: Stop Loss: $3,450 =Worst
Please respect each other's ideas and express them politely if you agree or disagree.
Ethereum Analyze (ETHUSDT), 1-hour time frame.
Be sure to follow the updated ideas.
Do not forget to put a Stop loss for your positions (For every position you want to open).
Please follow your strategy and updates; this is just my Idea, and I will gladly see your ideas in this post.
Please do not forget the ✅' like '✅ button 🙏😊 & Share it with your friends; thanks, and Trade safe.