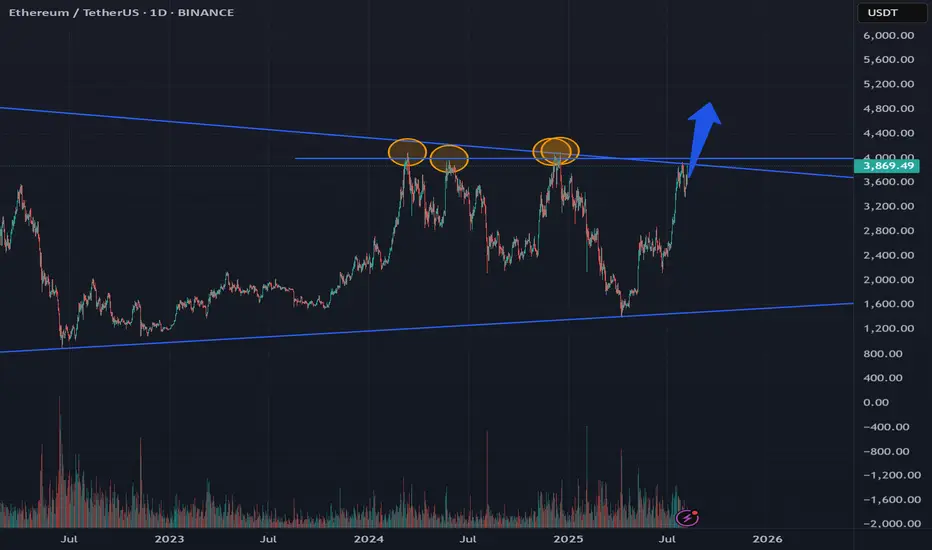
ETH updateIF you remember this:
Current chart show prospective, not targets (sure they are), but step-by-step)
Good luck
USDTETH.P trade ideas

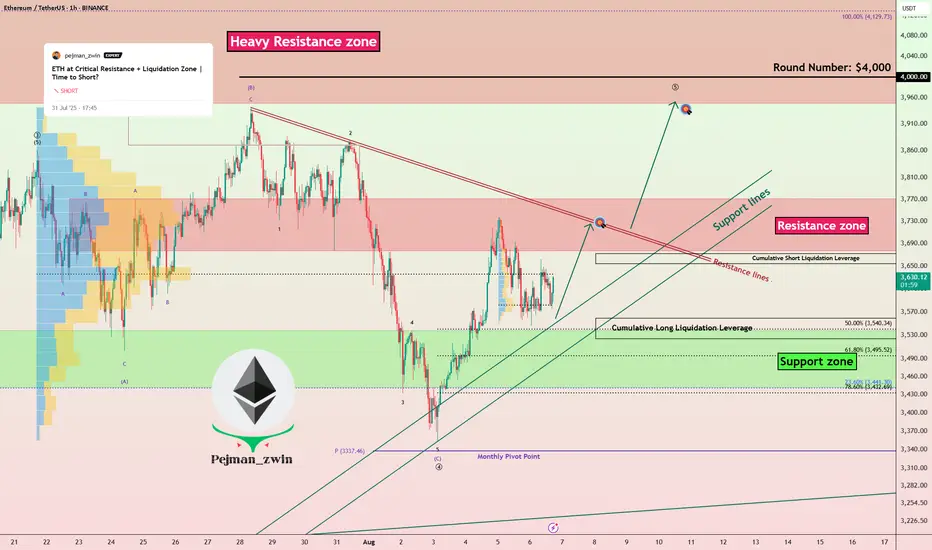
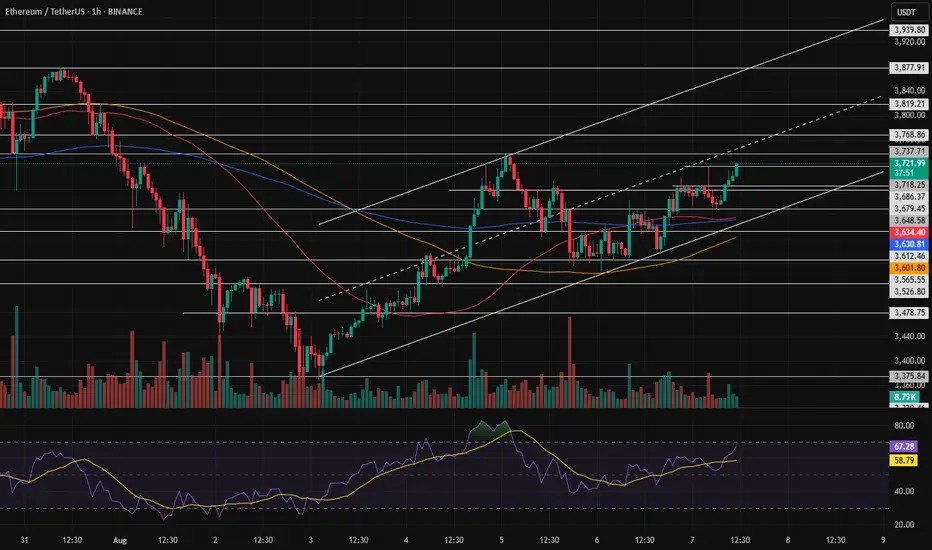
Ethereum Ready to Attack Resistances — Time to Long ETH?Ethereum ( BINANCE:ETHUSDT ) fell to the Support zone($3,538-$3,442) and Support lines as I expected in the previous idea .
Ethereum is currently trading near the Support zone($3,538-$3,442) , Support lines , and Cumulative Long Liquidation Leverage($3,559-$3,524) .
In terms of Elliott Wave theory , it seems that Ethereum has completed the main wave 4 . The main wave 4 has an Expanding Flat structure(ABC/3-3-5) . To confirm the main wave 4, we must wait for the Resistance zone($3,771-$3,677) and Resistance lines to be broken.
I expect Ethereum to trend higher in the coming hours and attack the Resistance lines and Resistance zone($3,771-$3,677) .
Cumulative Short Liquidation Leverage: $3,672-$3,645
Note: Stop Loss: $3,450 =Worst
Please respect each other's ideas and express them politely if you agree or disagree.
Ethereum Analyze (ETHUSDT), 1-hour time frame.
Be sure to follow the updated ideas.
Do not forget to put a Stop loss for your positions (For every position you want to open).
Please follow your strategy and updates; this is just my Idea, and I will gladly see your ideas in this post.
Please do not forget the ✅' like '✅ button 🙏😊 & Share it with your friends; thanks, and Trade safe.
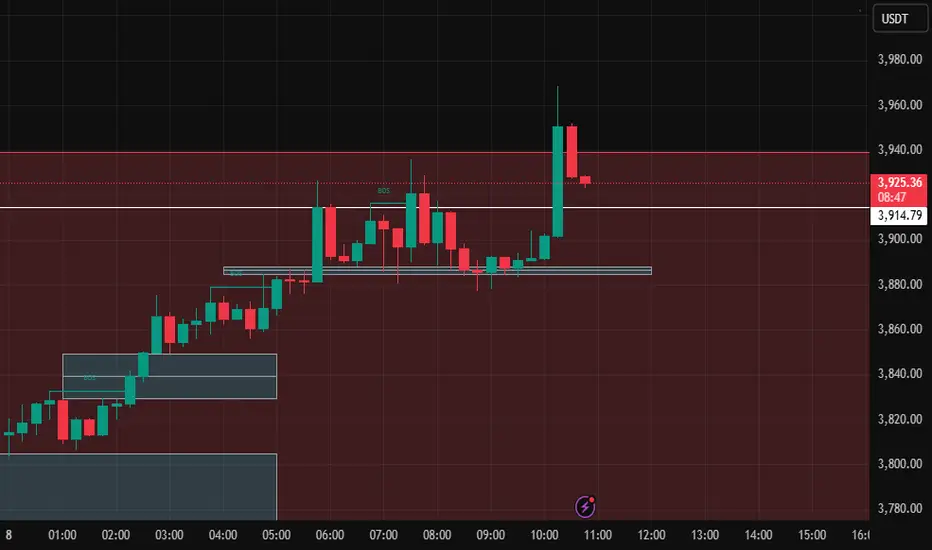
As ExpectedAs expected in the previous analysis and earlier ones, the price has been climbing toward the 4000 level.
However, it hasn't touched 4000 yet.
For now, it’s interacting with the **3,942.13** level, which could be an important support.
If the price fails to hold this level, we might see some short-term bearish movement.

ETH-----Sell around 3905, target 3850 areaAugust 8th ETH Contract Technical Analysis:
Today, the long-term daily chart closed with a small bullish candlestick pattern, with consecutive bullish candlestick patterns and a single bearish candlestick pattern. The price is above the moving average, and the accompanying indicator shows a death cross with shrinking volume. The overall upward trend is very clear, but the current price is deviating from the moving average, so traders should be aware of the risk of a large pullback. There are also news and data stimuli. The short-term hourly chart shows a pattern of oscillating upward movement, with prices continuing to break higher. The more such a trend is, the more we need to pay attention to the support level of the pullback. This is crucial. Many friends want to sell, and that's fine, but you must not be greedy. Only short-term trading is necessary. If you can't do it, don't do it. Currently, the price is under pressure, with consecutive bearish candlestick patterns and the accompanying indicator showing a downward death cross. A pullback is also important for the day.
Today's ETH Short-Term Contract Trading Strategy:
Sell at the current price of 3905, with a stop loss at 3935 and a target of 3850.

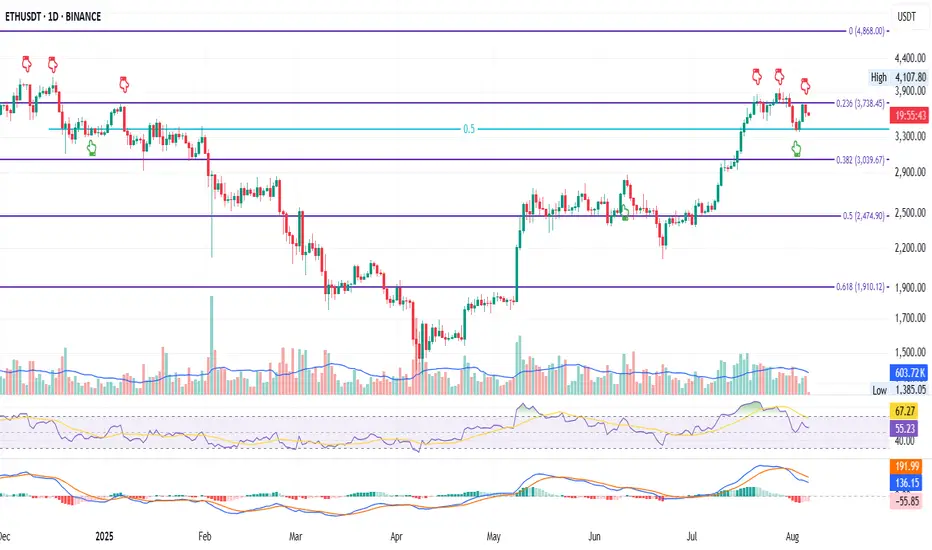
ETH Daily: Lower High, Lower Low. That Was My Signal
This is ETH on the Daily
Price action today looks very similar to December 2024.
Back then, ETH attempted twice to flip the 0.236 Fib level at $3378.45 — first on Dec 6, then on Dec 12. Both failed. Price found support at the 0.5 (midpoint between the 0.236 and 0.382), bounced, got rejected again at the 0.236, then went lower.
Now, we’re seeing a near-identical pattern:
– First attempt to reclaim the 0.236 Fib on July 21
– Second attempt on July 27
– Both failed
– Price found support again at the 0.5 middle level
– Bounced back to the 0.236
– Got rejected again
What will happen this time?
For me, the answer already came: we’ve now seen a lower low followed by a lower high — a temporary break of bullish structure. That’s my cue to scale out of my long and reduce exposure so I’m not caught off guard overnight.
Now that I’ve done that, I can observe the chart objectively without emotional bias or panic-selling.
Technically, ETH is in a short-term downtrend.
Fundamentally, however, I believe we’re in the early stages of a larger uptrend, driven by strong bullish news around crypto (happy to list them if you're curious).
But until those bullish narratives start kicking in and price moves up again, I have to be extremely careful not to get wiped out — so I’ll stay closely aligned with price action.
Like I said: short-term downtrend, long-term opportunity.
Always take profits and manage risk.
Interaction is welcome.
Cracks in my systemCracks in my system
- Re entries and on weak swings.
- If stopped out, the book stipulates, Don't take a re-entry. What did this kunt do with ETH last night? He re-entered a short.
- Be content with a weekly 2%ROI objective The Leader says. What did I do? again, had more than the weekly objectives met and somehow found away to messing up.
A note to myself.
This is (July and August) the consistent I have ever been since buying my first Crypto back in December 2024, about 6 months of learning to trade. I am getting better.
ETH 1H – Retest in Play, But Can Bulls Push Past 3.95K?Ethereum has tapped into the 3.95K resistance zone after a strong upward run, with Stoch RSI now cooling off from overbought levels. Price action suggests a potential pullback toward the 3.77K–3.78K support zone, which aligns with prior breakout structure and moving average support.
If buyers defend this retest, momentum could carry price through the 3.95K barrier and open the door for continuation toward 4K+. Failure to hold the lower zone, however, may trigger a deeper correction into the mid-3.6K range.
Key watchpoints:
– Retest of prior breakout level at 3.77K
– Stoch RSI oversold potential bounce setup
– Clear resistance overhead at 3.95K to break for further upside

Ethereum Forms Symmetrical Triangle and Bullish PennantETH is currently consolidating in a symmetrical triangle - a narrowing range created by alternating lower highs and higher lows. This pattern is considered neutral, but when broken through it usually gives a strong impulse to movement, you also need to take into account the information from the previous analysis of ETH
A pennant is also being formed - after a strong impulse, the price contracts, creating a small narrow channel (pennant), which often continues to move in the same direction after the breakout
Current price: $3.684
Probable price of the upper breakout from $4100 to $4800, then most likely there will be a small price drop
The probability that we will go down is extremely small now, but the price may fall to the level of $3400 or $3300
ETHUSDTPreferably suitable for scalping and accurate as long as you watch carefully the price action with the drawn areas.
With your likes and comments, you give me enough energy to provide the best analysis on an ongoing basis.
And if you needed any analysis that was not on the page, you can ask me with a comment or a personal message.
Enjoy Trading ;)

ETH | Short | 3hrs This technical analysis is for informational and educational purposes only. It does not constitute financial advice. Remember to always research and consult with a professional before making investment decisions. Good luck! 📈💼🚀

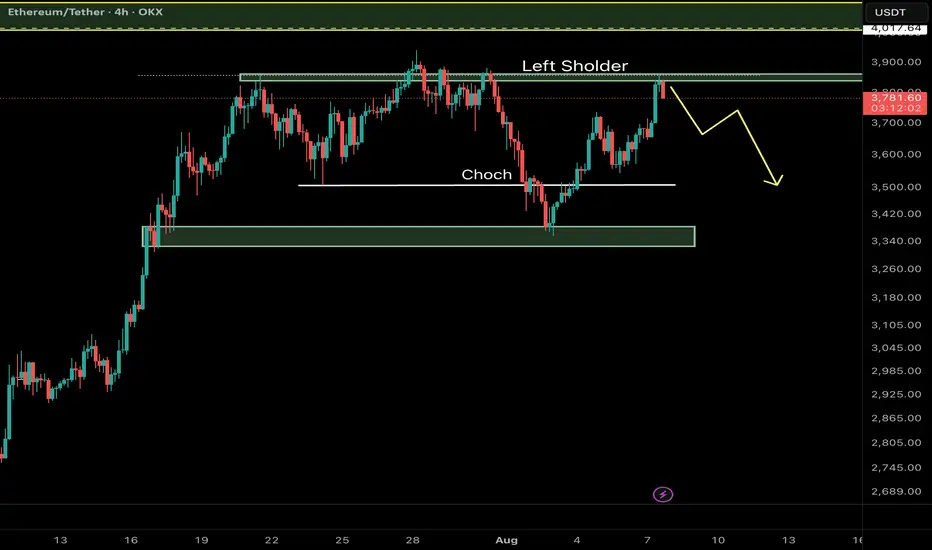
Ethereum (ETH/USDT) – Key Reversal Zone RetestAfter a major CHoCH (Change of Character) on the 4H timeframe, Ethereum has shown a strong bullish move from a high-probability demand zone and is now retesting a critical resistance area aligned with the Left Shoulder of a classic RTM pattern.
⸻
🔍 Key Technical Elements:
• CHoCH confirms the shift from a distribution phase to accumulation.
• Strong reaction from a demand zone near $3,340–$3,380.
• Price is now testing the Left Shoulder, which often acts as a reaction zone before continuation.
⸻
📌 Potential Scenarios:
🔼 Bullish Case (Primary):
If ETH breaks and closes above $3,870, a move toward the next liquidity pool around $4,010–$4,050 is likely.
🔽 Bearish Case (Alternative):
Failure to hold above the current resistance may lead to a pullback toward the $3,340–$3,380 demand zone for another accumulation attempt.
⸻
💡 Educational Note:
In RTM methodology, retests of the Left Shoulder after CHoCH are considered one of the most efficient entry zones — especially when confluence with liquidity voids or imbalance exists.
Follow for more Smart Money & RTM insights.
ETH Breakout Strategy
🚀 ETH Breakout Strategy 🔥
♦️ As mentioned before, the long position on ETH/USDT had to be placed before the 0.03277 breakout on ETH/BTC.
✅ Simultaneously, ETH.D broke above 12.16%, adding strong confluence to the bullish setup.
⭕️ The final confirmation came when ETH/USDT broke above 3724.00 – a high-probability entry for trend-followers.
💎 Missed it? Don’t worry.
🔜 The next long setups will be:
1. Break of 3900.00
2. Followed by the break of 4000.00 – which is probably to break impulsively and sharply.
♦️ Until ETH drops below 3300.00, I remain bullish-biased and will look only for long setups.
Even if I miss potential short-term short opportunities, it's not an issue.
❗️Why?
Because my strategy is based on aligning with the higher timeframe trend – and for me, that’s the 1D cycle, which is currently bullish.
🔥 In trading, patience with direction beats chasing every move.
🚀 If you value clean structure-based analysis, hit the rocket, drop a comment, and don’t forget to follow for more crypto insights!

ETH Started Another Impulsive Wave!ETH Started Another Impulsive Wave!
Today ETH ended another bullish wave and is expected to rise further.
The price reaction looks good so far. The market is expecting a rate cut by the FED during the September meeting. According to Reuters, the chances of a rate cut by the FED increase to 85.5%.
It seems that the cryptocurrency market is also absorbing the news and ETH could benefit from this volume in the short term to rise to 3850.
You may find more details in the chart!
Thank you and Good Luck!
PS: Please support with a like or comment if you find this analysis useful for your trading day

Ethereum Long Trigger Just Got Valid — Don’t Miss This SetupHey, it’s Skeptic from Skeptic Lab.
In this breakdown, we’re looking at a fresh long opportunity on Ethereum after a clean 45% move from our last trigger.
I’ll walk you through the daily and 4H timeframes, explain why the correction looks weak, and where the next breakout trigger is setting up.
Plus, I’ll show you how ETHBTC can help confirm the move and improve your risk/reward.
If this gave you clarity or value, give it a boost — and I’ll catch you in the next one.
Disclaimer: This is not financial advice. Always do your own research before making any trading decisions.

Ethereum is consolidating ┆ HolderStatBYBIT:ETHUSDT is trading within a consolidation zone just under $4000 after rallying from sub-$3000 levels. The trend remains strong with prior triangle and consolidation patterns fueling upward moves. A continuation breakout may test the $4000 barrier soon.

Should we expect Ethereum price growth?Ethereum is moving back towards $4,000 after the pull-back I said earlier. Will this level finally be broken and the queen of crypto will move towards $5,000? I think it depends on many parameters. There is news that money is flowing into altcoins. If the $4000 level is broken with strong volume, we should expect good news for this popular digital currency.

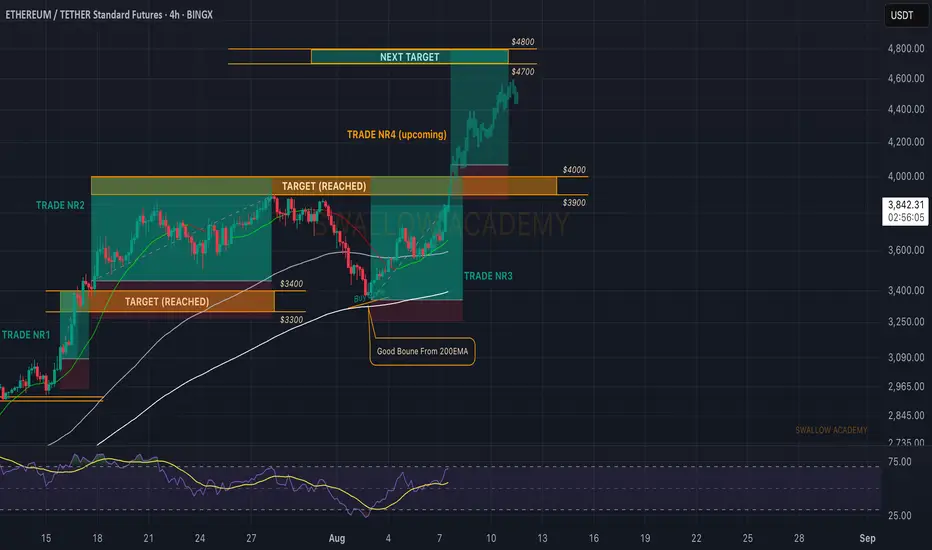
Ethereum (ETH): On Fire, Heading For Another Breakout Attempt ETH is on fire, where the price is catching the buyside momentum and probably going for that $4000K breakout attempt once again, where our trade will be closed as well (in the region of $3950-$4000).
So we wait for that zone to be reached and once we break it there, we will be looking for another entry for a long to $4800!
Swallow Academy
ETH Highly chance to go bearish Basic structure levels are indicating the sell there's a huge supply to sell

Ethereum ETH at Key Resistance: Here's My Trade PlanEthereum (ETH) has maintained a fairly bullish structure overall 🟢, but price is now trading into a significant resistance level 🧱📈. I’m closely monitoring for a reaction at this zone — ideally a rejection that leads to a pullback into a key support area 🔄📉.
If ETH finds support and we get a clean bullish break in market structure from there 📊🚀, that could present a high-probability setup to the long side — contingent on price action confirming the bias. 🔍 Not financial advice ⚠️.

ETH ~ Ive given him some laxatives!okay, me giving him laxative means you know what gonna happen and till where it gonna fall loololl
The 3738.28 zone is the golden pointAfter confirmation in this price zone, we can say that the path to 3800 becomes much easier and more likely, making the move toward 4000 more feasible. However, it's still too early to make decisions about that, so for now, we're only analyzing up to 3800.
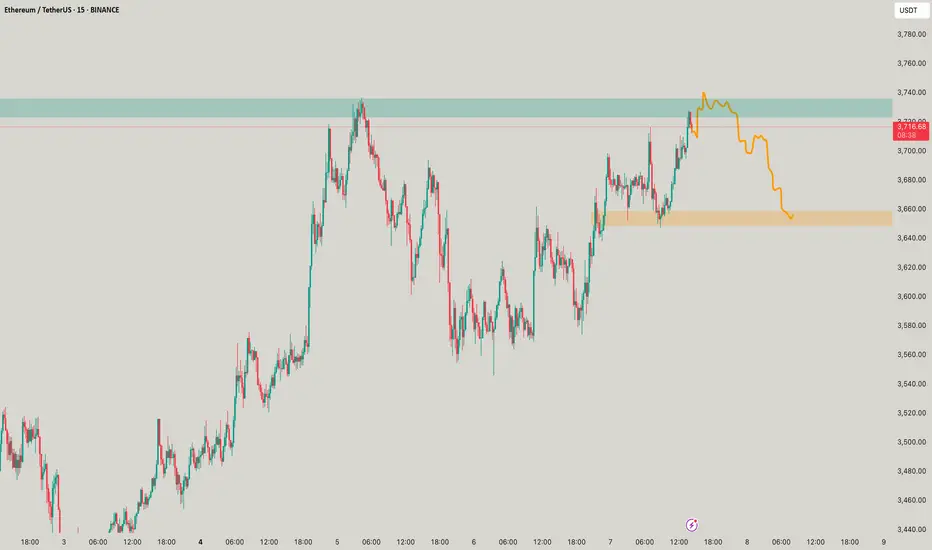
ETH/USDT Short Setup – Bearish Rejection from Supply Zone!Ethereum is showing signs of weakness after getting rejected from a key 1H supply zone between $3,680 – $3,720. Price failed to break above this level and has started pulling back, suggesting potential downside momentum.
🔍 Technical Breakdown:
Supply Zone (Resistance): $3,680 – $3,720 (Highlighted in blue)
Current Price: $3,666 (Rejection candle forming below resistance)
Immediate Support (TP1): $3,552 (previous structure support)
Key Demand Zone (TP2): $3,417 – $3,342 (strong buying interest previously seen here)
❌ Rejection Evidence:
Price tapped into high-volume area and sold off
Lower highs forming after rejection
Bearish engulfing candles starting to show on 1H
📌 Trade Idea:
If price stays below $3,680 and breaks below $3,640:
Entry: $3,660 – $3,670 (current price zone)
SL: Above $3,720 (above supply zone)
TP1: $3,552
TP2: $3,417
TP3 (Max target): $3,342
🧠 Notes:
Watch for clean break of $3,552 to confirm momentum
Retest of broken support could offer a second entry
ETH remains volatile – use good risk management
🔴 Bias: Bearish Until $3,720 Is Broken

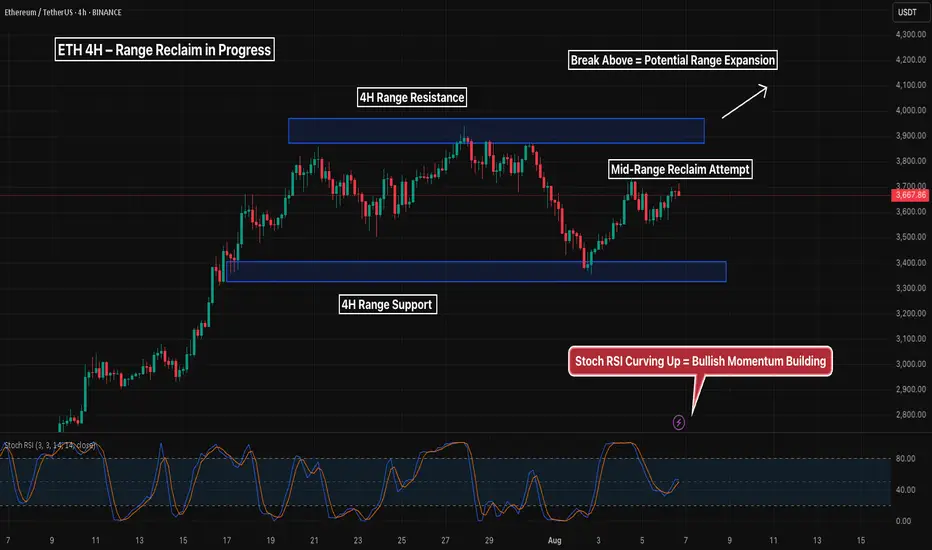
ETH 4H – Range Reclaim in Progress, But Can Bulls Break the Top?Ethereum continues to respect the clean horizontal 4H range between ~3350 (support) and ~3950 (resistance), with price now attempting a reclaim of the mid-range following a strong bounce from demand.
Stoch RSI is curling upward, suggesting building bullish momentum — but the real test lies in the upper supply zone, where price has failed several times before.
If price can flip mid-range into support and reclaim the highs with volume, this opens the door for potential range expansion and trend continuation.
Key points:
– Strong bounce from range support
– Mid-range reclaim attempt underway
– Watch for reaction at 3950 resistance
– Stoch RSI rising from bottom = bullish confluence
Until the top breaks cleanly, this remains a range-bound environment — so be prepared for both scenarios. Next moves will define the weekly trend.