ETH 1D Analysis - Key Triggers Ahead | Day 27❄️ Welcome to the cryptos winter , I hope you’ve started your day well.
⏰ We’re analyzing ETH on the 1-Day timeframe
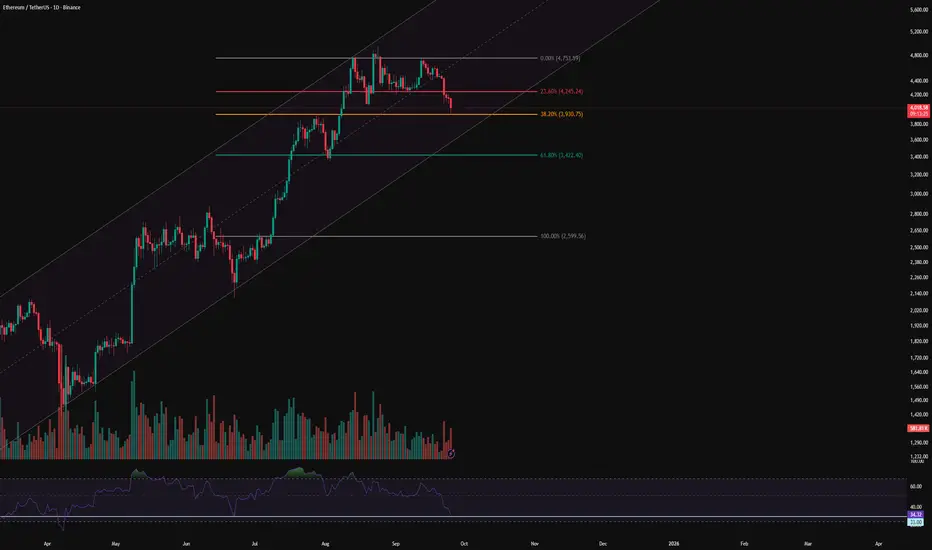
👀 On the daily timeframe we observe that Ethereum is trading inside a strong ascending channel. Currently, after touching the channel top, price moved toward the midline, lost the midline, and is now heading toward the channel bottom. Ethereum reacted once at the 38% Fibonacci zone, but selling pressure is increasing, and with losing this support level around $3,930, ETH can move toward the channel bottom and even lower support levels.
🎮 The Fibonacci retracement is drawn from the $2,600 breakout area up to the all-time high of Ethereum, which clearly covers all the support and resistance zones. At this stage, Ethereum has reacted to the 38% Fib level, but with losing this area it could move toward the key support overlapping with the channel bottom. The 38% zone observed in this analysis has high validity in daily price action, and with breaking this area we can open a short position.
🧮 Looking at the RSI oscillator, after creating a new all-time high, Ethereum entered selling pressure and is now near its oversold area. Our key RSI zone is also located here. With a cross below 33, Ethereum could experience a deeper correction and fully enter the oversold range.
🕯 The size and volume of red candles for breaking Fibonacci zones usually happen in a whale-driven manner. Normally, before the move, one or two opposite stop-hunts with shadows (wicks) appear, and then the move continues. The recent candles Ethereum has formed show strong selling volume, and candle closes below the 38% Fib zone together with selling pressure can bring even more red candles.
🧠 For an Ethereum position, it seems better to wait until whales and sharks of the market finish their stop-hunts. On the third touch, for example, with a break of the 38% Fib zone and entry of ETH into the oversold RSI area, we can open a sell position.
💡 Keep in mind that today the U.S. labor market has strengthened significantly, and there may be no signal of upcoming rate cuts in the next Fed meetings.
❤️ Disclaimer : This analysis is purely based on my personal opinion and I only trade if the stated triggers are activated .
USDTETH.P trade ideas
Ethereum $ETH similar price action to late JuneIt's not perfect look to see CRYPTOCAP:ETH losing the daily range
However, the current PA oddly reminds me of one from late June
RSI and AO are similar as well
The next few days will be interesting to see if they are trying to scare the paper hands before the generation run, or the generational run is getting postponed for now

ETH -- THE WOLf Hunts Below 3500ETH is chilling above $4150 right now…
but let’s be honest — a dip below $3500 is loading ⬇️📉
Here’s why:
• 🔴 The red zone = where bulls get trapped.
• 🟢 The green zone = where real support should show up.
• 📊 Bitcoin dominance is rising — classic confirmation that altcoins (yes ETH too 😅) are ready to bleed.
So yeah, don’t act surprised when ETH decides to take a little “vacation” under 3500.
Correction isn’t the end of the world… it’s just the market reminding us who’s boss 🐺😉
ETH HTF Butterfly HarmonicAs we can see, the Elliott Wave count for wave (V) is still incomplete. Combined with the Butterfly harmonic pattern, this suggests a target price in the range of $5,900–$6,400. The invalidation level is if wave (4) overlaps with the top of wave (1).

eTH-USDTEthereum ✔️
Exactly the same as the chart above
Solana and Ethereum are behaving very similarly 💰💰
If Ethereum manages to break the trend line
it could start an uptrend 🚀💰

ETH 1H Analysis - Key Triggers Ahead | Day 29❄️ Welcome to the cryptos winter , I hope you’ve started your day well.
⏰ We’re analyzing ETH on the 1-Hour timeframe .
👀 On the 1-hour chart , After breaking lower resistance zones, ETH started a strong bullish leg toward higher resistance. It reacted to these levels but moved upward with micro-buyer support. Currently at $4323, a key seller ticker zone—breaking this could push ETH higher. Note: Trend shows some weakness; sell candles are engulfed but smaller. Over 90% of holders are in profit, causing frequent stop-hunts on selling pressure.
🧮 RSI: After moving from near oversold to overbought, RSI is cooling near the 70 level. With increased long volatility, multiple buy positions could form, but rejection here may lead to a correction. Key static resistance is 70; swing support is at 50.
🕯 Volume & Candles: Recent candle size and volume surged as buyers entered, but approaching $4300 resistance shows trend weakness. Candle size decreased; profit-taking and minor pullbacks are possible. For trend continuation, higher volume and repeated buying pushing ETH toward overbought are needed.
📊 Liquidation Heatmap : Unlike BTC, long and short orders cluster sparsely, forming max-pain zones. ETH approaching $4380 could trigger a short squeeze and remove the seller ticker, pushing toward $4500. Next long max-pain is $4246, with lower support around $4100. ETH is in a near-decision zone with one bullish leg.
💸 ETHBTC Pair Currently in a trading range; the floor is Maker Buyer Zone , the ceiling is Taker Seller Zone. Price bounced well from the floor. High concentration of longs and shorts makes range boundaries critical—breaking either could trigger a sharp move. Price is near 0.037 resistance, RSI close to swing resistance. Buyer and whale support could enable another bullish leg; rejection may slightly increase risk of range breakdown.
🧠 Focus on BINANCE:ETHBTC wait for exit from the trading range, then check ETH/USDT. Often aligns with BTC dominance drops. Selling volume in ETHBTC is decent; if whales add volume, this setup provides optimal trade duration.
↗️ Risky Long Scenario: Break 0.037 resistance ETHBTC, BTC dominance drop, breaking ETH/USDT seller ticker, RSI stabilizes in overbought. Small stop-loss; trade is risky but viable.
📉 High-Risky Short Scenario: Rejection from current zone, ETH/BTC rejection, swing rejections, indecision candles multi-timeframe, SMA7 touch, and rising sell volume could signal short positions.
❤️ Disclaimer : This analysis is purely based on my personal opinion and I only trade if the stated triggers are activated .

ETH Pullback before ATH and AltseasonOver the past few months, ETH has been a beast. Now it needs to cool off before it can push to higher highs, igniting the broader altcoin market and the long-awaited "altseason."
Coinciding with an oversold RSI, I anticipate that we will see a "sell the news" event for next week's FOMC announcement on 9/17. This aligns with historic seasonality of September being a bearish month.
My forecast is that we pull back to the $3,900-$3,500 zone (.618 fib and 21 week EMA confluence) before pushing to higher highs.
IF ETH holds above $5k with volume, this will allow the broader altcoin market to pump, attracting massive liquidity to close out Q4 in euphoria.
Happy trading,
Melonfarmer

[SeoVereign] ETHUSDT BEARISH Outlook – October, 03 2025The key basis for presenting a bearish perspective in this idea is that the Crab pattern, one of the harmonic patterns, has been fully confirmed.
For clearer verification, I have directly plotted the relevant section on the chart for your reference.
For reference, the Crab pattern is an extended harmonic pattern with high volatility, typically forming point D at the 1.618 level relative to the XA wave, and is characterized by a strong reversal movement thereafter.
Due to these characteristics, it is evaluated as a highly reliable pattern within the Potential Reversal Zone (PRZ).
Accordingly, the average target price is set around 4,135.40 USDT.
Additional briefings will continue to be updated in this idea as the chart develops.

$ETH Bearish Short-Term (September 25, 2025)BINANCE:ETHUSDT
CRYPTOCAP:ETH Strong Bearish Pressure with Oversold RSI Signals
Overall Price Trend: ETH has experienced a sharp decline from recent highs around 4,700-4,800 USDT earlier in the period, now hovering near 3,472 USDT (as labeled on the chart). The recent candlesticks show a series of strong red (bearish) bars, indicating heavy selling pressure in the last few hours. This mirrors broader market weakness, possibly correlated with BTC's drop.
Ichimoku Cloud:The price is firmly below the cloud, a classic bearish setup signaling sustained downward momentum.
Tenkan-sen (red line) is below Kijun-sen (blue line) in a bearish crossover, and the cloud itself is thinning but still reddish and acting as overhead resistance. The Chikou Span (lagging line) is also below price action, reinforcing the downtrend.
RSI (Relative Strength Index): At the bottom panel, RSI is deeply oversold at 21.31—well below the 30 threshold. This suggests the selling has been exhaustive, potentially setting up for a short-term relief bounce. However, in a strong bearish context like this, it often just signals a pause rather than a full reversal.
Volume and Momentum: High volume on the red candles points to aggressive selling, with no immediate bullish divergence. The price is testing potential support around 3,400-3,450 USDT, but the momentum lines (like the blue trendline) are sloping downward sharply.
Summary: The chart remains Bearish dominantly, with the drop accelerating. The extreme oversold RSI adds a layer of caution for a possible pullback, but the Ichimoku setup keeps the bias downward.
Forecast Until Tomorrow (September 26, 2025):Based on the 2H chart, the bearish trend may continue in the coming hours, but with a small chance of rebound due to the deeply oversold RSI.
Here are the possible scenarios:
Base Scenario (Bearish, 75% probability): Price could test lower levels around 3,300-3,400 USDT if selling persists (especially if the cloud remains resistant). This would happen without a positive Ichimoku crossover or a strong green candle, and it's likely if broader market (e.g., BTC) stays weak.
Alternative Scenario (Mild Bullish, 25% probability): A short-term bounce to 3,550-3,650 USDT, if RSI climbs above 30 and price breaks the Tenkan-sen. This would be temporary, without changing the broader bearish trend.
To monitor, watch key levels: Support at 3,417 (recent low), resistance at 3,584 (near-term high). If ETH breaks below 3,400, it could accelerate lower; a close above 3,500 might signal temporary relief.

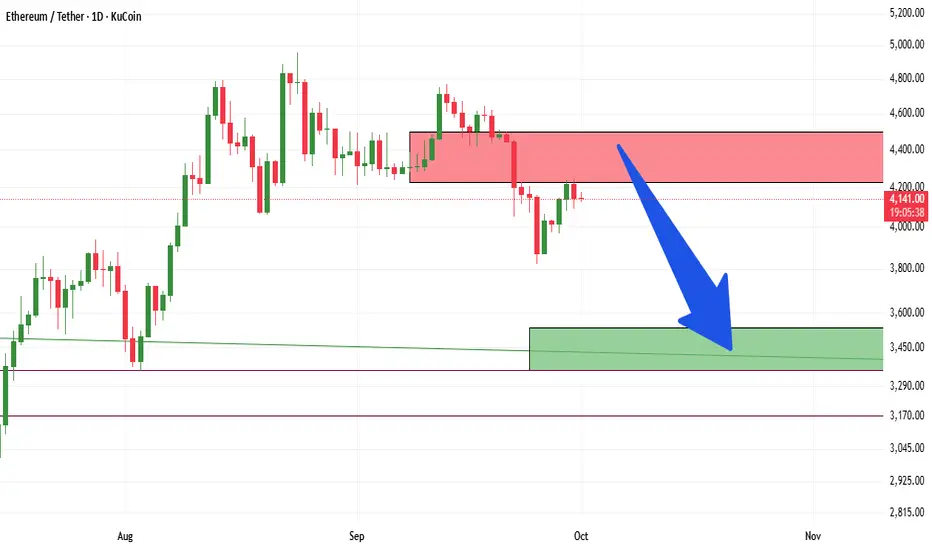
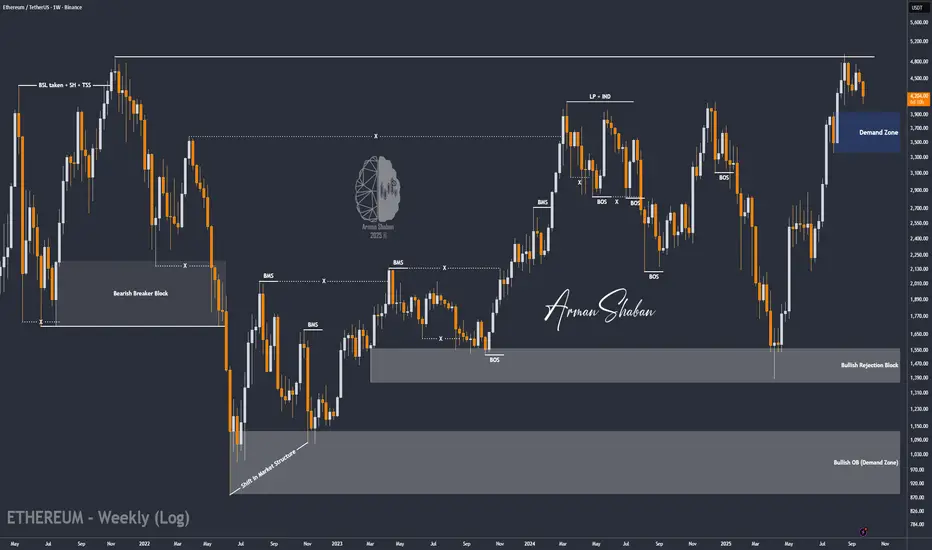
ETH/USDT | Correction Over? Big Rally Loading After Demand ZoneBy analyzing the Ethereum chart on the weekly timeframe, we can see that after Bitcoin’s heavy dump , ETH also corrected and is now trading around $4,200 .
Based on the previous analysis, the $3,300–$3,900 zone is still a key demand area. If the price enters this zone, I expect Ethereum to start its next bullish wave.
The possible upside targets for this rally are $5,100, $5,500, and $6,000.
Please support me with your likes and comments to motivate me to share more analysis with you and share your opinion about the possible trend of this chart with me !
Best Regards , Arman Shaban
We're setting up for the greatest Q4 for Ethereum $ETH so farMy CRYPTOCAP:ETH thesis is slowly playing out
Waiting for one more confirmation (reclaiming 4250 resistance), and we're setting up for the greatest Q4 so far for Ethereum
I'll be buying the dips with SL below the current HTF deviation low at ~3830
A bit more patience here, let it play out, don't rush it

Ethereum Recovery: Watching 4,229 for Bullish ConfirmationAt the moment, Ethereum is also showing recovery, but at a slower pace compared to Bitcoin. This week’s pivot point is at 4,137 , and the price is currently trading above it.
A local correction would be reasonable, with support expected in the 4,050 – 4,000 range. There’s also an ascending trendline acting as support. The risk level is 3,966 — if it breaks and the price fails to reclaim it, the likelihood of continued downside increases.
A breakout above 4,229 and consolidation would bring back a bullish outlook.

Never miss Eth on 4160 !I am all eyes on Eth to break my trigger line (around 4230). then the buy setup on 4160 will be activated :)
First midterm target --> 6300

ETH market snapshotETH has so far failed to break and hold above the key resistance at 4200. We remain within the local downtrend, and the chances of testing 3500 are increasing

#ETHUSDT 6H ChartPrice moved up from the 4h demand zone at $3,850 and it is currently getting rejected off a 6h supply zone. MACD is bullish, RSI is bought and EMAs are bearish. Price needs to break and close above this 6h supply to expect further upward movements towards the next 6h supply at $4,450.


Market idea based on the Harmonious Energy Flow (HEF) conceptAt the current stage, we can observe a clear manifestation of buyers’ strength, even though the market conditions are shifting rapidly without any significant price expansion. This creates a state of consolidation, where energy is being accumulated for the next move.
According to the HEF concept, consolidation represents a transitional phase — the market is searching for balance before moving into a new wave of directional flow. My current expectation is the transition towards the breakout moment, when price finally exits this consolidation zone and reveals the true side of strength.
📌 Key focus: monitoring how buyers sustain their advantage within this tight structure, and waiting for the signal of release from balance.
If you find my charting approach interesting, you are very welcome to connect for further discussion. I am open to dialogue and exchange of views.

ETHUSDT BUY AND HOLD ITI think it is a good time to buy Ethereum and hold it until higher targets. Ethereum has entered the weekly demand zone and has started its uptrend on the 1-hour and 4-hour time frames.

ETH Oversold Again – Is a Bounce Coming?Ethereum (ETHUSDT) on the 4H chart is showing signs of oversold conditions as the RSI once again dips below the 30 level. This setup has historically aligned with local bottoms, where ETH tends to bounce back shortly after reaching such extreme levels of selling pressure. The current price action around $4,170 highlights a critical zone to monitor for potential reversal.
If ETH can hold this level and buying momentum steps in, a relief rally could follow in the short term. However, if weakness persists, further downside retests cannot be ruled out. Traders should closely watch RSI recovery and volume confirmation for signals of a stronger rebound.

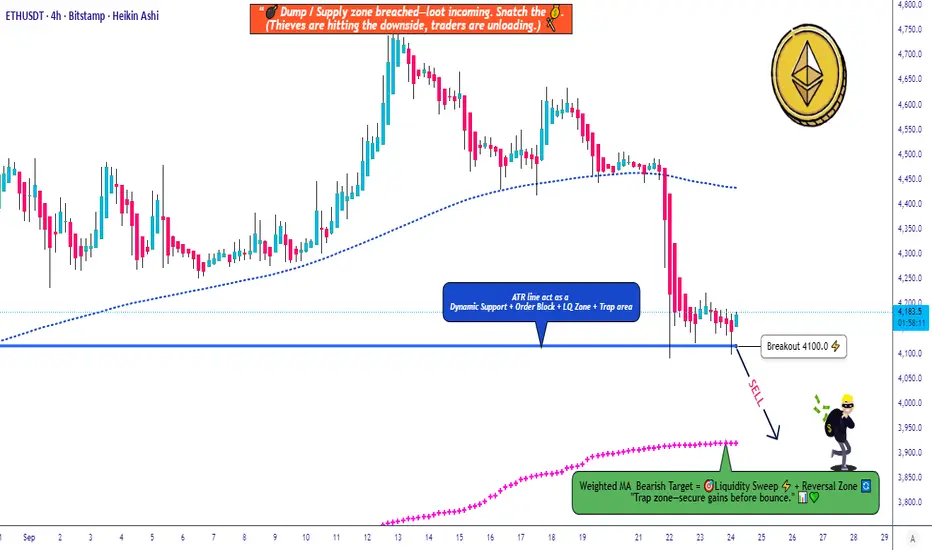
ETH/USDT Drop Plan Layered Entries + Smart EscapeETH/USDT 🚀 Market Wealth Strategy Map (Swing/Day Trade)
Market Outlook:
🔻 Bearish Confirmation: Watch for candle breakouts below the ATR Line @ 4100. This signals sellers gaining control — perfect for short entries.
Entry Plan (Thief Style 🕵️♂️):
💡 Multiple layered entries using limit orders (Thief layering strategy):
Sell layers: 4250 | 4200 | 4150 (adjust layers as per your own preference)
⚠️ Important: Set layer limit orders only after breakout confirmation. Do not enter blindly.
Stop Loss (SL):
⛔ Thief SL: 4300
Note: Dear Ladies & Gentlemen (Thief OG’s), SL is your choice — manage your risk and profits at your own discretion.
Target (TP):
🎯 Target: Weighted Moving Average Line (~3900) — strong support, oversold signals, and trap potential. Escape with profits before market catches you.
Note: TP is also your choice, manage money at your own discretion.
Related Pairs to Watch 🔗:
BINANCE:BTCUSDT : Correlated short setups, watch BTC for confirmation.
BINANCE:ETHBTC : Relative weakness/strength check vs Bitcoin.
BINANCE:BNBUSDT : Can provide additional trend confirmation in altcoin moves.
Key Points / Correlations:
ETH closely follows BTC sentiment; if BTC tanks, ETH likely follows.
Layering strategy allows flexible entries, reducing risk exposure.
Oversold + WMA support often signals profit escape zones for smart exits.
✨ “If you find value in my analysis, a 👍 and 🚀 boost is much appreciated — it helps me share more setups with the community!”
Disclaimer: This is Thief style trading strategy, just for fun.
#ETHUSDT #Ethereum #CryptoTrading #SwingTrade #DayTrade #ThiefStrategy #CryptoAnalysis #CryptoLayering #TradingViewIdeas #CryptoSetup
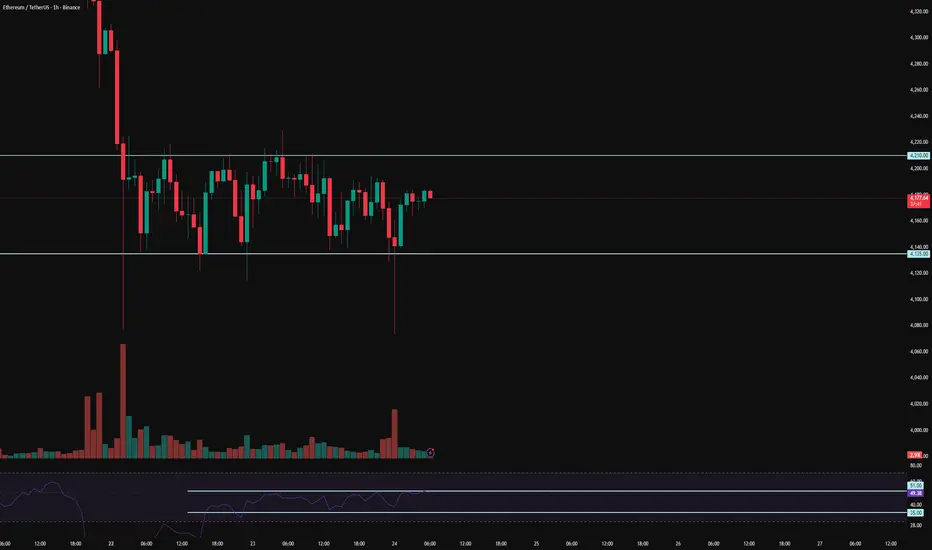
ETH 1H Analysis - Key Triggers Ahead | Day 26❄️ Welcome to the cryptos winter , I hope you’ve started your day well.
⏰ We’re analyzing ETH on the 1-Hour timeframe.
👀 On the 1-hour timeframe, Ethereum is currently ranging after its recent drop, sitting in a decision-making zone. It already faked the range low once and bounced back up, creating a clean trading structure. If ETH breaks above the $4,210 resistance, it could complete its correction and push higher. On the other hand, if ETH continues its deeper correction, a break and confirmation below the $4,135 support would open the way to lower levels.
🧮 Looking at the RSI oscillator, it’s now hovering around the 50 zone. A cross above 51 could trigger a bullish breakout, while a cross below 35 would suggest Ethereum is heading for a deeper correction.
🕯 Candle size and volume have shrunk inside this range, showing clear consolidation. Buyers and sellers are in a tug-of-war, and we’d prefer not to trade in these tight squeezes with heavy volume until a clear winner emerges. A breakout of the range will likely need strong “whale candles” to confirm direction.
💸 The ETH/BTC pair also shows a similar structure — after its recent drop, it has entered a tight consolidation pattern that mirrors the price action seen against USDT.
🧠 For trading ETH, patience is key. Wait to see which side Ethereum chooses to break out from. Once the range high or low (outlined above) is taken out with confirmation, we can look for a position in that direction.
❤️ Disclaimer : This analysis is purely based on my personal opinion and I only trade if the stated triggers are activated .
Double Tops = LIES. Market Structure is a ScamRetail traders call it resistance.
Smart money calls it liquidity.
This is why price comes back to the highs
Not for confirmation. But for your stop loss.

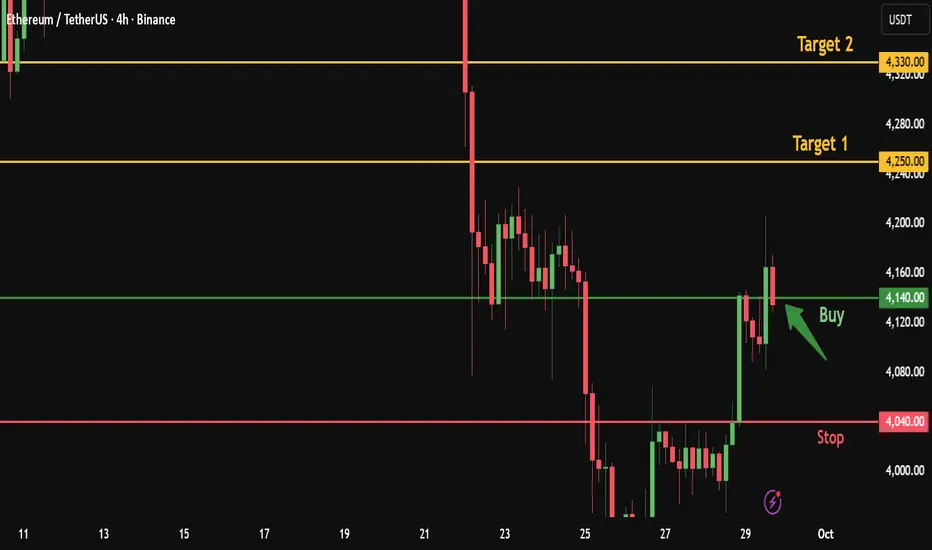
Ethereum Quick Buy from Broken Resistance – Targeting 4330After Ethereum broke the 4140 resistance with a bullish 4H candle and reached 4205, the price has now retested the broken resistance at 4140.
This level acts as a strong entry point for a long position, aiming for higher targets.
Here’s my personal trade plan:
✅ Entry : Buy from current price 4140
🎯 Target 1: 4250
🎯 Target 2: 4330
Stop-loss: 4040
👍 Don’t forget to boost this trading idea if you found it helpful,
and follow me for more daily crypto insights and trade signals.
Please note:
This is not financial advice – I’m only sharing my personal trades.
Always do your own research before taking action.
Best of luck 🌹