ETHUSDT - FUTURES SIGNAL FUTURES SIGNAL
Coin: ETH
Direction: LONG
🟢Input range: market/3578
✔️ТР: 3726/3902
❌SL: 3501
We work from the order block zone, in which I expect a price reversal.
USDTETH.P trade ideas

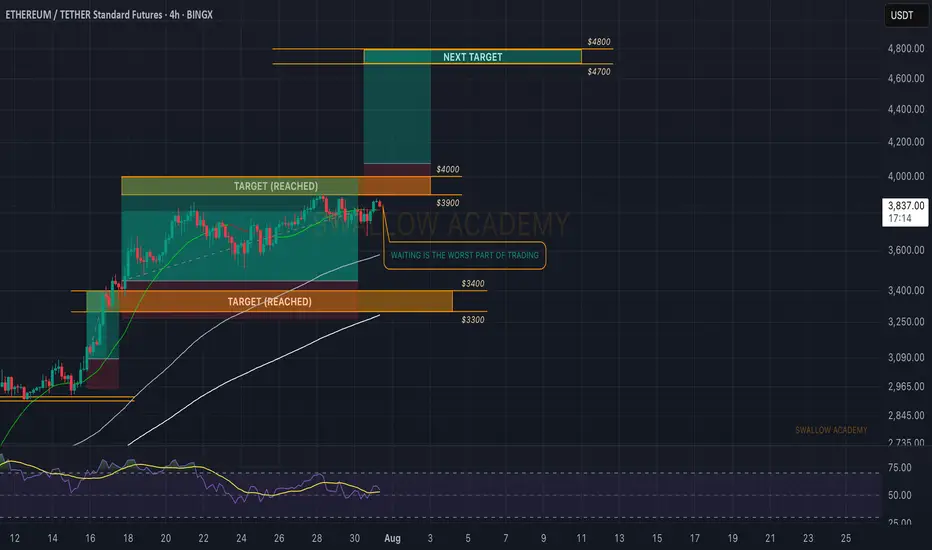
Ethereum (ETH): Bloody End of Week & Start of Month | We Wait!Well, we were close to breaking out of the $4000 area and now we are back on the lower side of the area, where sellers are showing strong pressure to coin.
As we approached the 100 EMA, we waited. Waiting is the worst part of trading, but that's what we do here. The 200 EMA is one key zone for us for another buying opportunity so if we keep on falling, that's the zone we are aiming for.
The second point of interest is the current 100 EMA, where if we see MSB to form, there might be a smaller scalp opportunity.
And last but not least, the zone above $4000.
Swallow Academy
Ethereum Short-Term · Trading within Bullish RangeI am looking at Ethereum short-term using the same timeframe I used for Bitcoin, 2h. We have some interesting signals.
Here ETHUSDT is trading within higher lows. This is interesting because Bitcoin produced a lower low recently. The same volume signal is present here, ETHUSDT has been producing lower bearish volume since last month.
The RSI produced a lower low while ETHUSDT produced a higher low. This is called a hidden bullish divergence. Ethereum's bears did not only fail to take out the last low 24-July but also the previous one, and this clearly reveals bullish support.
The RSI being oversold is also a positive condition and can signal a reversal happening soon. Not truly a reversal because we are not in a downtrend, we are still witnessing a small pause after a strong rise; consolidation near resistance. A continuation reads better.
Ethereum's price continues really strong and the short-term signals are pointing to bullish action being favored in the coming days. We can wait easily and patiently because the best is yet to come. Never SHORT in a bull market, the market will surprise you with how fast things can turn. Better wait for support and go LONG.
Namaste.
Smart Money Knows: ETH Is Gearing for a Supercycle...Hello Traders 🐺
In this idea, I wanna break down why $15K ETH isn't just a fantasy — it's a real, reachable target. So stay with me 'til the end, because this is just the beginning for Ethereum and the altcoin market.
If you’ve been following my ideas over the past year, you know I’ve been loudly calling for an incoming altseason — especially since ETH hit $1700. I kept saying: “Load up on ETH while you can,” because smart money was clearly rotating into it.
And now? We’re seeing the result.
Since then, Ethereum has nearly 2x’d, and ETH ETFs are pulling in massive inflows — but the price hasn’t exploded yet. Why? Let’s look closer.
Over the past 90 days, ETH has rallied around +180%, but in a quiet, steady climb — which is actually bullish. A strong move with low hype = accumulation. That’s how smart money moves.
📊 Monthly Chart Breakdown:
ETH is moving inside a perfect ascending channel, with clean touches on both support and resistance. Right now, price is forming a bullish flag pattern at the upper range — a classic continuation structure.
Volume has dropped during this flag, which is a textbook sign of accumulation. Add to that: RSI is sloping downward, signaling that large players are shaking out weak hands while loading up quietly.
So yes — ETH has already done +180% during this consolidation phase, which tells us something big is brewing.
🔁 The current pullback on the daily? In my opinion, it’s just a technical reaction to the flag resistance. RSI is also trying to break above its own trendline. If both confirm, the next wave begins.
🎯 Targets?
First target: All-Time High around $4870.
After that? There's nothing but air until we hit the top of the monthly channel near $15,000.
That breakout above ATH is where the real FOMO begins — not just for ETH, but for the entire altcoin market.
Let’s not miss what’s coming.
And as always, remember our golden rule:
🐺 Discipline is rarely enjoyable, but almost always profitable. 🐺
🐺 KIU_COIN 🐺

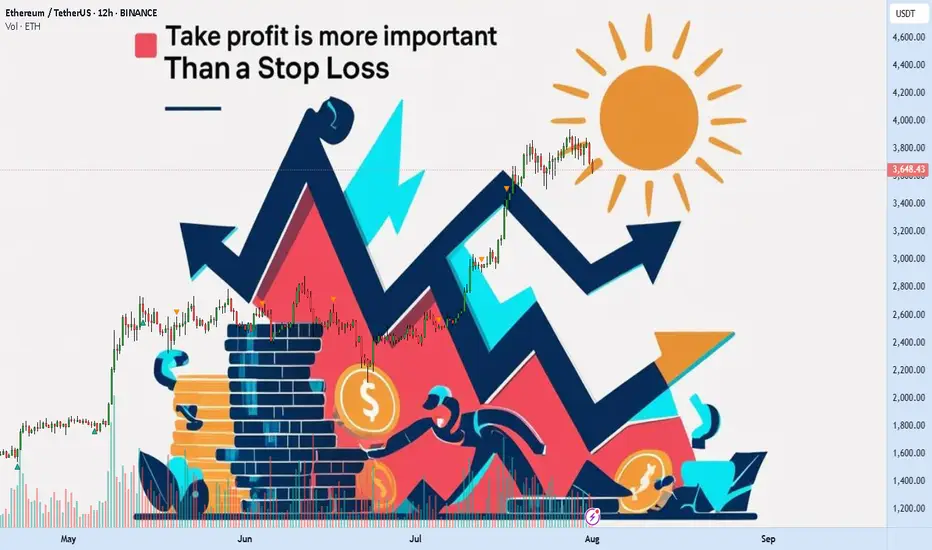
Take profit is more important than a stop lossAre you actually in profit, or just delaying your next loss?
How many times have you watched your gains vanish because you wanted more?
Maybe it's time to stop fearing losses and start planning exits.
Hello✌️
Spend 3 minutes ⏰ reading this educational material.
💸 Why Most Traders Lose Profits They Already Had
Most traders obsess over stop losses but never define where they'll take profits. Imagine entering a great trade, watching the price go up, then suddenly it pulls back and you're out with nothing. That happens because you didn’t define your win.
A well-placed take profit acts like a contract with your future self. It secures your gain before the market decides otherwise.
📉 No Take Profit? Say Hello to Unnecessary Losses
Failing to set a take profit is basically handing the market a free ticket to reverse your gains. Especially in the highly volatile crypto space, a missed exit often turns into a regretful stop out. So while everyone is talking about stop losses, you should focus on where the money is actually made.
🧮 A Clear Profit Target Creates a Clear Mind
Having a defined profit target gives your mind a place to rest. It brings structure and removes hesitation. This peace of mind is something new traders lack, which often leads them to close early or hold too long.
🧠 Greed Is the Real Enemy of Your Gains
Greed whispers "Wait, it might go higher"
But when you don't have a take profit plan, that whisper becomes your worst advisor. Pro traders map their exits before entering, while amateurs dream of riding forever.
🛡 True Capital Protection Begins with Profit Protection
If you're aiming for safe capital in crypto, it's not just about minimizing losses. It's about securing wins. Beginners often build their whole plan around stop loss. But advanced traders fear losing profits more than they fear taking a hit.
🎯 Take Profit Is Your Emergency Exit Plan
Setting a profit target is like having an escape route during a fire. Without it, you’ll panic when things turn. Crypto markets are full of pump traps. Your profit is only real when you actually take it.
🚪 Exit Strategy Matters More Than Entry
Everyone talks about entries, but it's your exit that defines whether your trade ends in green or red. Many traders nail the perfect entry but without a clear exit plan, they hand back their profits. Prioritizing your take profit is not optional. It’s essential.
🔁 Managing Gains Is Managing Emotions
Without a defined exit, every candle can shake your decision-making. But when your take profit is set in advance, emotions can’t hijack your strategy. You’re following a plan, not a feeling.
📊 TradingView Tools to Manage Take Profits Effectively
In the world of trading, the right tool means the right decision. TradingView offers powerful tools that help you manage not just your stop loss but more importantly, your take profit targets. With tools like Price Range and Long/Short Position, you can easily visualize where you entered and where you need to exit before greed pulls you deeper.
The Fibonacci Extension tool is especially valuable during bullish runs. It allows you to map out realistic and strategic profit levels like TP1, TP2, and TP3. These targets can then be paired with horizontal lines or alerts within TradingView’s chart system.
Even if you're using a free TradingView account, a simple custom Pine Script can help set alerts when your percentage targets are hit so you can scale out or lock in profits instead of emotionally reacting to price movement.
Using these tools practically empowers traders to build real-world strategies and take control of their exits, not just their entries. That’s the real edge.
📌 Final Takeaway
A clear, well-placed take profit protects both your money and your mind. Don’t let your wins dissolve into losses. With the right tools and the right mindset, you don’t just survive the market, you beat it. Start managing your profits today, not just your losses.
✨ Need a little love!
We pour love into every post your support keeps us inspired! 💛 Don’t be shy, we’d love to hear from you on comments. Big thanks , Mad Whale 🐋
📜Please make sure to do your own research before investing, and review the disclaimer provided at the end of each post.
ETHUSDT.PIf you look at the chart, you will notice an uptrend that has somewhat lost its strength and we may not be able to hit higher highs like the next strength in the next move.
Support: 3.660 - 3.590 - 3.160
Resistance: 3.900 - 4.260
Entry: 3.700
SL: 3.500
TP: 4.240
Please control risk management.⚠️

ETH Still Holding Key LevelDespite the recent pullback following the FOMC meeting, Ethereum is still trading above a key daily level that previously acted as resistance ($3,865). As long as we don't see a daily close below this zone, the market structure remains intact, and my bias stays bullish.
Support holding here could set the stage for another leg up and potentially reignite altseason, going below will cause me to shy away from the idea of an altseason in the short future.
For now, I’m watching daily close closely and staying patient
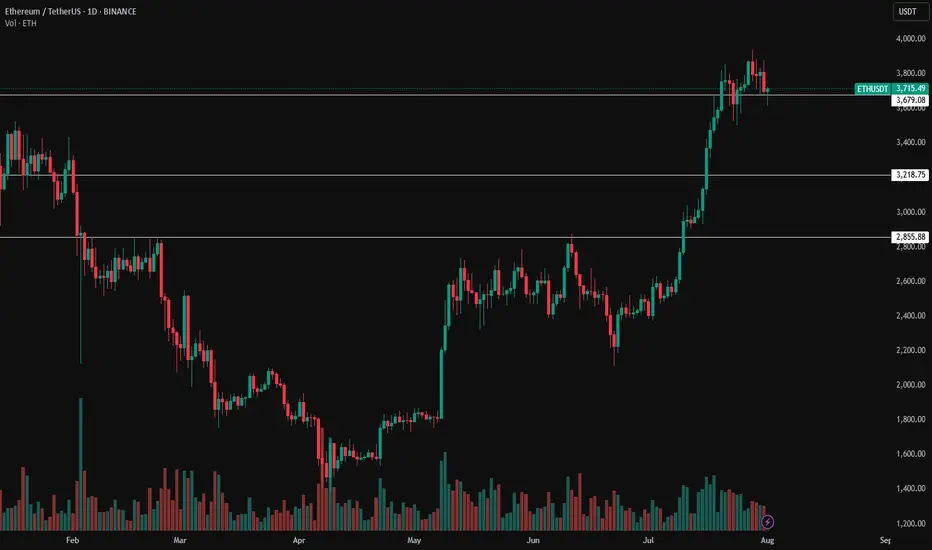
The key point to watch is whether it can rise to 3900.73-4107.80
Hello, traders. Nice to meet you.
If you "Follow," you'll always get the latest information quickly.
Have a great day.
-------------------------------------
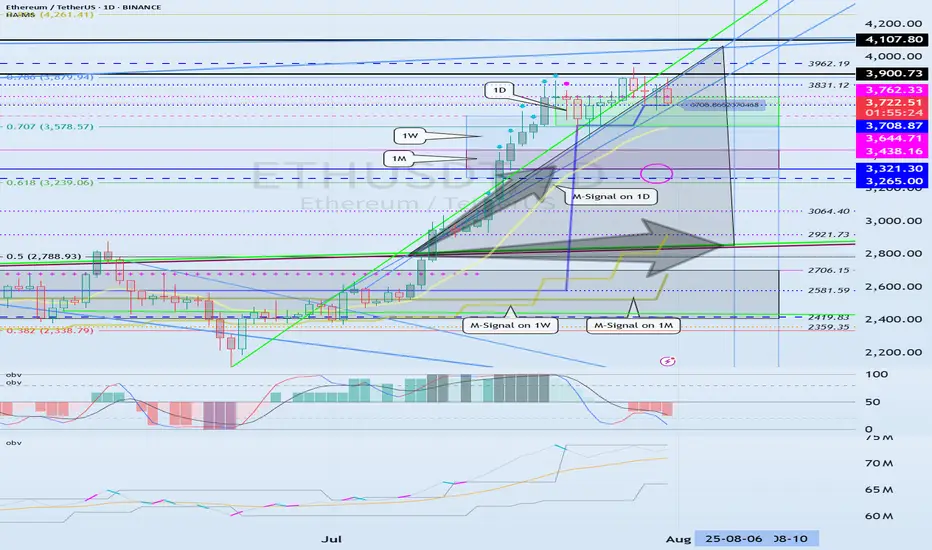
(ETHUSDT 1D Chart)
The upward trend continues, with the M-Signal on the 1D chart > M-Signal on the 1W chart > M-Signal on the 1M chart.
Therefore, if the price holds above 3265.0-3321.30, a medium- to long-term uptrend is likely.
Currently, the HA-High ~ DOM(60) range is formed across the 3265.0-3762.33 range on the 1M, 1W, and 1D charts.
Therefore, the key question is whether support is found within the 3265.0-3762.33 range.
-
While the price is trending upward along the short-term trendline, if it falls below the short-term trendline and encounters resistance by falling below the M-Signal indicator on the 1D chart, a decline to the 3265.0-3321.30 range is likely.
ETH's volatility period is expected to last from August 6th to 10th.
The key point to watch is whether it can rise above the 3900.73-4107.80 range after this volatility period.
-
Since the StochRSI indicator has entered an oversold zone, the downside is likely to be limited.
Since the OBV indicator of the Low Line ~ High Line channel remains OBV > OBVEMA, a significant decline is unlikely.
However, since the TC (Trend Check) indicator is below zero, selling pressure is dominant.
Therefore, a decline below 3708.87 could lead to further declines. However, as previously mentioned, the decline is likely to be limited, so a significant decline is not expected.
Once the M-Signal indicator on the 1D chart is encountered, the trend is expected to re-establish itself.
-
Thank you for reading to the end.
I wish you successful trading.
--------------------------------------------------
- This is an explanation of the big picture.
(3-year bull market, 1-year bear market pattern)
I will explain in more detail when the bear market begins.
------------------------------------------------------
Ethereum Quick Outlook – Potential Trap Before Drop?ETH is moving within a rising channel, but momentum is fading. Price failed to break above the midline and is now testing lower support.
A fakeout to the upside toward the $4,015–$4,050 supply zone is possible before a deeper drop. The projected path suggests a short-term bounce, final liquidity sweep, then potential reversal.
🟡 Key Resistance: $4,015
🔻 Breakdown trigger: Below $3,620
🎯 Bearish Targets: $3,250 → $3,100
Structure hints at a possible Ending Diagonal (Neowave), or a Trap-Wave E inside a Complex Correction.
⚠️ Watch for manipulation near highs – confirmation needed for short entry.

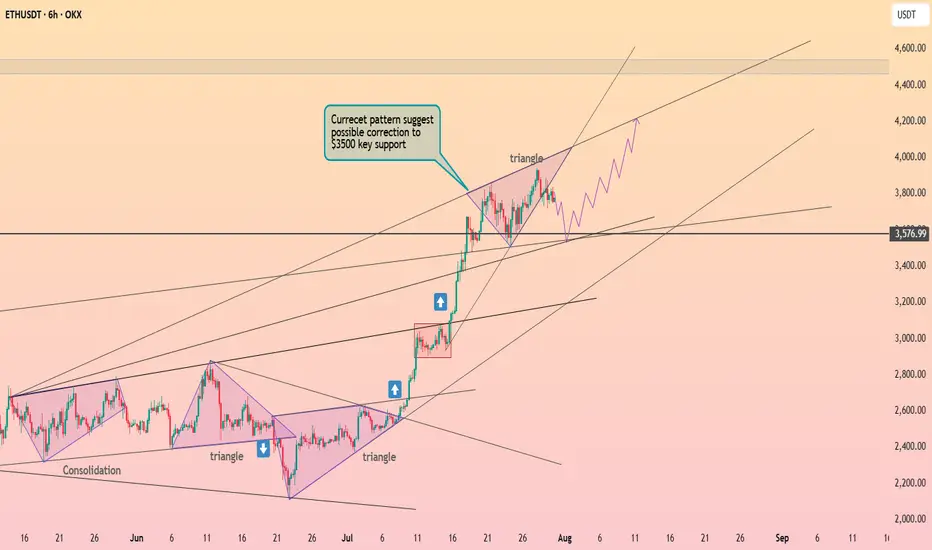
Ethereum is holding the $3700 level ┆ HolderStatOKX:ETHUSDT rallied from multiple triangle breakouts to test 4,400+ before pulling back. It’s now approaching key support at 3,576, which coincides with a major horizontal and trendline intersection. If this zone holds, the next leg up may target 4,600–4,800. Structure remains bullish above 3,500.
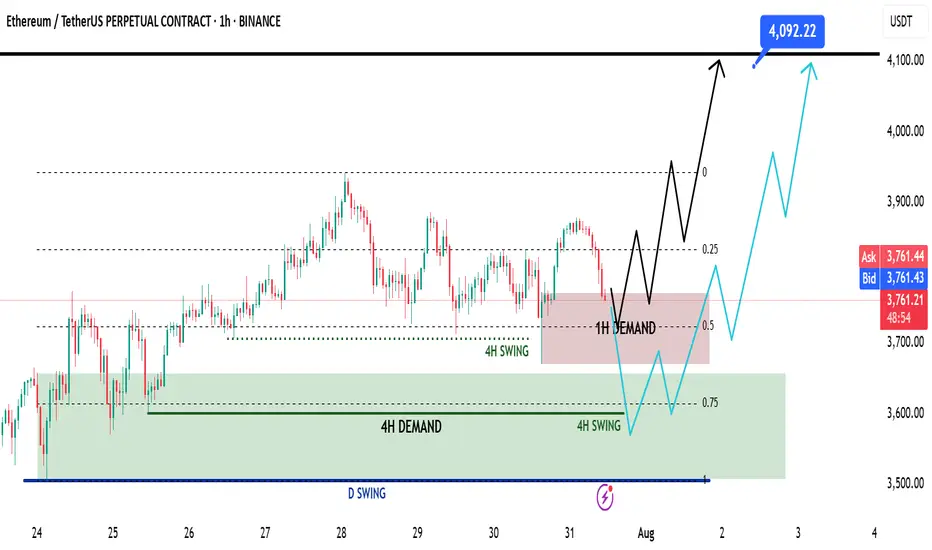
Ethereum Mid Week Update - Swing Long Idea📈 Market Context:
ETH remains in a healthy bullish structure. Despite the recent retracement, price action is still supported by strong demand zones on higher timeframes. No change in the overall sentiment from earlier this week.
🧾 Weekly Recap:
• Price rejected from the Fibonacci 0.5 EQ level — a discounted zone in my model.
• While doing so, it also ran 4H swing liquidity.
• After taking liquidity, ETH formed a 1H demand zone — a sign to look for lower timeframe confirmations for long setups.
📌 Technical Outlook:
→ Price has already tapped into the 1H demand zone.
→ From here, we have two possible scenarios:
Black scenario (ideal):
• Wait for 15M bullish break of structure (BOS).
• Enter after confirmation for long setups from 1H demand.
Blue scenario (deeper retrace):
• If no bounce from 1H demand, expect price to dip toward 0.75 Fib level (max discount).
• Watch for another liquidity run & 1H–4H demand formation.
🎯 Setup Trigger:
✅ 15M bullish BOS inside 1H or 4H demand zones
→ This would be the entry confirmation trigger for longs.
📋 Trade Management:
• Stoploss: Below the swing low of the 15M BOS
• Target: 4090$
💬 Like, follow, and drop a comment if this outlook helped — and stay tuned for more setups each week!
Ethereum's futile attempt to go up.Ethereum’s pointless push and unnecessary insistence on going up — if it really wants to hit a new ATH, it needs to drop first, both to take a breather and to let buyers with lower buy orders get into the game.

ETH is at a critical inflection pointETH 4H – Decision Time 🧠🐂🐻
Ethereum’s dancing on the edge of a blade.
📍 Entry: $3,778 (Short)
🧪 Next Add: Tiny at $3,906 (updated)
🚨 Major Add: Above $4,100 (TBD)
⚠️TP 1: $3,677 (updated)
We’ve broken the downtrend line — bullish on paper — but ETH is stalling right near resistance at $3,875. If bulls don’t show up with volume and conviction, this move fizzles out fast.
Here’s the playbook:
🔸 $3,875 = key battle zone
— Reclaim it clean (4H close + volume) = "short-term" bear bias invalid (◘reread◘)
— Failure = likely drop to $3,677 → $3,588
🔸 $3,720 = swing short confirmation if broken
🧩 If bulls win $3,875, I keep the short but hedge with a long. Because if the herd’s charging uphill, they might lead us to gra$$.
Momentum is king. No follow-through = fakeout top.
Let the chart breathe.
LOW LEVERAGE POR FAVOR!
Stay Sharp. Stay nimble. 🎯
100% not financial advice, for edutainment purposes only!

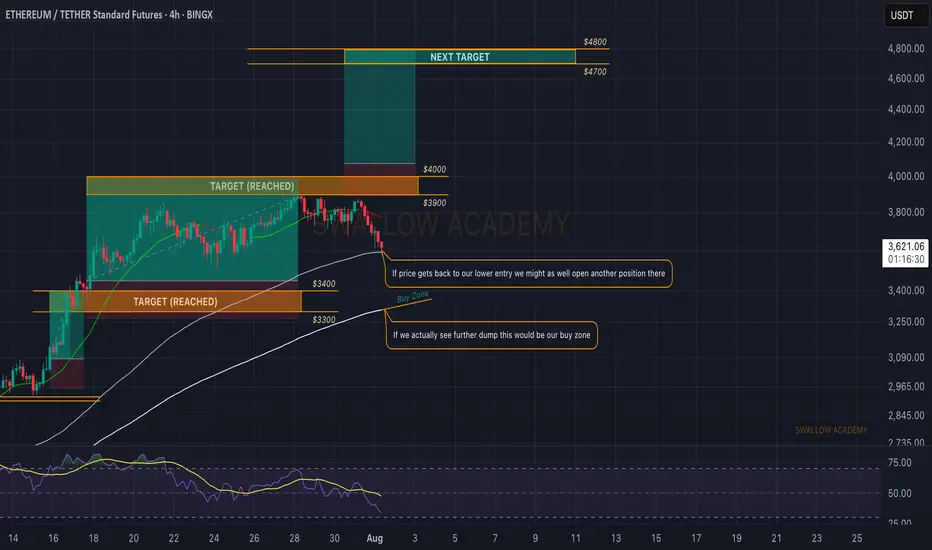
Ethereum (ETH): Waiting Is The Worst Part Of Trading | $4800ETH still looks good; we hit the target lately and now we are looking for the breakout to happen, which will give us another opportunity for a long position towards the $4800 zone.
Swallow Academy

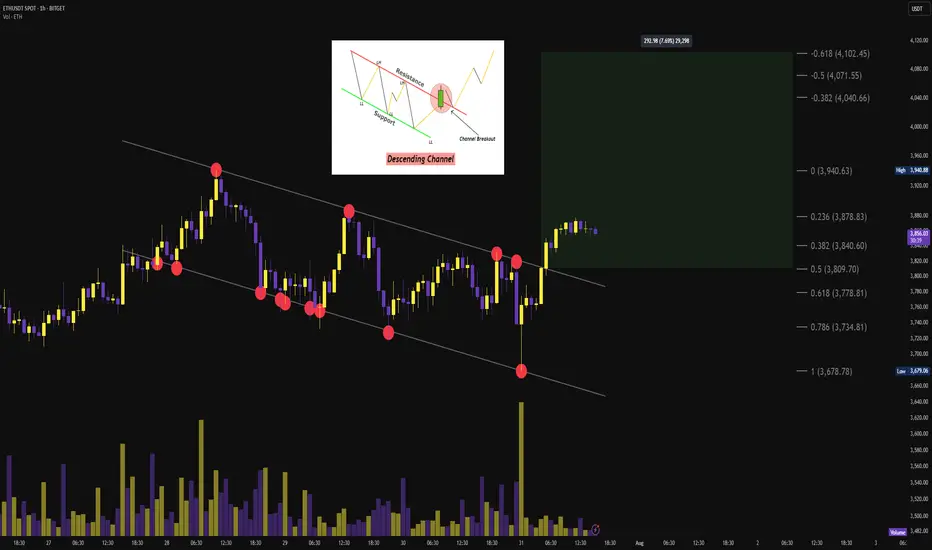
$ETH 1H Descending Channel Breakout🟩 Breakout Level: $3,770
🟩 Fib-Based Targets:
→ $3,878 (0.236)
→ $3,940 (0)
→ $4,040 (0.382)
🟥 Invalidation:
Break back inside the channel + loss of $3,678
Momentum Summary:
Perfect touchpoints across the descending channel. Final wick tagged demand with massive volume, followed by impulsive breakout and retest. Short-term structure favoring bullish continuation.