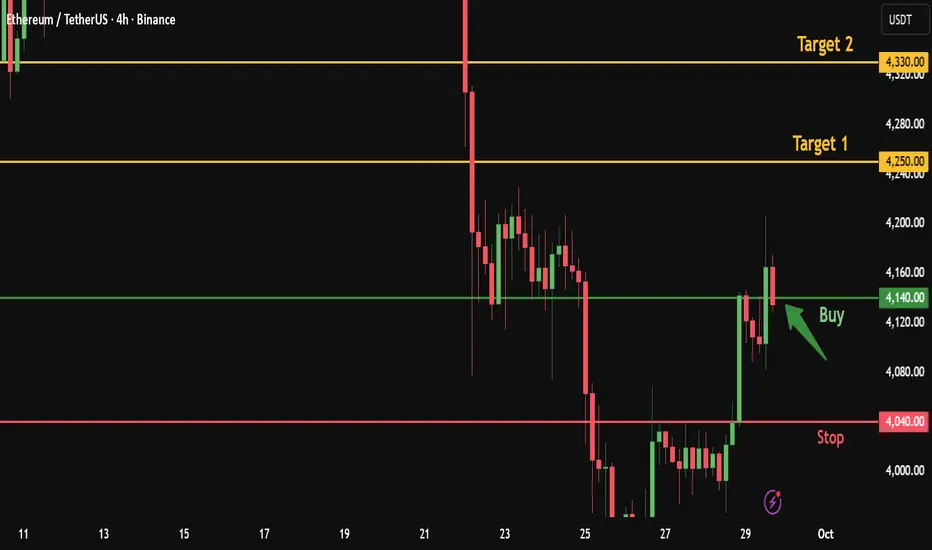
Ethereum Quick Buy from Broken Resistance – Targeting 4330After Ethereum broke the 4140 resistance with a bullish 4H candle and reached 4205, the price has now retested the broken resistance at 4140.
This level acts as a strong entry point for a long position, aiming for higher targets.
Here’s my personal trade plan:
✅ Entry : Buy from current price 4140
🎯 Target 1: 4250
🎯 Target 2: 4330
Stop-loss: 4040
👍 Don’t forget to boost this trading idea if you found it helpful,
and follow me for more daily crypto insights and trade signals.
Please note:
This is not financial advice – I’m only sharing my personal trades.
Always do your own research before taking action.
Best of luck 🌹
USDTETH.P trade ideas
$ETH Bearish Short-Term (September 24, 2025)BINANCE:ETHUSDT
Summary of Price Action:
Recent Movement: In the last 24 hours, ETH has dropped by about 1.12%, reaching around $4,133 - $4,175 this morning (UTC). This follows a slight recovery from lows near $4,092 on September 22, but it's now retesting support at $4,100 amid strong institutional redemptions. In your 2H chart, we see a series of red candles (bearish) indicating selling pressure, with trading volume increasing during the decline, confirming seller interest.
Key Levels:
Support: $4,100 (immediate level, tested today) and $4,000 - $4,092 as a stronger lower zone. If $4,100 breaks, we could see a drop toward $3,900.
Resistance: $4,180 - $4,200 (strong level with recent rejections). A break above $4,200 would signal recovery toward $4,300.
Volume and Liquidity: 24-hour volume is around $34.8 billion, with large liquidations tied to $141 million in spot ETF outflows over the past day, mostly from institutional longs. This shows smaller traders suffering from bearish pressure.
MACD Indicator Analysis :In the chart you sent, the MACD line (blue) is crossing below the signal line (orange), with the histogram turning more negative (red bars growing). This indicates a bearish divergence – the price is weakening while momentum is losing strength. MACD is below the zero line, confirming a weak short-term trend. RSI (at similar levels) is around 40-50, signaling lightly oversold, but still without strong buy signals.
Overall Trend:
Bearish Short-Term, Bullish Long-TermShort-Term (Today/Next Day): Bearish.
The price is consolidating in a bearish channel, with predictions for further downside toward $4,000 - $4,092 today or tomorrow, due to fear sentiment and pressure from ETF outflows. This matches your chart, where we see a potential descending triangle pattern (but still uncertain). Avoid immediate buys – wait for confirmation below $4,100 for shorts or above $4,180 for longs.

ETH ideaETH has cleared the target zones from the previous plan and tapped the weekly key level, giving a solid reaction.
To me, this looks like manipulation below the range — now I’d like to see the same type of sweep to the upside.
We could get another dip early in the week if BTC tags the mentioned levels, but after that I’m expecting price to return back into the range.
Bigger picture — I’m looking for a push to new highs around 5K.

ETHUSDT #009 (Be careful, need 15-20% correction for next cycleHello dear traders.
Good days.
First of all thanks for your support and comments.
————————————————————————
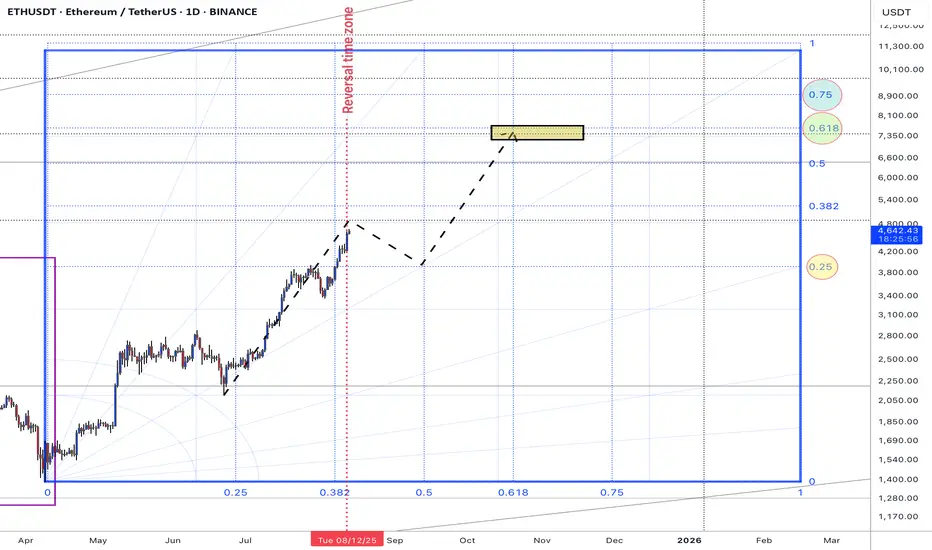
On daily Gann Square ETHUSDT break out 0.5 Gann Square price zone and with good strength trend line support it expected to fill 0.618 Gann box price level at exact reversal time zone .
So be careful and do not be FOMO . expected to grow up to 4800$ and correct 15-20 % correction for retest 0.5 Gann price zone .
If support at 3940-3915 $ will grow up fro next bull cycle .
BTC Dominance is mached also at exact time with ETHUSDT .
Weekly overview of ETHUSDT Chart will updated.
Good luck and safe trades.
Daily ETH Signal: Sell Now , target 4000ETH is currently showing signs of strength as it tests the key resistance level around 4150.
the price retest the level
My Personal Short Setup
Entry : Sell Now from current Price 4153
can wait for Price 4180
🎯 Target 1: 4059
🎯 Target 2: 3961
❌ Stop-loss: 4250
👍 Don’t forget to boost this trading idea if you found it helpful,
and follow me for more daily crypto insights and trade signals.
⚠️ Please note:
This is not financial advice – I’m only sharing my personal trades.
Always do your own research before taking action.
Best of luck 🌹

$ETH Analysis🚨 CRYPTOCAP:ETH Analysis 🚨
Still waiting for the setup to fully play out 👀
✅ Long plan: sweep of the recent low before entering
❌ Short plan: looking for a bearish reaction at the 4H FVG or bearish OB 🔥
Patience here could pay off big — no need to rush 🚀

Ethereum. Watching the 3,880–4,060 Zone: Setup for a New ATH?Hi traders and investors!
This analysis is based on the Initiative Analysis concept (IA).
The price has entered the 3,880–4,060 range — the scenario I was waiting for in the related post.
The September 25 seller candle is an IC candle and shows the highest volume since August 22.
And with September — typically a weak month for asset growth — coming to an end, we watch closely.
On the daily timeframe, the price is in a sideways range. The black lines mark the boundaries of this range. We’re waiting for the price to return back inside, absorb the seller’s candle that broke the lower boundary, and then it will be possible to look for buy setups targeting a new local ATH.
Wishing you profitable trades!

[SeoVereign] ETHUSDT BEARISH Outlook – October, 03 2025The key basis for presenting a bearish perspective in this idea is that the Crab pattern, one of the harmonic patterns, has been fully confirmed.
For clearer verification, I have directly plotted the relevant section on the chart for your reference.
For reference, the Crab pattern is an extended harmonic pattern with high volatility, typically forming point D at the 1.618 level relative to the XA wave, and is characterized by a strong reversal movement thereafter.
Due to these characteristics, it is evaluated as a highly reliable pattern within the Potential Reversal Zone (PRZ).
Accordingly, the average target price is set around 4,135.40 USDT.
Additional briefings will continue to be updated in this idea as the chart develops.

Ether / usd7Comprehensive analysis of Ethereum to start a new uptrend to complete wave 3 and its target. If the trend line breaks, expect a 1:7 risk-to-reward trade.

#ETH is in heavy resistance, cautiously bullish📊#ETH is in heavy resistance, cautiously bullish ⚠️
🧠From a structural perspective, we've reached overlapping resistance zones, so be wary of a pullback. If we can establish a bearish short structure here, consider taking some short trades.
➡️Aggressive resistance is near 4330, while standard resistance is near 4410.
Let's see 👀
🤜If you like my analysis, please like 💖 and share 💬
BITGET:ETHUSDT.P

Eth Macro tradeBased on Elliott Wave I believe a new high is quite possible, and based on another trading method the shown seem like reasonable levels to go long, especially if we get that larger wave 4 in the local price action. Wait for the wave 4 (we are on larger 4 of 5 (unless previous rally was a 3)

ETH$ in uptrend ch ?!Ethereum is in an ascending channel, but it's undergoing a correction. The bottom of the channel, marked in orange, is an important point. Additionally, the green box indicates a key area that aligns with the weekly Fibonacci zone, as well as the 200 EMA. This is very significant and could lead to a price increase.

This Volatility Period:Around September 24th(September 23rd-25)
Hello, traders!
Follow us to get the latest information quickly.
Have a great day!
-------------------------------------
(ETHUSDT 1D Chart)
This Volatility Period: Around September 24th (September 23rd-25th)
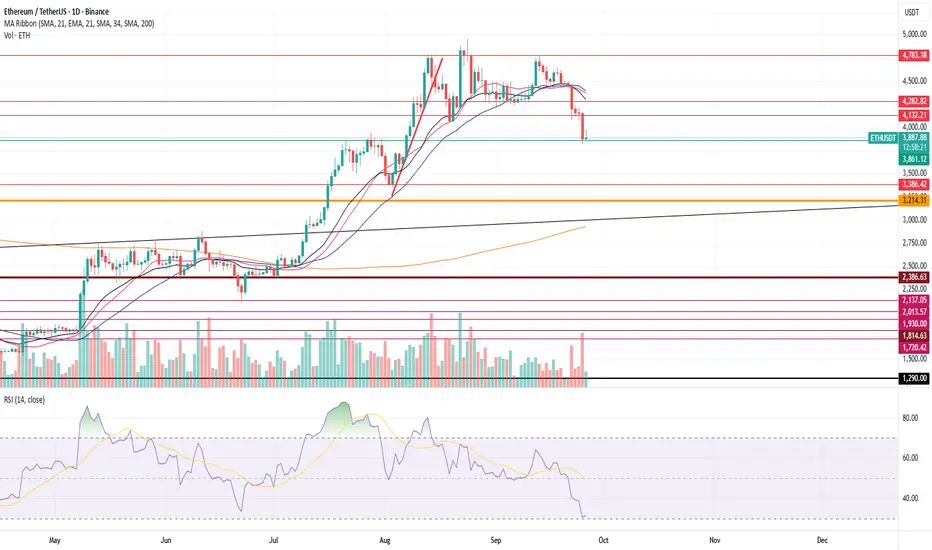
Before this volatility period began, the price fell below 4403.87 and then fell to the 3900.73-4107.80 range.
The 4403.87-1749.30 range, which corresponds to the HA-High ~ DOM (60) range, is likely to act as resistance, as it represents a high point.
The 3900.73-4107.80 range represents the previous all-time high (ATH). If the price remains above this range, the uptrend is likely to continue.
Therefore, the key question is whether the price can find support in the 3900.73-4107.80 range and rise above the 4403.87-4749.30 range.
After this volatility period, we should examine whether the price can find support in the 3900.73-4107.80 range.
If not, support around 3265.0-3438.16 is crucial.
-
If the OBV indicator falls below the Low Line, the price is likely to decline again.
Therefore, support around 3900.73-4107.80 is crucial.
-
The basic trading strategy is to buy in the DOM(-60) ~ HA-Low range and sell in the HA-High ~ DOM(60) range.
Considering this basic trading strategy, it may be natural for the price to decline since it failed to rise above 4403.87-4749.30.
Since it fell in the HA-High ~ DOM(60) range, it is likely to decline until it meets the DOM(-60) or HA-Low indicator.
However, since important support and resistance points or zones have formed, the trend can reverse at any time depending on whether support is found at those points or zones.
In this sense, the K value of the StochRSI indicator is in the oversold zone, suggesting a potential uptrend in the near future.
While the K value of the StochRSI indicator is in the oversold zone, the possibility of further decline is high. However, the established support and resistance zones increase the likelihood of turning this crisis into an opportunity.
In this situation, what we can do is confirm the signs of an uptrend.
Otherwise, if we anticipate a new trade in advance, we may face another crisis as the volatility period progresses.
-
If you are currently trading, there is an opportunity to sell in the first installment when resistance is encountered in the 4403.87-4749.30 zone.
As mentioned earlier, this is based on the basic trading strategy.
Depending on whether support is found in the 3900.73-4107.72 range, you'll decide whether to sell in two installments or buy.
Since the stock market trades in single-share increments, selling before the price has more than doubled from the purchase price makes it difficult to buy again.
However, the coin market allows for decimal trading, making trading easier than in the stock market.
This freedom of buying and selling is the biggest advantage of the coin market.
If your buy price is below 3900.73, buying when the 3900.73-4107.80 range shows signs of support will increase your average buy price, potentially putting you under psychological pressure.
However, as mentioned earlier, the coin market allows for decimal trading, making it possible to separate your buy price into separate trades.
Therefore, you can record the purchase price and purchase amount separately, differentiating them from the existing average purchase price, and then trade them separately.
If you understand this principle, you'll find the coin market much easier to trade than the stock market.
This is one of the reasons why even those who have successfully traded in the stock market often fail in their initial trading in the coin market.
-
Thank you for reading to the end.
I wish you successful trading.
--------------------------------------------------
- Here's an explanation of the big picture.
(3-year bull market, 1-year bear market pattern)
I'll explain more in detail when the bear market begins.
------------------------------------------------------

eth usdt longCurrently, ETHUSDT on the 4-hour timeframe remains in a broader downtrend, although it is showing a pullback after bouncing from the strong support area around 3,850. The rebound from that level indicates that buyers are stepping in, but for a healthier reversal confirmation, the price needs to break and hold above the 4,200–4,300 zone. Until there is a significant breakout above this resistance, the upward movement can still be seen as a relief rally within the bearish trend. If ETH manages to sustain above 4,120 and successfully breaks 4,200, there is potential for a move toward 4,270–4,300, with further upside to 4,500 if momentum strengthens. However, if the price gets rejected in the 4,200–4,220 area, the risk of another decline is high, with a potential retest of 4,050 and even 3,850. Given this setup, the best approach is to prepare for two scenarios: a buy-on-breakout strategy if price clears the key resistance with strong volume, or a sell-on-rejection strategy if the price fails to break above 4,200.

ETHUSDT 2DFollowing its recent rally, Ethereum has entered the critical $3,800 – $4,000 zone — a level that previously acted as a strong resistance and now serves as a key support area.
🔹 If price holds and consolidates above this level, the bullish momentum could extend toward $4,800 and $5,600, with long-term targets at $6,000 and $6,400.
🔹 However, a breakdown below $3,800 may trigger a deeper correction toward the $3,200 – $2,800 range.
This zone represents a decisive point for Ethereum, and its reaction here will determine the next major direction of the market.

#ETH is on a mission New ATH#ETH is on a mission to reach its new all-time high (ATH).
First, it may liquidate some long traders, then fill the order blocks of smart buyers before creating a new ATH.
~Namaste~
$ Jai Shree Ram $

Last chance to hit Eth before new ATHWe’ve noticed that on the daily chart, whenever Ethereum reaches oversold conditions during an uptrend, it often presents a solid buying opportunity. Looking at the latest chart, you can see that the last two times this happened, they marked the bottom. Now, we’re testing the daily oversold zone for the third time after a while. To me, this signals that we’re on the right track to form a bottom and continue upward. Of course, if you decide to buy, the responsibility is entirely yours.

ETH Charts ETH Charts
POI: it is at 3745, worst to comes to worst it will bounce from 3745. It looks like it has to retest 4100 - 4200 zone.
Everything is good, It has to stay above 3750!
Best Buy;
1. 3875
2. 3750

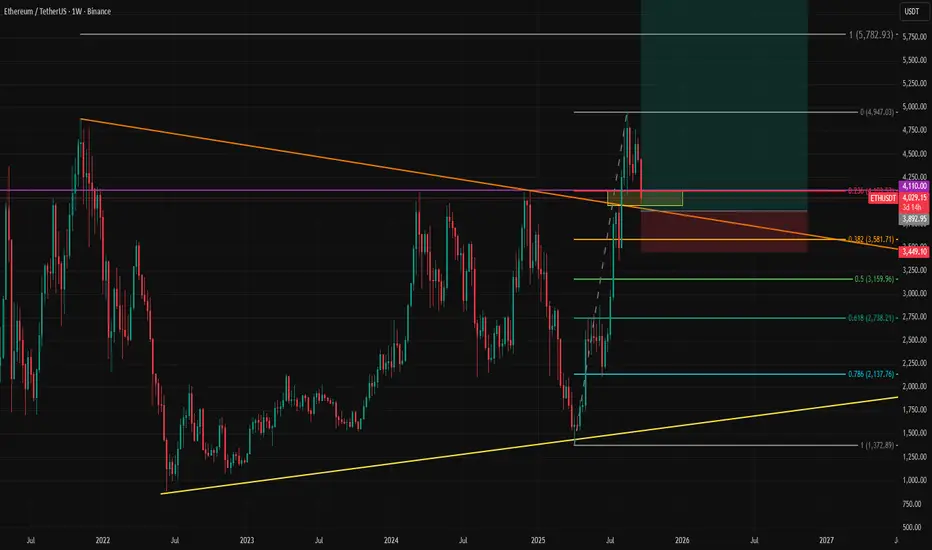
ETHUSD Retests Broken Trend on Weekly TimeframeEthereum is retesting the broken trendline and is likely setting up for another leg higher. Unless there is persistent pricing below $4,000, this selloff is likely to become a buying opportunity for those who missed the earlier rally.
Our year-end (or end of the first quarter of 2026) target above $7,000 still stands. The main risk is a potential selloff in the US stock market, which could drag crypto lower if the correlation remains intact.
$ETH shows bullish hidden RSI divergence.A **bullish hidden RSI divergence** is a trading signal that suggests a continuation of an upward trend, often indicating that the price will keep rising. It occurs when the price action and the Relative Strength Index (RSI) show a specific pattern. Here's a simple explanation of how to identify and trade it:
### Step 1: Understand the Pattern
- **Price Action**: The price makes **higher lows** (each low point is higher than the previous one), indicating an uptrend.
- **RSI**: The RSI makes **lower lows** (the RSI is declining while the price is not), showing a divergence from the price trend.
- This mismatch suggests that the uptrend is still strong, and the dip in RSI is just a temporary slowdown in momentum, not a reversal.
### Step 2: Identify the Divergence
1. **Chart Setup**: Use a price chart (e.g., candlestick chart) with the RSI indicator (typically set to 14 periods) on a platform like TradingView .
2. **Spot Higher Lows in Price**: Look for a price chart where the recent low is higher than the previous low (e.g., $100 to $105).
3. **Check RSI for Lower Lows**: At the same time, check if the RSI is making a lower low (e.g., RSI drops from 50 to 45 while price makes a higher low).
4. **Confirm the Uptrend**: Ensure the overall trend is bullish (price is generally moving up with higher highs and higher lows).
### Step 3: Trading the Bullish Hidden RSI Divergence
1. **Entry Point**:
- Enter a **buy** trade when you confirm the divergence and see the price starting to rise again after the higher low.
- Look for additional confirmation, like a bullish candlestick pattern (e.g., a hammer or engulfing candle) or a break above a resistance level.
2. **Stop Loss**:
- Place a stop loss below the most recent higher low to protect against a potential trend reversal.
- For example, if the higher low is at $105, set the stop loss slightly below, like $103.
3. **Take Profit**:
- Target a take-profit level based on previous highs, support/resistance levels, or a risk-reward ratio (e.g., 1:2, meaning you aim for twice the profit compared to your risk).
- For instance, if your stop loss is $2 below entry, aim for a $4 profit target.
### Step 4: Manage the Trade
- **Monitor RSI**: Ensure RSI doesn’t drop into oversold territory (below 30) or show signs of a bearish reversal.
- **Adjust Stop Loss**: As the price moves up, consider trailing your stop loss to lock in profits.
- **Exit Strategy**: Exit the trade if the price hits your target, or if you see signs of a trend reversal (e.g., a bearish divergence or break of key support).
### Example
- **Price**: Stock XYZ makes a low at $100, then a higher low at $105.
- **RSI**: RSI drops from 50 to 45 during the same period.
- **Action**: You enter a buy trade at $106 after a bullish candle. Set a stop loss at $103 and aim for a take-profit at $110 (1:2 risk-reward).
- **Outcome**: If the price continues its uptrend to $110, you take profit. If it drops below $103, you exit with a small loss.
### Tips
- **Timeframes**: Use higher timeframes (e.g., 1-hour, 4-hour, or daily) for more reliable signals.
- **Confirmation Tools**: Combine with other indicators like moving averages or trendlines for stronger signals.
- **Practice**: Test this strategy on a demo account before using real money to understand how it works in different market conditions.
- **Risk Management**: Never risk more than 1-2% of your trading account on a single trade.
This strategy works best in trending markets, so always confirm the broader trend before trading.

ETH to around $4000I see a diamond pattern in the works. If this plays out it would be a nice short. NFA.

Eth RangeMy initial idea was to turn this distribution into a reaccumulation like seen in June. I'm waiting for it to develop, this could take some time.

A bounce to 4200 is on the cardsRSI is oversold, ETH is at the support. Everyone in Twitter is Bearish. A short term bounce to 4200 is on the cards. Then we will continue the dump.