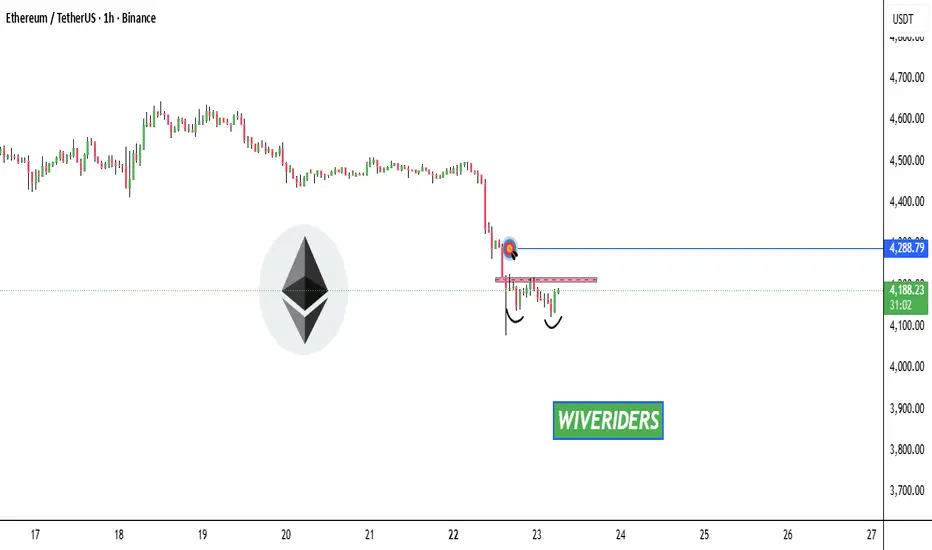
ETH-bias short Bearish indications:
Trend line support broken
Previous day's closing respected
MA 21 being respected daily and 1 hr
HS pattern in 15 min inside the flag
Bearish flag
AB=CD indcates fall until 3730
Trade plan bias short @ 4127
SL:4222
TP1:4035
TP2:3945
TP3:3863
USDTETH.P trade ideas

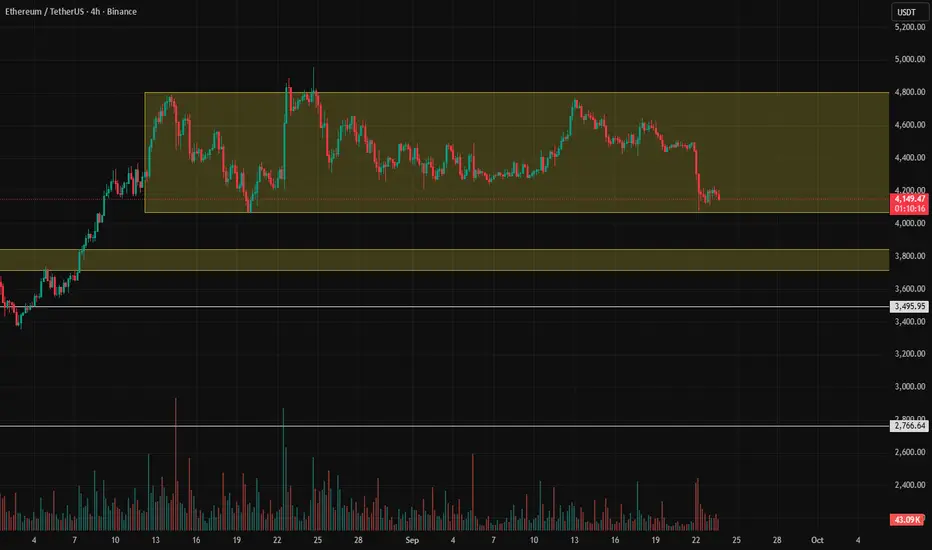
ETHUSDT Daily Analysis – Key Downtrend & Swing SetupEthereum is currently in a downtrend after the sharp surge toward $5,000. This move lower was expected following the extended bullish rally.
Looking ahead, I see a high probability of ETH reaching the $3,730 daily support. This level is a key swing trade setup and could serve as the foundation for the next big leg upward, potentially supporting a push toward a new all-time high in the longer term.
🔑 Technical Levels – Support & Stop Loss
📍 $3,730 | SL: $3,536 (Daily support – key swing setup)
📍 $2,680 | SL: $2,481 (Weekly support – deeper retracement zone)
Bias: Bearish in the short term while ETH remains under $4,400, but turning strongly bullish long term if $3,730 holds as support.
📊 Fundamental Insight
Regulatory uncertainty continues to weigh on crypto sentiment in the short term.
On-chain activity shows resilience, with active addresses and DeFi usage stabilizing.
Institutional demand remains present, with ETH staking and ETF developments reinforcing long-term value.
Overall, ETH is consolidating after an extended run. A retest of support zones could present high-probability swing opportunities for patient traders.
👉 If you find this content helpful, don’t forget to like & follow for more daily analysis.

ETH Accumulation Trap ENTRY NOWI put analysis in previous ETH setup today.
TP Sl entry are good to go on this trade. The next hour might need to temporarily lift SL. Trade smart?!

ETH is Sinking Deep: Strong Downtrend and Big SELL Opportunity!Currently, ETH/USDT is under strong selling pressure due to both fundamental and technical factors . According to the latest news, over 2.6 million ETH (equivalent to about $11.7 billion ) is waiting to be withdrawn from the Ethereum network. When these ETH are released, it will create significant selling pressure, greatly affecting ETH's price in the short term. This could lead to investor anxiety and a potential sell-off, diminishing confidence in the market.
From a technical perspective , the chart shows a descending wedge, with lower highs and the current bottom becoming weak. It is highly likely that ETH will drop to the support level at $4,110 before making any new moves.
Given these factors, the appropriate trading strategy is to open a SELL order if the price cannot break through the resistance at $4,410 and falls below the support at $4,110. The Stop Loss should be placed at $4,450, just above the resistance, and Take Profit at $4,110.
In conclusion, ETH is facing a strong downtrend in the short term. Investors should keep an eye on the market and open a SELL order as the price continues to drop.

Ethereum 3 month candle 1 week left for the 3 month candle to close if it closes about the 3700 resistance then chances are it will continue the up trend hopefully it holds. To much interest from institutions buying eth no way it falls back down again

ETH 1H Wave Check📊 Current Setup
ETH’s movin’ like BTC’s lil’ bro rn — same structure on the lower TFs. Price is cruisin’ inside that 4125–4200 zone consolidation box.
🚦 Scenarios
👉 If price pops out the top of that box, first wave could send us ridin’ toward $4400 🏄💸.
👉 But without a clean breakout, it’s just sideways chop — patience is still the play.
🧭 My Take
This is classic “wait for the set” surf energy 🌊. No breakout, no ride. Rules of the gang 😏.
❓ What’s Your Vibe?
You think ETH’s ready to catch that next wave, or will it stall out under 4200? Drop your read below 👇

ETHUSDT | Double Bottom Reversal | 1H SetupDescription:
📊 Pair: ETHUSDT
⏰ Timeframe: 1H
🔎 Analysis:
Ethereum (ETHUSDT) has formed a double bottom pattern around the 4100–4120 support zone, signaling a potential bullish reversal after the recent downtrend. This structure suggests that buyers are defending this level, and a breakout above the neckline confirms upward momentum.
📌 Trade Plan (Example Setup):
Entry: 4217.9 (neckline breakout)
Stop Loss: 4104.45 (below pattern support)
Target Profit 1: 4324.24
Target Profit 2: 4430.52
Risk:Reward: Approx. 1:2+
⚠️ This analysis is for educational purposes only. Not financial advice.
Hashtags:
#ETH #Ethereum #ETHUSDT #Crypto #TradingSignals #TradingView

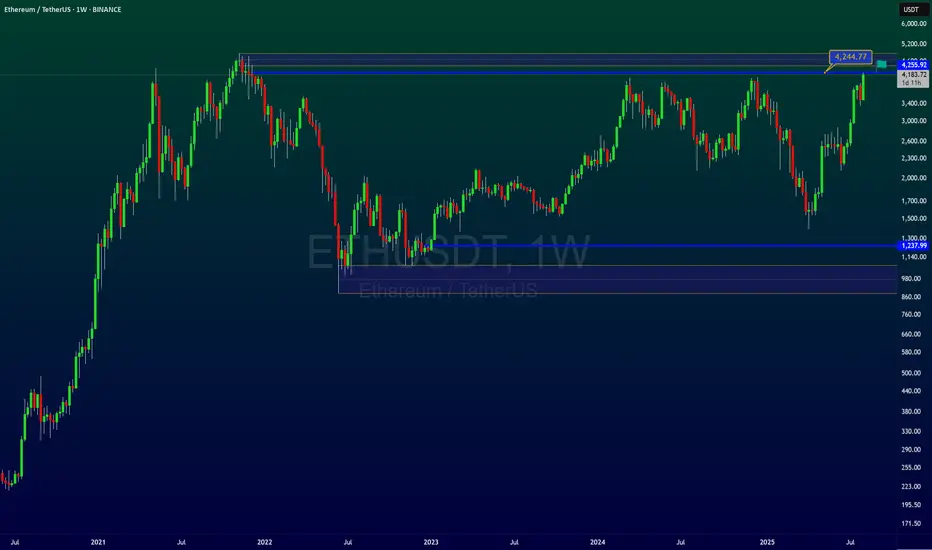
ETH all time high or reverse????Ethereum has returned to the top after a long time and is on the verge of breaking the top, but in my opinion this will not happen. Of course, it is possible to see new prices, but then it will enter a correction and this will happen in the next move that will start in the future.
So we should wait for a very good entry with a cheap and lower price.
Stay with me and boost me after introducing me to your friends.
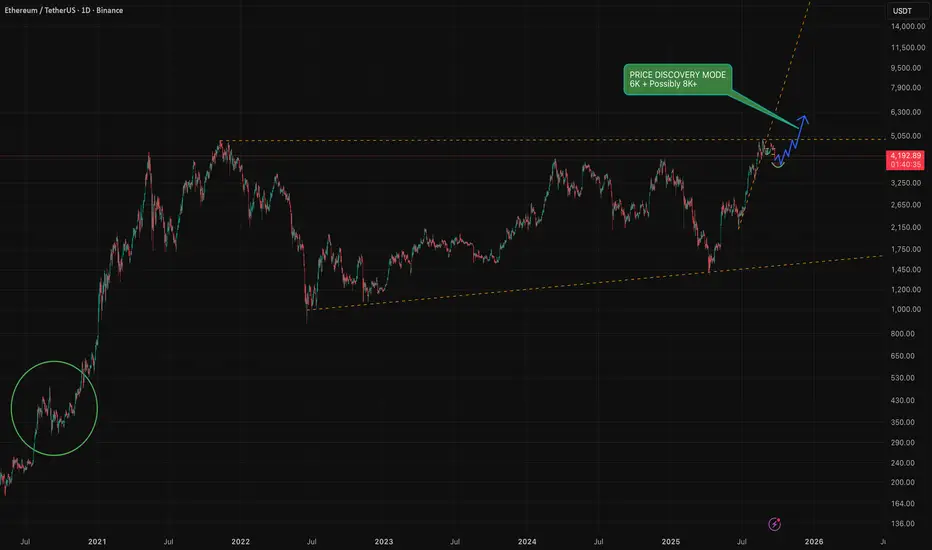
History doesn't repeat but RHYMES ! I highly recommend everyone to have look at September 2020
I personally think that this will be the same scenario where we will have some fake-outs to drive the retails out / liquidate then the price will carry on upwards and go into price discovery mode where we are more likely to see 6K and hopefully more, if the volume and kicks in the ETF's and more retail pump we can see somewhere between 8K to 12K ( Optimistically )
I personally will be taking profits along the way tho and not going to wait for the top as we all know no one can predict the top nor the bottom !
Thank you all for reading my idea and feel free to share yours here in the comments.
To get access to my indicators please join the FREE tg channel, link in my BIO !
ETH - Roll back - Its coming baack to 4500SO mods told me to write it big, so eth looks good for a pullback like I have drawn and corresponding to it, moves super well as seen and what.i drew

Volatility Period: Around September 18th (September 17th-19th)
Hello, fellow traders!
Follow us to get the latest information quickly.
Have a great day!
-------------------------------------
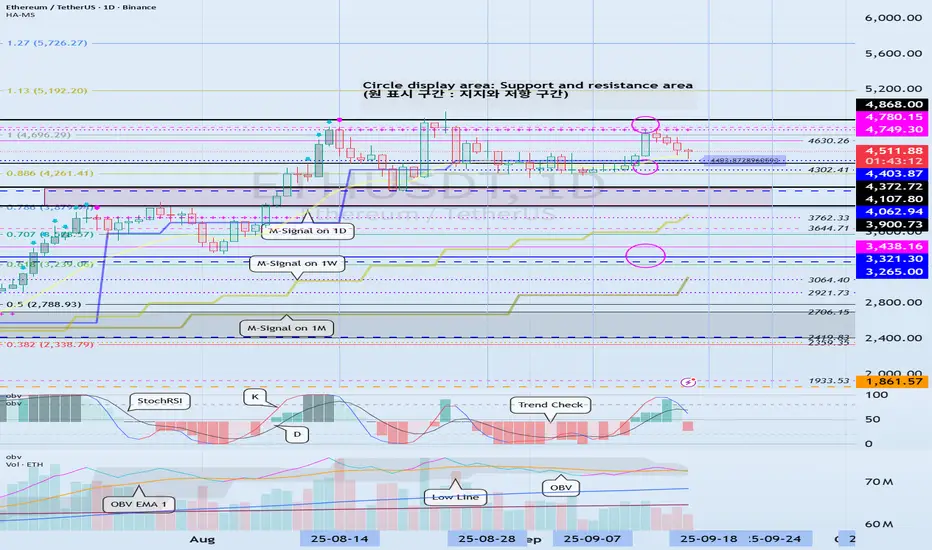
(ETHUSDT 1D Chart)
The 4403.87-4749.30 range, which is the HA-High ~ DOM (60) range, represents a resistance zone.
Therefore, we need to monitor the price movement after the current volatility period, around September 18 (September 17-19).
To sustain the uptrend, the price must remain above the 3900.73-4107.80 range.
From a medium- to long-term perspective, the 3265.0-3321.30 range is a key area.
Considering the above, if it falls below 4403.87,
1st: 4107.80-4372.72
2nd: 3265.0-3321.30
Therefore, it is likely to fall to the first and second levels above.
Therefore, the key question is whether it can find support near 4403.87 after this period of volatility.
-
When trading, it's important to understand the current price level.
I believe there are several ways to determine this.
My basic trading strategy is to determine when to trade.
My basic trading strategy is to buy when support is found in the DOM(-60) ~ HA-Low range and rise, and to sell when it touches the HA-High ~ DOM(60) range.
However, if the price rises in the HA-High ~ DOM(60) range, a step-like upward trend is likely, while if it falls in the DOM(-60) ~ HA-Low range, a step-like downward trend is likely.
Therefore, the basic trading strategy should be a segmented trading strategy.
If you were unable to buy in the DOM(-60) ~ HA-Low range, but the current price is within the DOM(-60) ~ HA-Low range, you should check for support.
Support is determined by checking whether support is found near the HA-Low or DOM(60) indicators.
If you bought when support was found near the HA-Low indicator, the first sell position would be near the DOM(60) indicator.
If you bought when support was found near the DOM(60) indicator, you should execute the trade quickly and effectively.
If the price falls below the purchase price, it would be considered a buy at the high.
To prevent this to some extent, we've utilized several indicators for verification.
First, we utilize the M-Signal indicator on the 1M, 1W, and 1D charts.
That is, if the M-Signal indicator is passing near important support and resistance levels, the presence of support in that area is likely to play a more important role.
Currently, the M-Signal indicator on the 1D chart is passing near 4403.87, so we should consider the area around 4403.87 as a potential important support and resistance level.
Second, we should monitor the movements of auxiliary indicators such as the TC (Trend Check) indicator, the StochRSI indicator, and the On-By-Signal (OBV) indicator.
For the price to continue its upward trend in this important support area,
- the StochRSI indicator must show an upward trend. If possible, it's best to avoid entering the overbought zone.
- The OBV indicator should be showing an upward trend. If possible, it should remain above the High Line.
- The TC (Trend Check) indicator should be showing an upward trend. If possible, it should remain above the 0 level.
By monitoring the movements of the three indicators above, you can determine whether there is support near important support and resistance levels.
However, you should not blindly trust the movements of auxiliary indicators. Even if you have identified the movements of auxiliary indicators, you should always monitor the price movement.
To determine support, you should monitor the price movement for at least 1-3 days.
This is especially important during periods of volatility.
Volatility is a period where you cannot predict the direction of movement, so extra caution is required.
Therefore, if possible, it's better to observe the situation and find a trading opportunity after the volatility period has passed rather than entering a new trade during a volatile period.
-
Thank you for reading to the end. I wish you successful trading.
--------------------------------------------------
- Here's an explanation of the big picture.
(3-year bull market, 1-year bear market pattern)
I'll explain more in detail when the bear market begins.
------------------------------------------------------
Ethereum Price Steady at $4,500—Here’s What’s Ahead For ETHEthereum’s price is currently trading at $4,468, just shy of the $4,500 resistance. The altcoin has been consolidating near this level, showing resilience even as broader market trends remain mixed.
Given the supportive market sentiment and accumulation trend, Ethereum is poised to reclaim $4,500 as a support floor. Successfully flipping this level could pave the way for ETH to challenge the $4,775 resistance in the coming days.
However, downside risks remain if bearish pressure builds. In such a scenario, Ethereum could lose footing and slip to the $4,307 support level. A drop to this zone would invalidate the bullish thesis temporarily and deepen potential investor losses

ETH-bias long once breaks the resistance Bullish indications:
HHHL
Trend line support respected.
MA 21 being respected.
Fib level 0.6618 respected
Bullish engulfer candle from support in 4 hr
IHS formation in 30 min.
Bullish divergence in 15 min.
Days support respected
Bearish indications:
Bearish divergence in daily
MA 21 being respected in 2 hr
Trade plan bias long @4489 buy stop
SL:4434
TP1:4542
TP2:4595

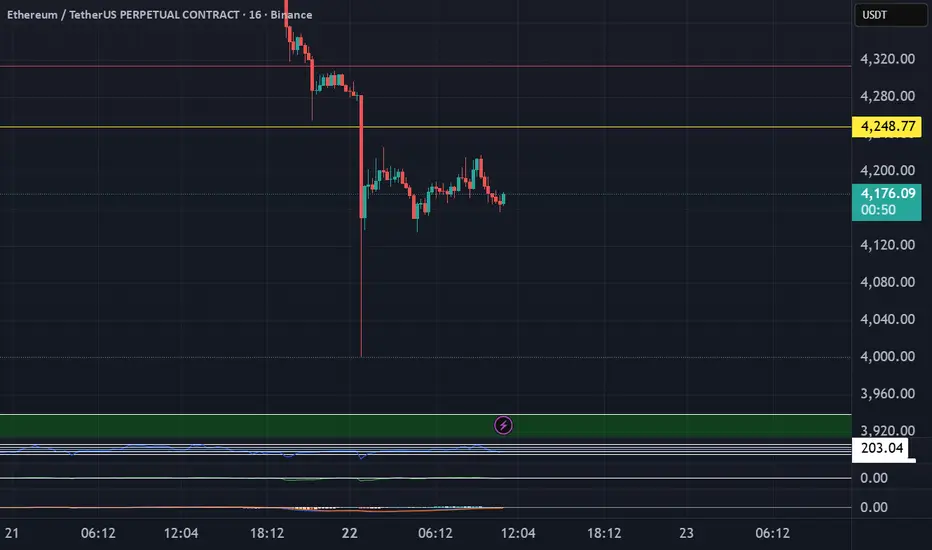
ETH Accumulation TrapdoorTrade Type: Controlled Bounce Long
Smart-money accumulation schematic, not trend breakout
3x Leverage (Max)
Valid potential 3–7 day tactical window
Pre-October macro bull run move
🔸 Entry Zone 1: $3,999 – $4,010
Must see all:
Only if 5m/15m BOS + FVG tap
LTF volume spike into structure
Bullish engulfing over previous 3 candles
Low skew in funding (<0.1%)
No macro weakness on BTC/ES
🔸 Entry Zone 2: $3,880 – $3,900
Must see all:
4H order block/FVG fill
LTF CHoCH + BOS
Wicking below $3,888 followed by fast recovery
No 4H close below $3,850
Entry 1 fills first, Entry 2 follows only if pullback comes.
Hard Stop: $3,800
Stop details: 1H/4H close + follow-through. Total exit. No re-entry without full reanalysis.
Soft Exit Protocols
At $3,850 sweep + spike: reduce 50%
$3,820 close without reversal: scale out 75%
HTF bearish engulfing near $3,800: full exit
TP Protocol
TP1: $4,130
Auto-sell 60% of position
TP2: $4,250
Close remainder or trail to $4,320
Optional TP3: $4,320 – $4,350
For breakout runners only
Trail SL under 1H swing low every $15 move
For Emergency Re-Entry
Scenario: ETH dumps to $2,950 – $3,050
Do not long immediately
Wait for:
Long lower wick rejection
New bullish FVG on 15m/1H
BOS back above $3,150
Then: Long with original TP plan, new SL = $2,850
Risk
Risk per Trade: 1.5% max account equity
Entry 1: 40% allocation
Entry 2: 60% allocation
NO compounding or pyramiding
Leverage Rules
Max 3x isolated
Must have 4H stop loss placed in system
Immediate invalidation:
If BTC breaks below $110.6K: close all ETH longs
If funding spikes above 0.18%: scale down or exit
Not financial advice.

Ethereum analysisIt’s been nearly 44 days that the price has been moving inside a range, and now it has reached the bottom of the range channel.
On the higher cycles, Ethereum’s trend is bullish, and as long as the 3700 support zone is not broken, we should continue to look for long positions.
There’s also a high probability that the price will move toward the decision-making zone. ✅
#ETHUSDT 4H ChartPrice is consolidating on lower timeframes showing no major movements. MACD is showing bearish weakness, RSI is oversold and EMAs are turning bearish. Price is expected to move up and retest the S/R Flip at $4,260 as a short-term target.

Ethereum to NEW ALL TIME HIGHBecause Ethereum holds above the critical 4000 support level, the bullish divergence on the daily RSI could drive it to break the 4800 resistance.

ETH has formed a potential Double Bottom pattern 📊 CRYPTOCAP:ETH Market Update
CRYPTOCAP:ETH has formed a potential Double Bottom pattern ✅
It’s now testing the red resistance zone 🔴 — if it breaks out with confirmation, the first target will be the blue line level 🎯
EthusdMarket sentiment is in fear mode , a good buying opportunity for institutions . High daily inflows means they are buying . a high weekly net outflows from exchanges means accumulation likely . a very high open interest means volatility it dropped 6% today This is just liquidation of over leverage longs. I think the price moves up from here

Ethereum 4250 breakAs i said in my last post, A daily close below $4,250 will take Eth down at least 8% from that level.
Trading plan for EthereumToday, Ethereum showed a sharp drop, reaching the support zone and now showing a local bounce. An ABC correction is clearly visible on the chart.
If the 4,000 level breaks, we could see a decline toward 3,600 . Before that, the price may show an upward correction toward 4,300 . Bullish sentiment will only return after breaking 4,500 — until then, the price remains in correction.

ETH Swing Long Idea - RDM is in playETH Swing Long Idea
📊 Market Sentiment
FED has resumed its rate-cutting cycle, starting with a 0.25% cut in September, with two more 0.25% cuts expected in the coming months. Additionally, institutional liquidity inflows have accelerated as the U.S. officially adopts crypto as part of its reserves. While inflation remains elevated, the weakening labor market is forcing the FED to ease, driving more capital into risk-on assets.
📈 Technical Analysis
Price is in HTF bullish order flow, so I will only be looking for long setups.
ETH made its all-time high and is currently retracing to gather more energy for higher moves.
Price also ran the HTF Range Low liquidity, which contained significant liquidity — an engineered move I expect to lead the market higher.
📘 Range Deviation Model (RDM)
In this model, I define the HTF Range High/Low. I wait for price to run one side of the range liquidity (either Range High or Range Low), then close back inside the range. That becomes the entry trigger, targeting internal range liquidity first. If HTF trend supports, the opposite range liquidity becomes the full target.
📌 Game Plan
I will be playing the Range Deviation Model (RDM) here.
Looking for a daily close above 4065$ as validation.
🎯 Setup Trigger
Entry after daily close above 4065$.
📋 Trade Management
Stoploss: 4000$
Targets:
TP1: 4484$
TP2: 4700$
TP3: 4965$
💬 Like, follow, and comment if you find this setup valuable!
⚠️ Disclaimer: This content is for informational and educational purposes only and does not constitute financial, investment, or trading advice. Always DYOR before making any financial decisions.

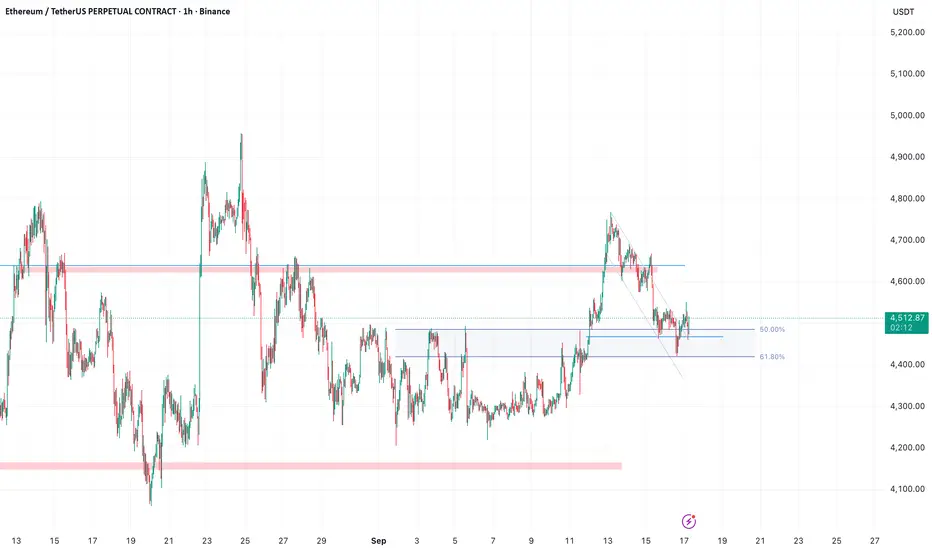
$ETH Cup and Handle --> around ATH {Breakout possibility}While we dance around the break of the previous ATH, there's a likelihood that we see newer, higher prices by the end of the week/month.
Price is around $4500 and sees recurring sponsorship to stay above $4400 (61.8% fib)
Could this be the >$5k/ETH month?
Bullish indicators described in chart
cup and handle pattern
price above 50% fib swing