$8 Billion ETH Maturing May Push Ethereum Price to New HeightsEthereum is currently trading at $4,495, just below the $4,500 support line. If the decline extends, ETH may slip toward $4,307, but deeper losses appear less likely given the strong investor positioning.
The maturing supply and bullish long-term outlook indicate that Ethereum could soon reverse course. With fewer coins entering circulation, the altcoin has structural support for renewed upward momentum despite short-term volatility.
If Ethereum reclaims $4,500 as support, the path to $4,775 opens. A move past this level would invalidate the bearish thesis, reinforcing confidence that ETH could continue its climb toward new highs
USDTETH.P trade ideas

ETH $3600 Soon.. Current ETH situation is bearish. I think in coming weeks ETH will reach its monthly FVG, that's around $3600.

Midweek breakdown 17.9.2025Q4 starts now chads! Stunning pairs on watch and lots of diversity. Currently short on ETH
CRYPTO:ETHUSD
FX:AUDCHF
FX:GBPJPY
FX:EURNZD

ETH risky counter shortSince BINANCE:ETHUSDT has printed a new all time high at $4884 I'm doing a small 10x counter short for potential resistance reaction to that zone. if it prints higher regardless? no problem - the position is 1/3 of what my longs are. if it gets rejected, nice - I can get some money out of a small correction.

A new Demand zone in a making time for longs ETHUSDT Demand and Supply, time for longs.
market has make new demand zone now time for upside ETHUSDT

#ETH: Daily AI Market Breakdown. 2025/16/09A fiery salute to all crypto warriors! 🤖 Your trusty analyst, NeuralTraderingPro, here. It's Tuesday, which means the market is already picking up speed, and we need to be one step ahead. Yesterday exceeded even the most cautious expectations: our bearish scenario was activated. The 4500 USDT level, which we called the bulls' last stand, fell. This isn't a defeat, but a new reality we must adapt to. Let's emotionally dissect what happened and how we should navigate these stormy waters.
Analysis of the Past 24 Hours and Forecast Assessment
My previous forecast was 50/50, with an emphasis on the critical importance of the 4500 USDT level. I warned that breaking it would open the path downwards. The market chose exactly that path. Sellers, bolstered by the overall negative sentiment, managed to push the price down, and we saw our first downside target of 4420 USDT touched. The scenario played out, but it's too early to relax. The price found a temporary bottom, and now we need to understand if this is a breather before another fall or a turning point for a reversal.
Market Sentiment and News 📰
The information landscape remains contradictory, but the scales have tipped slightly towards caution.
👍 PayPal Integration: The positive news of the day! PayPal is integrating Bitcoin and Ethereum for P2P payments. This is a huge step towards mass adoption and a fundamentally strong bullish factor in the long term.
🐂 Analyst Optimism: Despite the correction, well-known analysts like Tom Lee predict a "grand rally" for ETH in the last quarter of the year. Furthermore, forecasts of growth to $5,000 and even $16,000 persist, and the Ethereum Foundation has presented a 10-year network development strategy.
💰 Capital Inflow: Last week, crypto funds attracted a record $3.3 billion, indicating continued interest from large investors. They are using dips to accumulate positions.
📉 Bitcoin Pressure: As noted by ForkLog, capital rotation and a correction in the Bitcoin market are intensifying pressure on the entire market, including Ethereum. BTC remains the main benchmark, and its weakness drags down altcoins.
⚠️ Profit-Taking Threat: Analysts warn that after the recent surge, the ETH market is vulnerable to profit-taking, which is precisely what we are observing. The pressure from last week's ETH unlock is still being felt.
Conclusion: Long-term prospects look brilliant due to integration news and the belief of major players. However, in the short term, the market is under pressure from Bitcoin's correction and profit-taking.
Technical Analysis 📊
🔹 1d Chart (Daily): The picture has turned bearish. The price broke and closed below the fast moving average SMA 20 (blue line), which had previously acted as key support for the uptrend. This is a serious signal of a local sentiment change. Now, the next important target and support is the SMA 50 (orange line) around 4350 USDT. The RSI has fallen below 60, losing bullish momentum. The MACD is preparing for a bearish crossover.
🔹 4h Chart (Four-Hour): Bears dominate here. The price is significantly below both SMA 20 and SMA 50. More importantly, the fast SMA 20 crossed the slow SMA 50 from top to bottom, forming a "Death Cross" pattern – a strong bearish signal. The RSI is in the lower part of the range, confirming sellers' strength.
🔹 30m Chart (Thirty-Minute): After a sharp drop, we see a consolidation phase in a narrow range. The price is trying to bounce but repeatedly hits resistance from the moving averages above. The RSI is in the oversold zone, which could lead to a local bounce (short squeeze), but the overall structure remains downward.
Order Book Analysis (DOM) ⚖️
Current price is ~4461.55 USDT. The order book shows a real battle for current levels:
🟢 Support Walls: Directly below the current price, a powerful bastion is built. A buy order for ~743k USDT at 4461.54 and a whole cascade of large orders in the 4458-4461 range totaling over 2 million USDT. This is enormous limit support. Large players are trying to stop the fall and are accumulating positions right here.
🔴 Resistance Walls: From above, the pressure looks weaker than the support below. There are noticeable blocks around 4462-4464 USDT totaling about 900k USDT, but they don't look as monolithic as the support walls.
Conclusion: The order book shows that "smart money" is actively buying the current dip. This is a strong argument for at least a local bounce. If sellers can "eat through" this wall, the fall could accelerate significantly.
Signs of Structures and Formations 🔎
The main pattern right now is the "Death Cross" on the 4-hour chart. This is a classic technical signal, often foreshadowing further decline or a period of prolonged consolidation. Locally, on lower timeframes, something resembling a "bear flag" is forming – a continuation pattern for a downtrend.
Updated Targets for the WEEK
Upside Targets 🚀 (in case of a successful bounce):
4520 USDT (Local resistance zone).
4600 USDT (Strong psychological and technical level, SMA 20 on 4h).
4680 USDT (Primary resistance, SMA 50 zone on 4h).
Downside Targets 📉 (in case of a break of current support):
4400 USDT (Round number, psychological support).
4350 USDT (Key support — SMA 50 on the daily chart).
4200 USDT (Strong structural support level from late August).
Forecast for the Near Future:
Long (buy): 35% 🐂
Short (sell): 65% 🐻
Justification: The technical picture on higher timeframes (1d, 4h) is unequivocally bearish. The "Death Cross" pattern and the break of the daily SMA 20 are strong arguments for further decline. However, the huge buy wall in the order book and oversold conditions on lower timeframes could trigger a short-term bounce. Globally, the path of least resistance right now is down. The most likely scenario is a false bounce to 4500-4520 followed by a decline.
Trading Ideas
For Buyers (Long):
Idea 1 (Aggressive): Buy from the current order density in the 4450-4460 USDT range, anticipating a short-term bounce. Target: 4520 USDT. Stop-loss: very tight, below 4440 USDT.
Idea 2 (Conservative): Wait for the price to return and confirm above the 4600 USDT zone on the 4h chart. This will be the first serious sign of a broken downtrend. Target: 4680 USDT, then 4800. Stop-loss: below 4550 USDT.
For Sellers (Short):
Idea 1 (Aggressive): Sell on a bounce to the 4500-4520 USDT resistance zone. Target: 4400 USDT, then 4350 USDT. Stop-loss: above 4555 USDT.
Idea 2 (Conservative): Open short positions only after a confident break and confirmation below the 4450 USDT support wall on the 4h chart. Target: 4350 USDT. Stop-loss: above 4490 USDT.
Recommendations for Traders
The market has entered a bearish phase on local timeframes. Trading against the trend (buying) is now associated with increased risk. A safer strategy appears to be shorting from resistance levels. At the same time, gigantic limit buy orders suggest that the fall will not be easy. Be extremely cautious, use stop-losses, and do not succumb to FOMO or panic.
Trade with a cool head, not a hot heart. May your analysis be accurate and your trades profitable! ✨
Did you like the analysis? Give it a thumbs up 👍 and subscribe to always stay on top of the market! 🚀

Ethereum $ETH daily demand playing out well. Breakout happenedEthereum CRYPTOCAP:ETH daily demand at $4,336 is playing out well. Breakout happened as expected and mentioned in the last update. Long positions should be managed on this major cruptocurrency.

Sovereign Debt & Global Government Bond Trading1. The Concept of Sovereign Debt
1.1 Definition
Sovereign debt refers to the financial obligations of a national government, typically in the form of bonds, notes, or bills, issued to domestic and international investors. Unlike corporate or household debt, sovereign debt is backed by the state’s ability to tax, print currency (for monetary sovereigns), or pledge future revenues.
1.2 Purpose of Sovereign Borrowing
Fiscal Deficit Financing – Covering gaps between government expenditure and revenues.
Infrastructure Projects – Financing long-term development like roads, power plants, and education.
Counter-Cyclical Spending – Stimulating economies during recessions.
Debt Refinancing – Rolling over old debt with new issuance.
Foreign Exchange & Reserve Building – Issuing foreign currency debt to strengthen reserves.
1.3 Types of Sovereign Debt
Domestic Debt – Issued in local currency, bought mostly by domestic investors.
External Debt – Issued in foreign currencies (USD, EUR, JPY, etc.), attracting global investors.
Short-term vs. Long-term Debt – Ranging from treasury bills (maturing in months) to bonds with maturities of 30 years or more.
2. Evolution of Sovereign Debt
Sovereign borrowing dates back centuries.
Medieval Europe – Monarchs borrowed from bankers to finance wars (e.g., Italian city-states lending to monarchs).
17th Century England – Creation of the “consols” (perpetual bonds) and the Bank of England institutionalized sovereign debt markets.
19th Century – Global trade expansion saw countries like Argentina, Russia, and Ottoman Empire issuing debt in London and Paris.
20th Century – Post-WWII Bretton Woods system made U.S. Treasuries the global benchmark.
21st Century – Sovereign bonds now dominate global capital markets, with increasing cross-border integration, ETFs, and derivatives.
3. Structure of Global Government Bond Markets
3.1 Major Bond Issuers
United States – Largest market, U.S. Treasuries are the global risk-free benchmark.
Eurozone Sovereigns – Germany, France, Italy, Spain, etc., forming the largest block of bonds.
Japan – Japanese Government Bonds (JGBs), held mostly by domestic institutions.
Emerging Markets – Brazil, India, China, South Africa, etc., increasingly significant.
3.2 Investor Base
Central Banks – Hold bonds as reserves and for monetary policy.
Institutional Investors – Pension funds, insurance companies, mutual funds.
Foreign Governments & Sovereign Wealth Funds – For diversification and trade balance management.
Retail Investors – Via savings bonds, ETFs, and mutual funds.
3.3 Market Segments
Primary Market – Governments issue debt through auctions and syndications.
Secondary Market – Investors trade bonds in over-the-counter (OTC) markets or exchanges.
Derivatives Market – Futures, options, and swaps linked to sovereign bonds.
4. Mechanics of Government Bond Trading
4.1 Issuance Process
Auctions: Competitive and non-competitive bids (e.g., U.S. Treasury auctions).
Syndication: Banks underwrite large bond deals for global distribution.
Private Placements: Direct sales to select investors.
4.2 Bond Pricing & Yields
Bond prices are inversely related to yields. Key concepts:
Coupon Rate – Fixed interest payments.
Yield to Maturity (YTM) – Return if held to maturity.
Yield Curve – Plot of yields across different maturities, signaling market expectations.
4.3 Trading Platforms
OTC Networks – Banks, dealers, and institutional investors.
Electronic Platforms – Bloomberg, Tradeweb, MarketAxess.
Futures & Options Markets – CME, Eurex, SGX for hedging and speculation.
5. Role in Global Finance
5.1 Benchmark for Risk-Free Rate
U.S. Treasuries, German Bunds, and JGBs are benchmarks for pricing corporate bonds, loans, and derivatives.
5.2 Safe Haven Asset
In crises, investors flock to sovereign bonds of stable countries (U.S., Switzerland, Japan), causing yields to fall.
5.3 Monetary Policy Transmission
Central banks buy or sell government bonds (open market operations) to influence liquidity and interest rates.
5.4 Reserve Asset
Foreign exchange reserves of central banks are largely invested in government bonds of major economies.
5.5 Capital Flows & Exchange Rates
Sovereign bond yields attract global capital. For example, higher U.S. yields attract inflows, strengthening the dollar.
6. Risks in Sovereign Debt
6.1 Credit Risk
Risk of default—Argentina (2001), Greece (2010), Sri Lanka (2022).
6.2 Currency Risk
Foreign investors in local currency bonds face FX volatility.
6.3 Interest Rate Risk
Bond prices fall when interest rates rise.
6.4 Liquidity Risk
Some emerging market bonds lack active secondary markets.
6.5 Political & Geopolitical Risk
Political instability, sanctions, or wars disrupt repayment.
Challenges & Controversies
Debt Sustainability – Rising debt-to-GDP ratios in U.S., Japan, Italy spark long-term concerns.
Monetary Financing – Central banks buying government debt blurs fiscal-monetary boundaries.
Market Concentration – Dominance of few large investors (e.g., BlackRock, Vanguard).
Geopolitics – Sanctions on Russia’s bonds, China-U.S. tensions, weaponization of reserves.
Conclusion
Sovereign debt and global government bond trading are central pillars of the modern financial system. They provide safety for investors, benchmarks for pricing, liquidity for monetary policy, and capital for governments. However, sovereign debt markets are not without risks—ranging from defaults and political upheavals to interest rate shocks and currency crises.
As the world enters an era of high debt, climate imperatives, digital finance, and geopolitical fragmentation, sovereign debt will continue to shape the future of international finance. Global government bond trading, once limited to elite institutions, is now a truly worldwide marketplace reflecting the interconnectedness of economies.
Ultimately, sovereign debt is not just about borrowing; it is about trust—the trust of citizens in their governments, and of global investors in the financial system.

Ethereum price pullback before Fed rate cutsWith the FED rate cuts just around the corner. The market is screaming bullish and euphoric. I do see this $4,200-$4,300 level being tested before moving higher during or after the cuts are announced.
Could we see a buy the rumour and sell the news event?

Looks like we should wait for a price correction.Support and resistance points are clear
Explanation stated on YouTube

ETH is about to go WILD!If we agree that this is the real overall current context pull on CRYPTOCAP:ETH than we get this result:
Biggest support: 3.5k
Magnet levels: 6k - 8k
The highlighted backtest of double red tells me that we found acceptance back in this context pull making this pull legit! Thoughts?

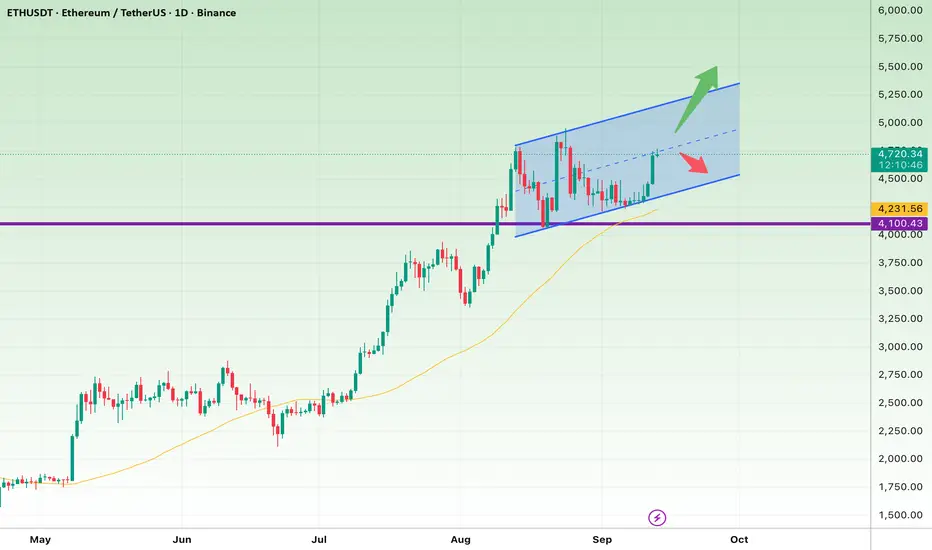
Ethereum (ETH) – Ready for the Next Breakout?Ethereum is trading inside a strong ascending channel and currently sitting around the mid-zone. The trend remains bullish, supported by the 50-day MA just below.
Key Levels to Watch:
Support Zone: $4,100 – $4,230 → Losing this level could trigger a deeper pullback.
Resistance Levels:
First hurdle: $4,800 – $4,900
Next target: $5,200 – $5,300 (channel top)
Bullish Scenario: A solid close above $4,700 could push ETH toward $5K and even $5,300.
Bearish Scenario: Breaking below $4,100 may confirm a correction back to lower levels.
Takeaway:
Ethereum is still in a healthy uptrend, and all eyes are on the $4,700 breakout level. If the bulls hold momentum, the next leg higher could be just around the corner!
Long trade
Pair ETHUSDT
Sat 13th Sept 25
4.30 am
LND session AM
Entry 4723.05
Profit level 4757.96 0.74%)
Stop level 4718.18 (0.10%)
RR 7.17
Observations 5min TF
Buyside bias:
Volume increase upheld
Making higher lows -5min TF
FVGs forming below lows
RSI above 50%
Trendline support 5min TF
Trade idea based on the narrative of SMCs and the Volume Spread Indicator, and reading the Tape to form a buy-side bias.

Ethereum Road Ahead of September 17thGood morning. As I wrote in my previous post, this is my first time here. If you like it, please subscribe and support the post.
Weekends are a good time for market makers, when the market is very weak. Before pushing the price up, they need to collect liquidity by hitting long stop-losses, so that no one stands in the way of growth after a possible rate cut.
All the major short positions above have already been closed. Now it’s time to move down. The extreme downside target is $4,200. Market makers don’t necessarily have to push it all the way there—they may stop earlier. It all depends on whether long traders panic and start closing their positions, or keep holding on until the “bitter end.”
The market should always be analyzed in real time, not by “fortune-telling on daisies.” Please don’t forget to subscribe and support my post. That will determine whether it makes sense for me to keep writing further.
Wishing you a great weekend and all the best!

ETH Summer BearishA potential path for ETH before resuming a bullish major trend, is drawn with a purple arrow.
I don't think the FED will cut rates today. In fact, maybe in September. Maybe. If the FED cut rates, then the target scenario (green box in the chart) would not play out, we would shift to a bullish movement. I wish for that, but I don't think is near yet.
That being said, the current potential risk, I calculated it to -30% from current levels. Exact prices are impossible to predict, rather I focus on target areas.
DISCLAIMER:
Do Your Own Research, don't use mine to invest! This is not a financial advice, it is only a mere opinion of mine. I own several cryptocurrencies, including ETH.

ETH/USDT Breaks RangeETH/USDT has broken its range in an upside move. A Bullish Trend can also be seen on 1H Timeframe.
If the trend continues, it could give us a 1:2 Risk:Reward setup. If price hits our TP1 after triggering the Buy-Stop order, just break even the SL and wait for the price to go towards TP2.

ETHUSDT Breaks Downtrend, Bullish Structure HoldsEthereum has broken above the recent red downtrend line, reclaiming momentum after a brief consolidation. The broader structure remains bullish as long as price respects key daily and weekly supports. This setup offers swing opportunities with clear risk levels.
🔍 Technical Analysis
Current price: $4,433
Break above the descending red trendline confirms bullish momentum.
Supports below align with major daily and weekly demand zones.
🛡️ Support Zones & Stop-Loss (White Lines):
🟢 $3,730 – Daily Support
Key short-term defense.
Stop-loss: Below $3,536
🟡 $2,680 – Weekly Support
Stronger swing entry zone.
Stop-loss: Below $2,481
🟠 $1,848 – Daily Support (Long-Term Buy Zone)
Macro level for deeper entries.
Stop-loss: Below $1,745
🧭 Outlook
Bullish Case: Break of red downtrend + hold above $3,730 → continuation higher toward $4,600–$4,800.
Bearish Case: Break below $3,730 → correction into $2,680. Losing $2,680 exposes $1,848.
Bias: Bullish while above $3,730.
🌍 Fundamental Insight
Ethereum continues to benefit from network upgrades, growing ETH staking, and institutional adoption. Macro drivers like potential U.S. rate cuts and weaker USD also support crypto upside. Risks include regulatory pressure and shifts in liquidity.
✅ Conclusion
ETHUSDT has broken its recent downtrend and is holding bullish structure above $4,400. Support zones at $3,730, $2,680, and $1,848 provide clear swing levels for traders.
⚠️ Disclaimer
This analysis is for educational purposes only and does not constitute financial, investment, or trading advice.

Eth bullish trade planEthUSDT is bullish in the hourly timeframe, already overbought, expecting it for retracement.
I am sharing my trade plan.
Please comment, do you think it will work?

Ethereum Trade Setup - Sep 12th📲 NFX Trade Alert – Swing Setup
💹 Instrument: BINANCE:ETHUSD Ethereum (ETHUSD.r)
🛒 Trade Type: Swing – Buy at Market
📍 Entry: $4,540
⛔ Stop Loss: $4,450
✅ Target Profit: $4,950
📊 Trade Setup Analysis – Ethereum
Ethereum has finally broken through the $4,500 block order, which is now acting as solid support after multiple rejections on both the H1 and H4 timeframes.
With this breakout confirmed, price has no significant resistance until $4,650 (minor) and $4,850 (major). This opens the path for higher prices in the near term.
⚖️ As always, manage risk carefully — even a high-probability setup requires discipline and protection.💚


Short-term analysisEthereum managed to break through a very significant resistance level, and if confirmed without being a fake breakout, the price could easily reach the **4,666.66** area.
However, for entering a position, you should wait for strong confirmation, as there is a high chance that the breakout could turn out to be fake.

ETHUSDT – Breakout from Contraction Zone Setup:
Ethereum (ETH) has been consolidating in a tight range for several weeks, holding above its 50-day and 200-day moving averages. Price has now pushed above short-term moving averages and cleared the local resistance zone, signaling renewed momentum.
Entry:
🔹 Buy near $4,420–4,450 on confirmation of breakout.
Stop:
🔻 Place stop just below supertrend and recent swing low at $4,050 (tight risk management).
Targets:
🎯 $4,700 (first target, prior swing high)
🎯 $5,000+ (measured move if momentum expands)
Why I Like This Trade:
✅ Strong base & contraction → volatility squeeze setup
✅ Clear risk level (tight stop) for high R/R
✅ Market sentiment improving, crypto strength building
⚠️ Risk Note: Watch for sharp volatility around macro data releases — consider reducing size or scaling in gradually.
DISCLAIMER : The content and materials featured are for your information and education only and are not attended to address your particular personal requirements. The information does not constitute financial advice or recommendation and should not be considered as such. Risk Management is Your Shield! Always prioritise risk management. It’s your best defence against losses.

Continuation of Ethereum’s rangeUnlike many currency pairs and Bitcoin, Ethereum showed no reaction to today’s news and is still moving within the same previous range. In such cases, this itself is a signal — meaning that whichever side the price manages to break the range from, the move will likely be strong, since the price has already made up its mind. At the moment, if you are insisting on opening a position on this coin, you can trade based on the range pattern. ✅
