Ethereum Price Bounces Off 7-Week Low—Future Still Promising?Ethereum trades at $4,187, just under the $4,222 resistance level after rebounding from a $3,872 low. This recovery highlights buyer interest at support levels. However, the broader market remains cautious, waiting to see whether Ethereum can sustain momentum and reclaim critical price barriers.
If Ethereum breaches $4,222, it could flip this level into support, potentially extending gains. Still, breaking above $4,500 will be difficult without fresh inflows. Limited liquidity and investor hesitation could keep Ethereum rangebound, consolidating until stronger catalysts emerge in the market.
On the downside, failure to maintain support could reignite bearish sentiment. If selling intensifies, Ethereum might slip through $4,074 and retest $3,872. Such a decline would invalidate the bullish outlook.
USDTETH.P trade ideas

ETH climbs toward key resistance in rising channelThe ETH/USDT 4‑hour chart shows a recovery rally unfolding within a broader downtrend. After a sharp decline earlier in September, prices have been climbing in a rising channel, while still respecting the boundaries of a larger descending channel. Short‑term momentum has shifted bullishly as higher highs and higher lows form inside this smaller channel, and trend indicators suggest strengthening buyers.
Upcoming U.S. economic releases—non‑farm payrolls, the Consumer Price Index, and the Federal Reserve’s October meeting—could inject volatility into the crypto market. These events often alter investor expectations for interest rates and risk assets, so traders should be prepared for sudden swings.
Trade view: A bullish setup would involve waiting for a decisive break and retest above recent highs in the rising channel, with targets at the next major resistance area. A bearish setup would trigger if the asset falls below the rising channel’s base, aiming for the previous swing low and then the broader channel floor. In both cases, stops should be placed just beyond the invalidation level, and risk‑to‑reward ratios should be kept favorable.
Overall, ETH remains in a corrective rebound within a longer‑term downtrend. A confirmed breakout from this pattern could signal a larger upside move, while failure to hold the current support zone might send prices back toward prior lows.

[SeoVereign] ETHEREUM BEARISH Outlook – September 30, 2025Hello everyone,
As of September 30, I would like to share my perspective on an Ethereum short position.
At present, I believe that Bitcoin, among others, still has one more downward wave remaining. Therefore, I am closely monitoring Bitcoin’s movement to capture the timing of its bearish reversal. Given that Bitcoin is likely to enter a declining phase, I am presenting a bearish scenario for Ethereum as well.
The basis of this idea is relatively clear: the entire structure is formed according to the classical ratio relationships of Elliott Wave Theory. All detailed ratios and projections have been drawn on the chart for your reference.
-Ratio Relationships
1. WAVE.C = WAVE.A * 1.618
2. WAVE.C = WAVE.A * 0.786
3. WAVE.C = WAVE.A * 1.272
The average target price for this decline is set around 4030 USDT.
As always, I will continue to share updates on position management based on this idea as the chart develops.
Thank you for reading.

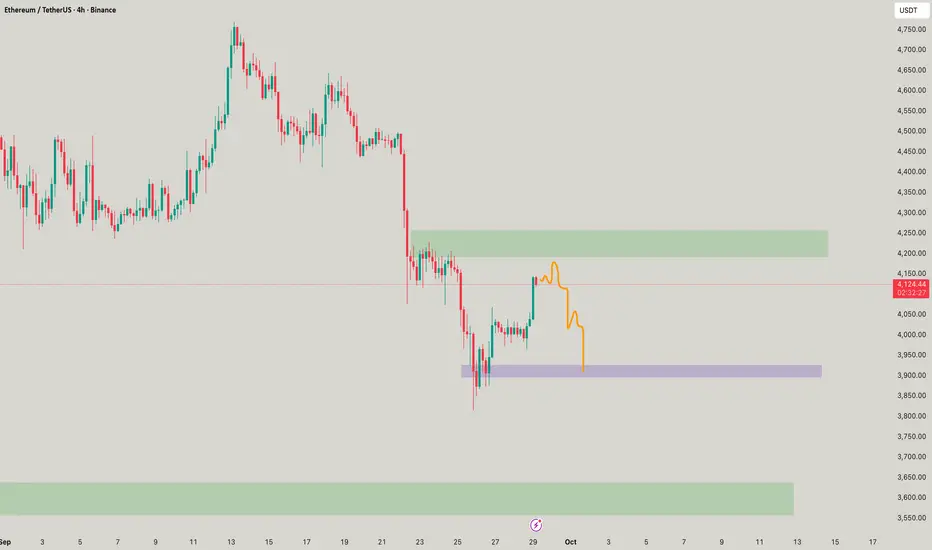
Is ETH Bottomed?
Observations from ETH 4 Hour Charts – 2025-09-28
• ETH is currently in a downtrend
• Key Support is $3945, Key resistance is $4202
• Projected time for trend reversal is early November with the following two Consolidation Ranges (CR): $3945 and $4202 then break and hold above $4200 level.
Warning Sign (Further Dropping)
1). Cannot make new lower lows than $3821.02
Play Strategy
Swing Trader: Trade the ranges.
Long-term Investor: Buy in dip, 20% - 30% buy

ETH - SUpercharged? Or Yet a move to be faked?ETH is charging itself up but the move was rather a fake one, ecpecting reversals in full
Ethereum Price Hits 6-Week Low, But Here Lies An OpportunityAt press time, Ethereum is trading at $3,938, attempting to establish $3,910 as a support floor. This decline marks a crucial break below the $4,000 level, highlighting short-term weakness.
Given current signals, ETH may remain rangebound under $4,074 resistance until stronger bullish cues emerge. Market sentiment suggests consolidation rather than sharp recovery, keeping investors cautious.
However, if Ethereum flips $4,074 into support, a push toward $4,222 could follow. This move would require investor participation and sustained inflows to counter bearish momentum, ultimately invalidating the short-term negative outlook.

Hot Investment Sectors to Watch in 2025:Future of Global Capital1. Artificial Intelligence and Machine Learning
Artificial Intelligence (AI) and Machine Learning (ML) continue to be at the forefront of technological innovation. In 2025, AI is increasingly integrated into various sectors, including healthcare, finance, and manufacturing, driving efficiency and creating new business models. The proliferation of AI-as-a-Service platforms and advancements in natural language processing and computer vision are expanding the applicability of AI across industries.
Key Investment Areas:
AI Software and Services: Companies developing AI algorithms and providing AI solutions are experiencing rapid growth. Investments in AI startups and established tech firms focusing on AI capabilities are gaining momentum.
Automation and Robotics: The adoption of AI-driven automation in manufacturing and logistics is enhancing productivity and reducing operational costs. Investors are keen on companies leading in robotics and automation technologies.
AI Infrastructure: The demand for specialized hardware, such as AI chips and data centers optimized for AI workloads, is rising. Investments in semiconductor companies and cloud infrastructure providers are attracting attention.
Risks and Considerations:
Ethical and Regulatory Challenges: The rapid development of AI raises concerns about privacy, security, and ethical implications. Investors must stay informed about evolving regulations and public sentiment regarding AI technologies.
Market Volatility: The AI sector is characterized by high volatility, with startups experiencing significant fluctuations in valuations. Diversification and thorough due diligence are essential for mitigating risks.
2. Renewable Energy and Clean Technologies
The global shift towards sustainability is accelerating investments in renewable energy and clean technologies. In 2025, the International Energy Agency (IEA) projects global energy investment to reach a record $3.3 trillion, with $2.2 trillion allocated to renewables, nuclear, and energy storage—double the amount for fossil fuels.
Key Investment Areas:
Solar and Wind Energy: Solar energy leads clean technology spending with $450 billion expected, driven by increased exports to emerging economies. Wind energy financing, both onshore and offshore, grew by about 25%, particularly in China and Europe.
Energy Storage Solutions: Battery storage investment is rising to about $66 billion, addressing the intermittency of renewable power sources.
Grid Infrastructure: Investments in grid modernization and smart grid technologies are essential to accommodate the increasing share of renewable energy in the power mix. The IEA highlights a shortfall in grid infrastructure spending, currently at $400 billion annually, which lags generation investments and poses risks to electricity security.
Risks and Considerations:
Policy and Regulatory Risks: Changes in government policies and subsidies can significantly impact the profitability of renewable energy projects. Investors should monitor policy developments and government incentives in key markets.
Technological Risks: Advancements in energy storage and grid technologies are critical for the integration of renewable energy. Investors should assess the technological maturity and scalability of solutions offered by companies in this sector.
3. Healthcare Technology and Biotechnology
The healthcare sector is experiencing a technological renaissance, with innovations in biotechnology, digital health, and personalized medicine transforming patient care and treatment outcomes. The "biotech boom" refers to a period of rapid growth in the biotechnology sector, fueled by groundbreaking innovations, increasing investments, and expanding global demand for advanced medical, agricultural, and environmental solutions.
Key Investment Areas:
Biotechnology: Advancements in gene editing technologies like CRISPR, immunotherapies, and regenerative medicine are opening new frontiers in disease treatment. The biotech market is projected to grow from $1.74 trillion in 2025 to $5.04 trillion by 2034.
Digital Health: Telemedicine, wearable health devices, and AI-driven diagnostics are revolutionizing healthcare delivery. Investments in healthtech startups and digital health platforms are gaining traction.
Pharmaceuticals: The development of personalized medicines and targeted therapies is enhancing treatment efficacy and patient outcomes. Pharmaceutical companies focusing on innovative drug development are attracting investor interest.
Risks and Considerations:
Regulatory Hurdles: The healthcare industry is heavily regulated, and changes in regulations can impact the approval and commercialization of new therapies and technologies. Investors should stay informed about regulatory developments in key markets.
Clinical Trial Uncertainties: The success of biotech investments is often contingent on the outcomes of clinical trials. Investors should assess the risk profiles of companies based on their clinical trial pipelines and success rates.
4. Cybersecurity
As digital transformation accelerates, the need for robust cybersecurity measures becomes paramount. In 2025, the cybersecurity sector is experiencing heightened demand due to increasing cyber threats and regulatory requirements for data protection.
Key Investment Areas:
Cybersecurity Software and Services: Companies providing endpoint security, cloud security, and threat intelligence services are witnessing increased adoption across industries.
Identity and Access Management: Solutions that ensure secure user authentication and access control are critical as organizations move towards zero-trust architectures.
Security Infrastructure: Investments in hardware and infrastructure that support secure networks and data centers are essential for protecting organizational assets.
Risks and Considerations:
Evolving Threat Landscape: Cyber threats are constantly evolving, and companies must continuously update their security measures to address new vulnerabilities. Investors should assess the adaptability and innovation capabilities of cybersecurity firms.
Market Competition: The cybersecurity market is highly competitive, with numerous players offering similar solutions. Investors should evaluate companies based on their market positioning, technological differentiation, and customer base.
5. Infrastructure and Real Estate
Infrastructure development and real estate investments remain attractive in 2025, driven by urbanization, population growth, and government spending on public works. The global infrastructure investment gap presents opportunities for private capital to participate in large-scale projects.
Key Investment Areas:
Smart Cities: Investments in urban infrastructure, including transportation, utilities, and communication networks, are essential for developing smart cities.
Green Building Projects: Sustainable construction practices and energy-efficient buildings are gaining popularity, driven by environmental regulations and consumer preferences.
Public-Private Partnerships: Collaborations between governments and private investors in infrastructure projects offer opportunities for stable returns and long-term growth.
Risks and Considerations:
Political and Regulatory Risks: Infrastructure projects are subject to political decisions and regulatory approvals, which can impact project timelines and profitability. Investors should assess the political stability and regulatory environment of the regions where they invest.
Capital Intensity: Infrastructure investments often require significant capital outlays and have long payback periods. Investors should consider the liquidity and financial stability of infrastructure funds and projects.
Conclusion
The investment landscape in 2025 offers a plethora of opportunities across various sectors, each driven by unique technological advancements, societal shifts, and economic factors. While these sectors present promising growth prospects, they also come with inherent risks that require careful consideration and strategic planning. Investors should conduct thorough due diligence, diversify their portfolios, and stay informed about global trends to navigate the complexities of the evolving investment environment successfully.

ETHEREUM LAST STAND..Ethereum is above the daily EMA100 and long-term support line, with bullish RSI divergence, making me very bullish on Ethereum from here.

ETH short trade Eth is very downtrend. Price is approaching to supply area with rsi indicating overbought level. We have a clean break of Structure which shows selling pressure is still active.
Moreover, with the multi time frame analysis, the price is below 200 ema which correlates with the 4hr, 1hr, 30m, and 15m, signaling a bearish bias.

Ethereum ShortAs U.S. Treasury yields and the U.S. dollar continue to strengthen, The crypto market continues its selloff. I have outlined some key areas where bulls will start to nibble on longs. Shorts are still open for at least another 2% down.

Critical Moment for ETH – Support or Breakdown?Ethereum is sitting on the key $4,000 level with strong downward momentum. The big question: will this support hold or break? I’ve been saying for a while that $3,500 is still on the table.

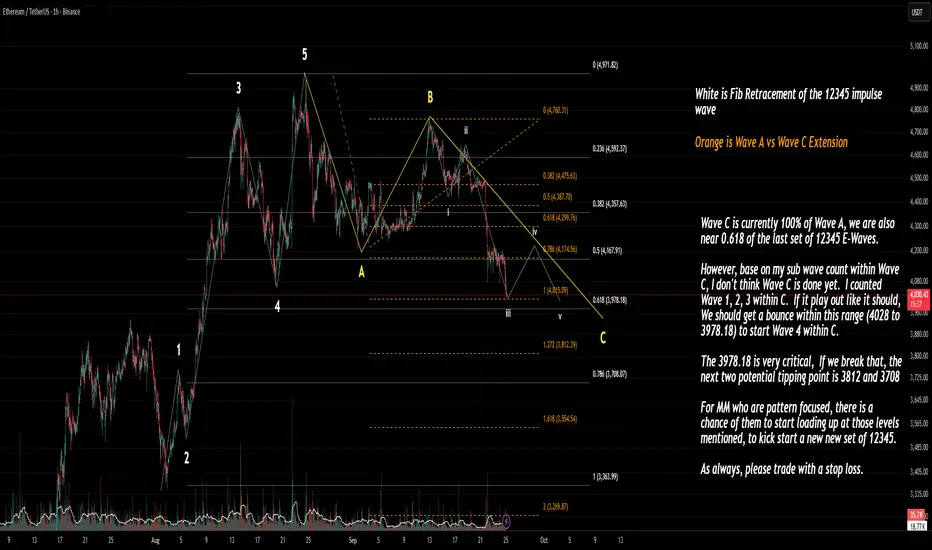
Elliott Wave Ethereum / Fibonacci LevelWave C Progress:
Wave C has already reached 100% of Wave A.
Price is sitting near the 0.618 retracement of the previous 12345 impulse wave.
Subwave Count Inside Wave C:
I have counted Waves 1, 2, 3 inside C.
If this sub-count is correct, a Wave 4 bounce is expected soon in the 4028 – 3978 zone.
Critical Levels
4028 – 3978.18: Expected bounce range (Wave 4 inside C).
3978.18: Key level — breaking it opens the door to deeper downside.
If broken, the next supports are:
3812 (1.272 extension)
3708 (0.786 retracement of entire impulse)
Implications
If 3978 holds, ETH may stage a corrective bounce (Wave 4) before a possible Wave 5 inside C.
If 3978 fails, 3812 and 3708 are the next tipping points where market makers/pattern traders might start accumulating for a new 12345 impulse set.
Watch for a bounce between 4028–3978.
Lose 3978, and 3812/3708 become the big decision zones for the next move.
ETHUSDT 1D chart Review1. Trendline (orange) - was clearly pierced down → it is a signal of weakening the growth moment.
2. Horizers of support / resistance:
• Resistance: $ 4,604 (strong), above $ 4,960.
• Support: $ 4 150 (currently tested), next $ 3,958 and $ 3,696.
3. Price - currently ~ 4 169 $, i.e. right with the support of $ 4 150.
4. Candles - a strong inheritance candle after piercing the trend → weakness signal.
5. STOCHASTIC RSI - in the sales zone (<20), which may suggest the possibility of short -term reflection.
⸻
🔹 Application:
• Short date: possible reflection from $ 4 150 thanks to the sale (technical bounce).
• average date: If level $ 4 150 breaks and the candle closes below → the road opens to $ 3,958 and even $ 3,696.
• Only a return above $ 4 272 and a retest trendline from below would give a signal of buyers.
⸻
👉 To sum up: The market is in the critical zone - support $ 4 150 decides.
• Bull: keeping the defense of this level + reflection from the sale.
• Bear: loss $ 4 150 = greater correction in the direction of $ 3 950–3 700.

Eth max pain on this Friday is 3600This Friday :
Btc option max pain 110k
Eth option max pain 3600
We are noticed that 3966 is the 0.382 fibo support for the past 3 weeks uptrend wave. But,
Please don't long at 3966 in this week.
This week trading strategy should be short at 4400. Eth need to test STR (support turn resistance) area before drop. and short it all the way to 3600.
If u like mine trading idea. Please hit me a like, rocket and leave a comment for me.

ETH/USDTCurrently trading in a local consolidation, moving within its range expansion.
After a deviation below the range low, long setups can be considered — but only if confirmation conditions are met.
Potential short opportunities may appear in the 4400–4500 zone, again only with proper confirmations.

ETH/USD: Correction Continues, Key Support at 4062.50ETH/USD trades within a long-term bullish trend, but after the Fed’s recent rate cut the pair moved into a correction. Price is testing the lower boundary of the short-term range 4687.50–4062.50 (Murray – , Fibo 23.6%).
• A breakout below 4062.50 could extend the decline toward 3540.00 (Fibo 38.2%) and 3125.00 (Murray , Fibo 50.0%).
• A breakout above 4687.50 would confirm bullish continuation to 5000.00, 5312.50, and 5625.00.
⸻
🔎 Indicators
• Bollinger Bands: flat, range-bound trading.
• MACD: preparing to cross into negative.
• Stochastic: oversold, possible upward reversal.
• Weekly trend remains bullish, but correction toward 3540.00 is possible.
⸻
🏷️ Key Levels
• Resistance: 4687.50, 5000.00, 5312.50, 5625.00
• Support: 4062.50, 3540.00, 3125.00
⸻
📈 Trading Plan
Scenario 1 – SELL STOP
• Entry: 4062.45
• TP: 3540.00, 3125.00
• SL: 4500.00
• Timeframe: 1W
Scenario 2 – BUY STOP
• Entry: 4687.55
• TP: 5000.00, 5312.50, 5625.00
• SL: 4490.00

AI Trading Future in Global TradeChapter 1: Evolution of Trading in the Global Economy
To understand the role of AI in global trade, it’s important to trace the evolution of trading systems:
Manual Trade Era (Pre-20th Century):
Trade was conducted through physical exchanges, manual record-keeping, and human negotiation. Market knowledge was limited, and trading was highly localized.
Industrial Trade Era (19th–20th Century):
The rise of banks, stock exchanges, and global shipping allowed trade to scale. Telegraphs and later telephones enabled faster communication, but human decision-making still dominated.
Digital Trade Era (Late 20th Century):
Computers, internet, and digital platforms enabled electronic trading. Global trade volumes multiplied, and finance became increasingly algorithm-driven.
AI-Driven Trade Era (21st Century Onwards):
AI introduced self-learning systems capable of analyzing global data, predicting risks, and automating trades at lightning speed. AI isn’t just helping human traders—it is becoming a trader in its own right.
Chapter 2: AI in Global Trade – Key Dimensions
AI’s role in global trade is multi-dimensional. Let’s break it down into areas where it is most impactful:
2.1 AI in Financial Trading
Algorithmic Trading: AI algorithms execute stock, currency, and commodity trades within milliseconds, capturing opportunities humans would miss.
Risk Management: AI models analyze geopolitical risks, currency fluctuations, and commodity price swings to protect investments.
Prediction Models: Machine learning tools predict demand and price trends based on historical patterns, news, and even social media sentiment.
2.2 AI in Supply Chain & Logistics
Predicting demand and inventory needs across borders.
Optimizing shipping routes using AI-powered logistics systems.
Detecting disruptions such as port delays, natural disasters, or conflicts.
Automating customs and compliance checks with AI-driven platforms.
2.3 AI in Trade Finance
Credit Assessment: AI evaluates the financial health of buyers/sellers faster than banks traditionally do.
Fraud Detection: Machine learning spots suspicious trade transactions to reduce global trade fraud.
Smart Contracts: Blockchain combined with AI automates payments once shipment conditions are met.
2.4 AI in Policy and Regulation
Governments and international organizations are adopting AI to:
Monitor illegal trade and smuggling.
Predict economic impact of tariffs and sanctions.
Strengthen cybersecurity in financial systems.
Chapter 3: Opportunities Created by AI Trading in Global Trade
The fusion of AI and trade opens up massive opportunities:
Efficiency Gains
Faster decision-making in trading.
Reduced human error and biases.
Optimized global logistics saving billions in costs.
Wider Market Access
Small businesses in developing nations can use AI platforms to connect with global buyers.
AI-powered marketplaces lower barriers to entry.
Risk Reduction
AI predicts financial and political risks, reducing trade shocks.
Helps governments stabilize currency and commodity markets.
Personalization in Trade
AI allows companies to customize global offerings based on regional consumer preferences.
Green & Sustainable Trade
AI helps optimize energy-efficient shipping and sustainable sourcing.
Chapter 4: Risks and Challenges
No revolution comes without challenges. AI in global trade has its share of risks:
4.1 Economic Risks
Market Manipulation: Powerful AI trading systems could manipulate markets for unfair advantage.
Job Displacement: Traditional roles in trade, logistics, and banking may be automated.
4.2 Ethical Risks
Bias in AI Models: Trade finance models may disadvantage certain countries or small players.
Transparency Issues: Black-box AI models make it hard to explain why certain trade decisions were made.
4.3 Geopolitical Risks
AI Arms Race: Nations may compete in developing the most powerful AI for trade dominance.
Cybersecurity: AI-driven trade platforms may become targets for hackers.
4.4 Regulatory Challenges
Lack of global standards for AI in trade.
Difficulty in monitoring cross-border AI trading platforms.
Chapter 5: Case Studies of AI in Global Trade
Alibaba’s AI-Powered Logistics (China):
Alibaba uses AI to predict demand and optimize shipping routes for global e-commerce.
IBM Watson in Trade Finance:
IBM Watson is helping banks automate trade finance document verification, reducing fraud.
AI in Shipping (Maersk):
Maersk deploys AI to optimize container routes and predict shipping delays.
Stock Market AI (Wall Street & NSE):
High-frequency trading firms deploy AI to trade currencies, equities, and commodities at scale.
Chapter 6: The Regulatory Landscape
The future of AI in global trade also depends heavily on how it is regulated.
World Trade Organization (WTO): exploring frameworks for AI-driven trade.
National Governments: building AI ethics laws and data protection rules.
Global Cooperation: need for cross-border agreements to regulate AI-driven trading.
Chapter 7: The Future of AI Trading in Global Trade
Looking ahead, AI trading will evolve along these lines:
Hyper-Automation of Global Markets
AI will handle most cross-border transactions with minimal human intervention.
Decentralized AI Trading Platforms
Blockchain + AI will power decentralized global trade, reducing dependence on intermediaries.
Digital Currencies & CBDCs
Central Bank Digital Currencies (CBDCs) combined with AI will redefine cross-border payments.
AI as a Trade Negotiator
Future AI systems may simulate global economic outcomes to guide tariff and trade negotiations.
Sustainable Global Trade
AI will optimize carbon-neutral logistics and eco-friendly sourcing.
Inclusive Trade
AI will help SMEs from developing nations gain global visibility, narrowing inequality gaps.
Chapter 8: Balancing Innovation and Responsibility
The key challenge lies in balancing AI-driven innovation with responsibility. Stakeholders must:
Build transparent AI systems.
Create fair trade algorithms.
Ensure inclusivity in access.
Develop strong cyber-defense systems.
Foster international cooperation.
Conclusion
AI trading is not just a technological shift—it is an economic revolution that will reshape the foundations of global trade. From stock exchanges in New York to shipping ports in Singapore, from small e-commerce sellers in Africa to regulators in Geneva, every actor in global trade will feel the impact.
The future is promising: faster, more efficient, and more inclusive trade powered by AI. But it also demands vigilance, regulation, and global collaboration to prevent misuse. If harnessed wisely, AI could become the great equalizer in global trade, bridging gaps, reducing risks, and creating a sustainable, interconnected world economy.

ETH Short Trade Trend: Bearish
Divergence: None
Continuation Pattern: Bearish Flag
Harmonics : AB=CD
Bias: Bearish
Scenario: Sell Stop entry at B point Breakout
*Trade Plan*
Stop Loss: 4220
Entry Level: 4040
TP1: 3860

#ETHUSDT 12H ChartPrice broke below the 4h demand zone at $4,400 turning it into a 4h breaker zone. MACD is bearish, RSI is nearly oversold and EMAs are neutral. Price bounced off the support at $4,080 after sweeping the equal lows at $4,200 and we should see a retest of the S/R flip at $4,260 as a short-term target.

Etherium ETH usdt daily analysis
Time frame 4hours
Risk rewards ratio >4.3 👈👌
Target 5.748$
I think this target is final target for this bullrun .
The 5th wave.

Ethereum: AI Models Signal Imminent Bear MarketOn August 24, 2025, Ethereum reached a new all-time high of $4,958, just below the $5,000 mark. The price is now about 10% lower but remains within striking distance. While investors are still hoping for further records, leading AI models warn that the next bear market could begin sooner than expected.
Historical Patterns
According to ChatGPT 5.0, Ethereum has historically shown sharper and faster corrections compared to Bitcoin:
During the 2017–2018 cycle, after reaching an all-time high of around $1,430 in January 2018, the price collapsed to $85 by December the same year. This represented a decline of roughly –94%, lasting about 11 months.
The next cycle in 2021–2022 followed a similar pattern, though less dramatic. ETH peaked at $4,870 in November 2021, but by June 2022 it had dropped to $880. The correction amounted to about –82% and took roughly 7 months.
ETH losses were both deeper and faster than BTC during past downturns.
ChatGPT 5.0 Forecast
• Bull Market ATH (2025): conservative $8,000, optimistic $12,000–$15,000
• Bear Market Low: $1,200–$3,000
• Timeline: Q2–Q3 2026
Other AI Forecasts
• Gemini 2.5 Pro (Google): ATH $10,000–$15,000, low $1,500–$3,000, bear market starting Q4 2025
• Claude 4 Sonnet: ATH up to $18,000, low $3,000–$4,500, possible bull run extension into Q1 2026
• Grok 4 (X/Elon Musk): ATH $15,000, low $2,400–$2,800
• Qwen 3 (Alibaba): ATH $11,500–$16,500, low $1,955–$3,630
• Kimi K2 (Moonshot AI): ATH up to $20,000, low $3,000–$5,000
• Llama 4 Maverick (Meta): ATH $12,000, low $1,800
• DeepSeek V3.1: ATH $18,000, low $2,500–$3,000
Conclusion
All AI models expect the Ethereum bear market to start by late 2025, with only a few forecasting an extension into Q1 2026. Most projections anticipate new record highs before a steep correction. The consensus for ETH’s bear market bottom ranges between $2,000 and $3,000.

ETH/USDT SHORTBSL taken now its time for SSL to be taken, targeting POC of volume profile, could turn into a swing short if market continues drop this coming week.

Weekly Insights EUR USD AUD NZD BTC ETH (22nd-25th septemer2025)Get ready for the week ahead — in this video we break down the technical outlook and key levels for major currencies and markets including EUR/USD, AUD, NZD, as well as S&P 500 and Bitcoin (BTC). We analyze recent price action, highlight important support & resistance zones, and discuss possible scenarios you’ll want to watch from September 22–26, 2025. Whether you trade forex, crypto, or equities, these insights will help you stay informed and better positioned for whatever the markets throw next.
If you want, I can give you a more detailed summary (key levels, possible trades, etc.) of the video.
