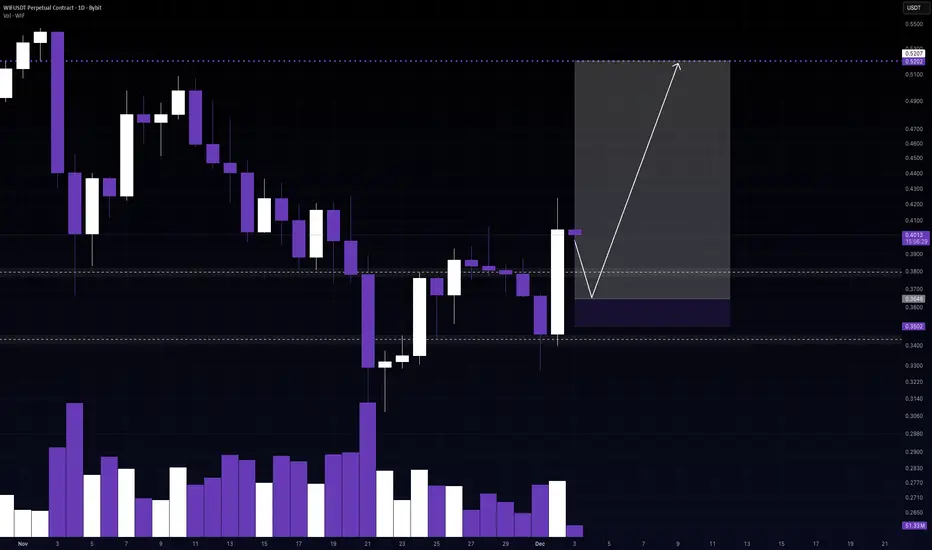
WIF - BULLISH OUTLOOK 🟩 CRYPTOCAP:WIF - Price analysis
I think we are going to see a bullish correction soon on the #alt market!📈
The Fed is expected to cut rates tomorrow, which could trigger a positive reaction across the market.📈
Here is why I am bullish:
✅ Double bottom on daily chart
✅ Bullish RSI divergence on daily
✅ Likely bullish accumulation structure (if support holds)
Current price remains stuck under the 0.410 resistance. If bulls manage to push above, we could see an explosive move toward 0.520 - $ 0.550 📈
What's your point of view? 🐕
Trade ideas

WIF/USDT — Price Pressing Into a Make-or-Break Zone?DOGWIFHAT has entered one of the most decisive phases of its entire downtrend. After months of consistent lower-highs beneath the descending trendline, the market is now compressing into the Key Support Zone at 0.38–0.285 — an area that previously acted as a re-accumulation base and a major liquidity sweep level.
This is not just support.
This is the trend-defining battleground.
The descending trendline continues to reject every attempt to recover, creating a tight squeeze between seller pressure from above and buyer defense inside the zone.
This compression often leads to a high-volatility breakout in one direction.
If buyers hold this zone, a structural reversal is on the table with targets rising step-by-step toward:
0.55 → 0.695 → 0.80 → 1.16 → 1.44
If sellers break 0.285 with a clean 4D close, momentum may shift into a fresh markdown, opening downside levels toward:
0.23 → 0.15 → 0.10
The long downward wicks previously seen in this area show liquidity manipulation, confirming that smart money is active and this zone is being defended — or hunted.
The next major move will likely be decided here.
---
🟢 Bullish Scenario
Price holds the 0.38–0.285 zone
Break + 4D close above the descending trendline
Successful retest → bullish reversal confirmed
Upside targets: 0.55 → 0.695 → 0.80 → 1.16 → 1.44
---
🔴 Bearish Scenario
4D close below 0.285
Support flips into resistance
Downside continuation targets: 0.23 → 0.15 → 0.10
#DOGWIFHAT #WIF #CryptoAnalysis #SupportZone #Breakout #CryptoTrend #PriceAction #AltcoinAnalysis

WIFUSDT – Down First… Then Blast Up Again?Alright traders, listen up.
We’ve got a beautiful little market shift happening — the kind that can send prices higher in the next days/weeks.
Here’s why the market suddenly decided to stop crying:
• Technically:
BTC finally broke the $92K resistance like it was wet paper.
Next stop?
$100K test — classic crypto boss fight.
• Sentiment:
Fear index pointing UP
Retail capitulation? DONE
Degens returning from the shadow realm.
• Fundamentals:
ETF inflows are BACK
Institutions opening their wallets
QT ending → more liquidity → more pump-potential
• Macro:
Dovish FED + weak USD = rocket fuel for risk assets
(aka “let the chaos begin”)
⸻
Now… WIF specifically?
I’m expecting a tiny wick down — probably tomorrow or Friday —
just enough to scare everyone, liquidate the weak, and reset the chart…
…and THEN the rally next week.
Classic WIF behavior.
Annoying but profitable. 😄
Nothing is 100% (crypto loves trolling),
BUT with proper risk management you can literally:
👉 Risk 1% to potentially make 10%
Absolutely insane R:R if it plays out.
⸻
⚠️ Trade safely, legends
Watch the wick
Don’t FOMO
Don’t overleverage
And don’t blame WIF if it decides to bark instead of pump 😄🐕
Good luck — this setup could be juicy! 🚀📈
WIFUSDT UPDATE#WIF
UPDATE
WIF Technical Setup
Pattern: Falling Wedge Pattern
Current Price: $0.397
Target Price: $0.633
Target % Gain: 171.40%
Technical Analysis: WIF is breaking out of a falling wedge pattern on the 1D chart, signaling a potential bullish reversal after an extended corrective phase. Price action has been compressing within the descending wedge structure and is now attempting to break above the upper resistance trendline. The breakout is supported by improving momentum, suggesting increased buyer interest. The measured move from the wedge projects a strong upside continuation toward the highlighted target zone if price holds above the breakout area.
Time Frame: 1D
Risk Management Tip: Always use proper risk management.

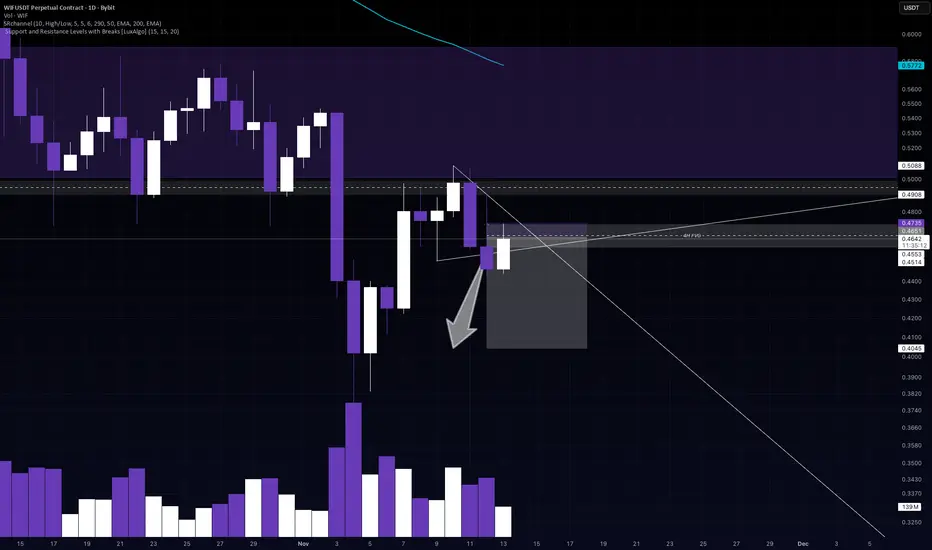
WIFUSDT — Possible Move Down? (Send It or Send Me Home)Alright, I’m hopping into this one a bit late — fashionably late, like every great crypto entry.
BUT the good news?
Because of that, we’re looking at a juicy R:R over 7:1.
Yes, SEVEN.
If this hits, I’m buying myself something nice. If it doesn’t… well, that’s what stop-losses are for. 😅
It’s definitely a riskier setup, but WIF is showing potential for another leg down in the coming days.
With an R:R like this, I’m willing to risk it — responsibly, of course… kind of.
Good luck, legends — may your trades print and your emotions stay unleveraged. 📉🔥🐕💚
WIFUSDT 1D#WIF is moving inside a falling wedge pattern on the daily chart. It is currently sitting on a weekly support zone, where the probability of a bounce is high, potentially pushing price toward the wedge-breaking resistance. Consider buying only after a solid breakout. If that breakout confirms, the potential targets are:
🎯 $0.425
🎯 $0.497
🎯 $0.556
🎯 $0.614
🎯 $0.697
⚠️ Always remember to use a tight stop-loss and maintain proper risk management.

WIF/USDT - Fresh meme coin. Trading setup in chanal. Popular fresh meme coin – Dogwifhat
📊 CoinMarketCap Rank: #102
🐦 Twitter (X) : 152K followers
💬 Telegram : 50K members
✅ Highly liquid meme coin – traded on many major exchanges, including Binance.
After the hype phase , the coin is now declining along with the overall crypto market —no exceptions. Essentially, it broke below multiple channel supports , and the price is now sitting at the support of the outer channel.
I also notice a non-textbook Head & Shoulders pattern, which suggests a potential -64% breakdown . The last squeeze happened around this level.
Currently, we are seeing consolidation with increased volume , along with high-wick price action in this zone.
I've marked potential downside support zones as well as upside resistance targets on the chart. Consider this in your trading strategy!

WIFUSDT – Continuation. Trading plan and best analysis.A trading idea for traders - for people who think, who are mentally balanced, not for those who like to gamble in a casino.
I will publish another idea publicly from the closed set.
Publicly and for free, I’m not going to explain anything about how to manage your capital, in what proportion, which zones, what orders and where, or the risks - everyone must decide this on their own (your profit depends directly on it).
This is a continuation - the previous idea delivered around +200% on average.
The overall chart shows the general expected scenarios.
Let’s break them down one by one.
1) Horizontal channels.
The price moves within similar horizontal channels.
Right now we are in the central one, in its outer support zone.
A move into the lower channel would mean complete capitulation.
2) The large descending channel.
Price action within the descending channel. All zones are marked on the chart.
A breakout and consolidation above the channel’s resistance is important.
3) Dragon.
Implementation of the ‘dragon’ trading pattern and working with it.
The phase of forming the right leg.
4) Probabilities of decline.
Clear zones. Working based on risk. The snowball effect of compound interest.
Stable capital growth is not about gambling, leveraged positions, or constant guessing about where the price will go.
**Please evaluate the trading idea if you find it useful. Thank you.**

WIFCRYPTOCAP:WIF is a no brainer OG blue chip meme coin. It’s trading inside a descending wedge pattern and the structure looks primed for reversal. From the current price to the target, there is a potential 130 percent gain to be made once the breakout confirms.

WIF/USDT – Accumulation Phase Before Potential RecoveryWIF continues to consolidate after an extended downtrend, currently trading around $0.53 within a well-defined range between $0.45 (support) and $0.85 (resistance).
The structure shows signs of base formation, with steady accumulation and reduced volatility — a setup that often precedes directional movement.
Support zone: $0.45 remains the key demand area where buyers are consistently stepping in.
Resistance zone: The main resistance to watch is near $0.85 — a breakout above could confirm trend reversal.
Volume behavior: Gradually increasing volume hints at potential momentum build-up for an upward move.
If market sentiment improves, WIF could attempt a return toward the $0.75–$0.85 zone, marking a mid-term recovery phase. For now, holding above $0.50 keeps the structure constructive for a bullish continuation.

Scalp Long – WIF💎 Scalp Long – WIF
RSI is in the buying zone, and price has broken out of the short-term downtrend, confirming bullish momentum.
Buying volume is rising sharply, with capital flowing back into meme coins, strengthening the long bias.
🎯 Plan:
→ Enter after confirmation of breakout continuation.
→ TP: 0.568 | SL: 0.494 | RR: 1 : 2.52
Momentum supports the long side.
Keep entries tight, trail SL as price climbs.
Stay disciplined — only engage when the setup confirms.

HTF Altcoin accumulationsThere is this scenario in my head, after seeing most of the altcoins taking out the range low, where you turn this in a HTF accumulation. There is nothing but liquidity to the upside, so if you can establish a 3rd tap POI by creating a low, this could be then later be the target to confirm an accumulation. This will most likely be my main scenario for most of the altcoins until i see something different develop.
Is it time for Dog to start bite again?... you can se 4H chart... support line... which look like good support... downtrend green line... which need to be broken... Fibonacci 61% is also in our favor...
I already buy some WIF, will not wait for breaking downtrend line...
I think we could rise atleast to 1.13...1.39... and in Long term above 2$ again and so on... will see... and BTC should be strong too... without him... al is weak
what do you think?

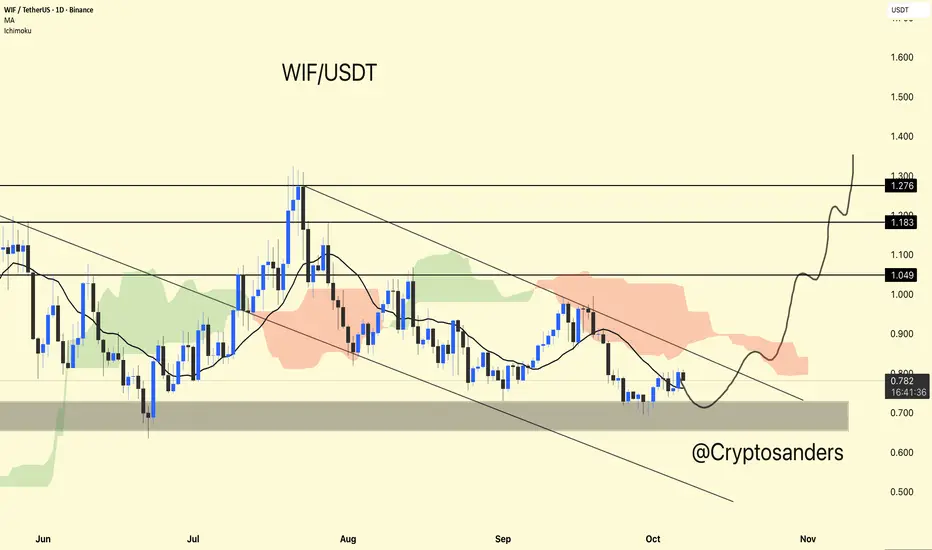
WIF/USDT chart Update !!📊 WIF/USDT Update
WIF is holding strong within the key demand zone of $0.70–$0.75 and is showing signs of reaching lower levels.
Currently trading around $0.78, the price is forming a falling wedge – a potential bullish reversal setup.
A clear breakout above $0.85 could accelerate momentum in this direction:
🎯 Targets: $1.05 → $1.18 → $1.27+
As long as WIF remains above $0.70, the bullish trend remains intact.
🛑 A breakdown below that area would invalidate this setup.
Patience here could yield significant profits.
DYOR | NFA
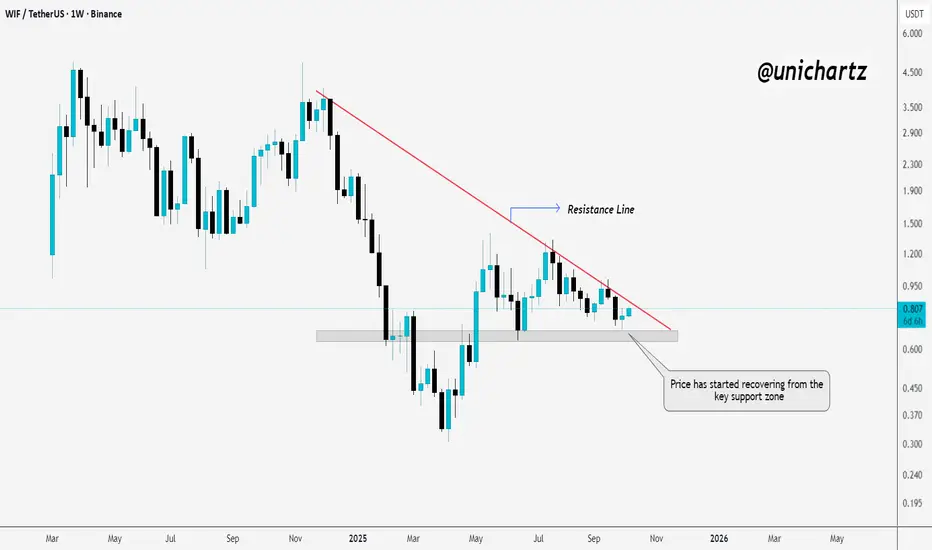
WIF Weekly Reversal SetupSEED_WANDERIN_JIMZIP900:WIF is showing early signs of strength after bouncing from the key support zone.
A breakout above the descending resistance line could confirm a fresh bullish wave.
DYOR, NFA
#PEACE
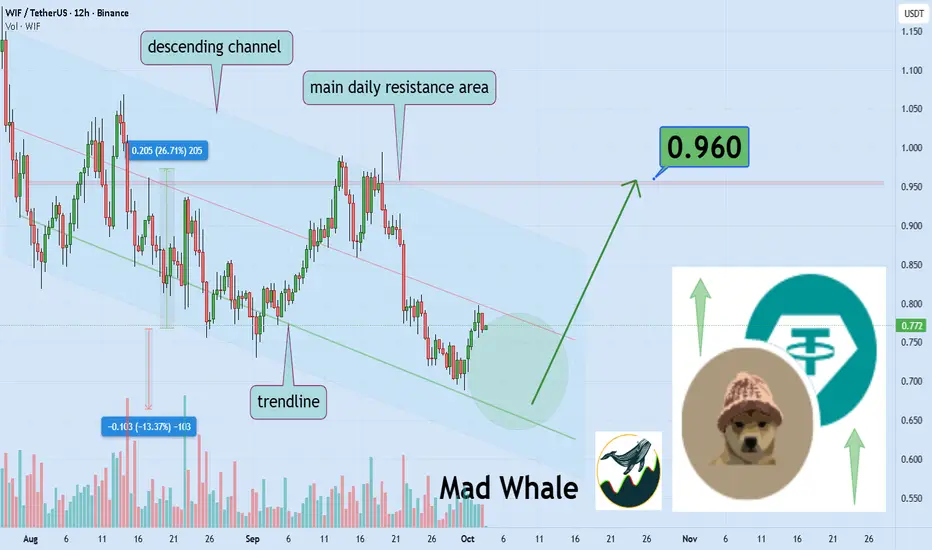
Dogwifhat Approaches Resistance: 26% Upside Possible to $0.96Hello✌️
Let’s analyze Dogwifhat’s price action both technically and fundamentally 📈.
🔍Fundamental analysis:
Whales loaded up on WIF near $0.83, but retail is still quiet.
📊Technical analysis:
BINANCE:WIFUSDT is trading within a descending channel, hovering near key daily trendlines. A breakout above the upper resistance could trigger a potential 26% rally toward $0.96.
📈Using My Analysis to Open Your Position:
You can use my fundamental and technical insights along with the chart. The red and green arrows on the left help you set entry, take-profit, and stop-loss levels, serving as clear signals for your trades.⚡️ Also, please review the TradingView disclaimer carefully.🛡
✨We put love into every post!
Your support inspires us 💛 Drop a comment we’d love to hear from you! Thanks, Mad Whale
433% after breakout trendlineAs you can see from the chart, a price is approaching the blue trendline, and if it breaks, it could reach 433%.
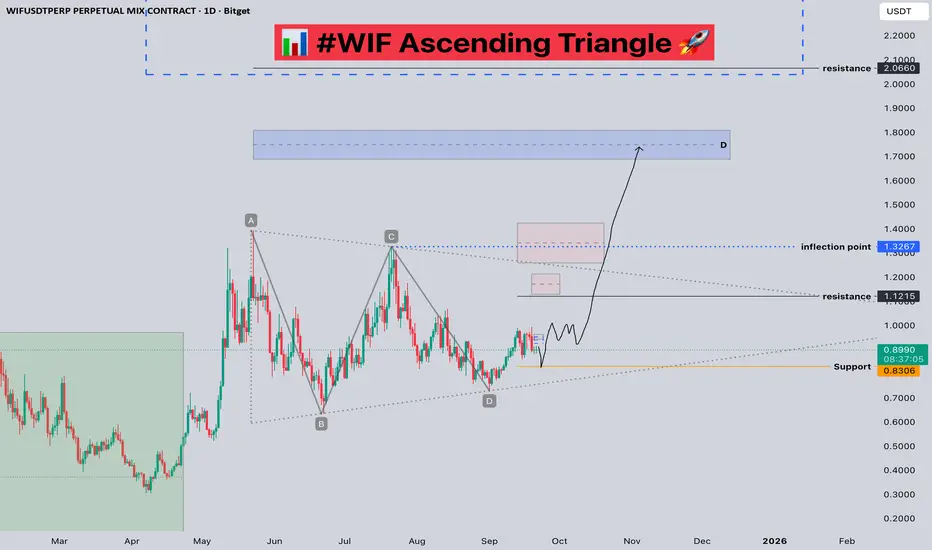
#WIF Ascending Triangle 📊 #WIF Ascending Triangle 🚀
🧠From a structural perspective, the daily correction has completed. A good rebound has already occurred, and the market is currently consolidating sideways. If it can break out of this consolidation range, we could potentially see the start of a second surge.
➡️From a chart perspective, the price has been squeezed to form an ascending triangle. A successful breakout above the upper edge of the triangle would signal the start of a new uptrend.
Let's see 👀
🤜If you like my analysis, please like 💖 and share 💬
BITGET:WIFUSDT.P
WIF Market Update📊 SEED_WANDERIN_JIMZIP900:WIF Market Update
SEED_WANDERIN_JIMZIP900:WIF is now testing an important resistance zone 🔴
👉 There’s a chance of rejection here, but if it breaks out, that’s a strong signal for a bullish trend ✅
⚡ Watch closely — confirmation will show the next move.

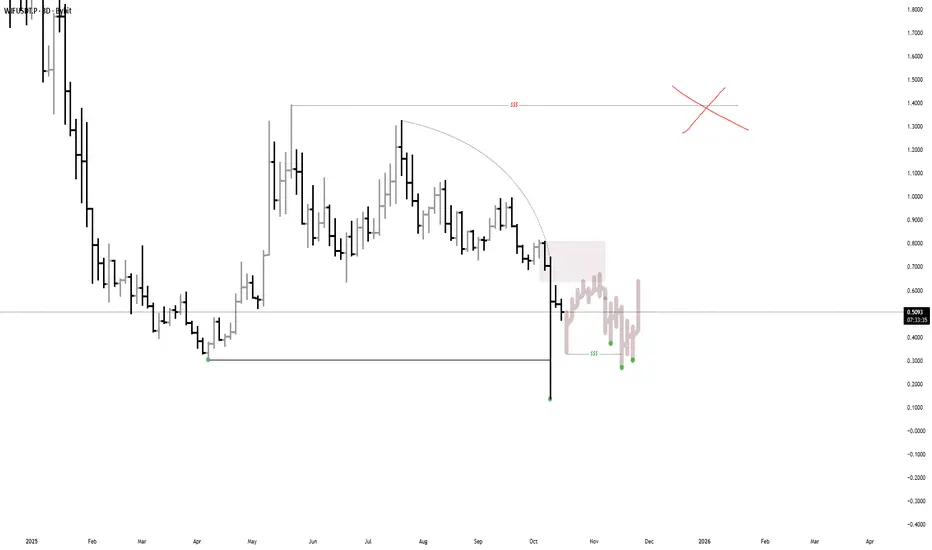
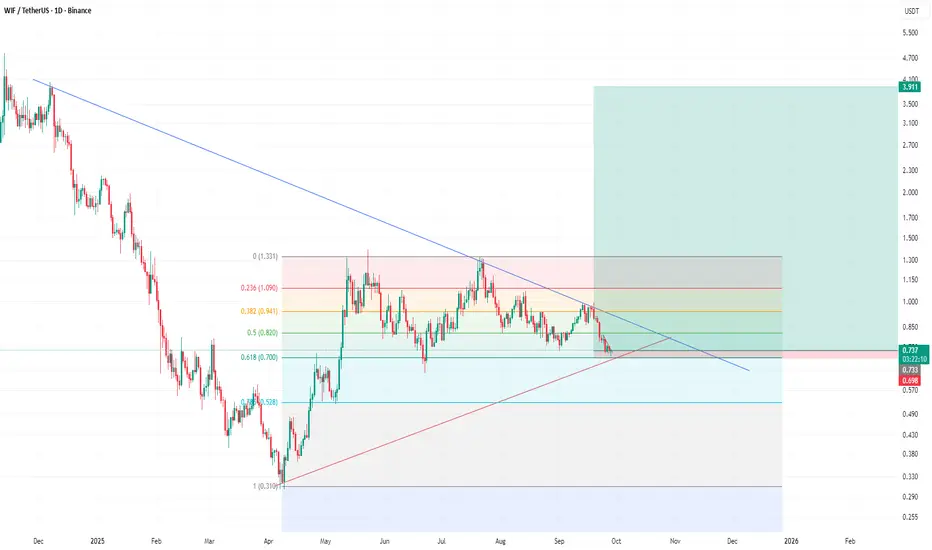
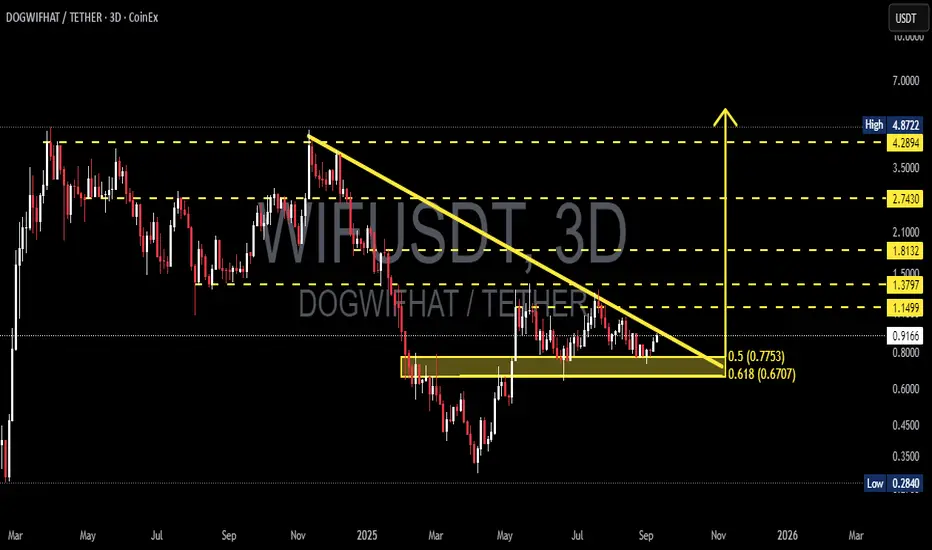
WIF/USDT — The Apex Point: Awaiting a Major Breakout or Breakdow🔎 Overview
The DOGWIFHAT/USDT pair is currently consolidating at a critical junction on the 3-day timeframe (3D). The chart reveals a classic Descending Triangle — a technical pattern formed by consistent lower highs (selling pressure) converging with a strong horizontal support zone.
The essence of this pattern: price is being squeezed into a tighter range (the apex). The longer the compression, the stronger the potential explosive move — either upward or downward.
---
🟢 Bullish Scenario (Breakout Potential)
Trigger: A valid breakout requires a 3D candle close above the descending trendline and ideally a reclaim of 1.1499.
Catalyst: Strong breakout volume plus successful retest of former resistance turned into support.
Upside Targets:
1. 1.1499 → Initial breakout confirmation.
2. 1.3797 → First major upside target (+50% from current price).
3. 1.8132 → Next psychological level (+98% from current price).
4. If momentum sustains, 2.7430 → 4.2894 → 4.8722 could act as medium-term magnets.
👉 Note: As long as price holds above the golden Fibonacci pocket (0.7753–0.6707), bulls maintain a strong chance of reclaiming momentum.
---
🔴 Bearish Scenario (Breakdown Risk)
Trigger: Breakdown confirmed if the 3D candle closes below 0.6707 (Fib 0.618).
Confirmation: Failed attempt to reclaim 0.77 after breakdown.
Downside Targets:
1. 0.45 → Psychological support / liquidity area.
2. 0.2840 → Historical low.
3. Measured Move: Based on the triangle’s height (approx. 0.4792), a textbook target would be ~0.19 — though this requires heavy bearish momentum.
👉 Note: Losing the golden Fibonacci pocket would hand over full control to bears.
---
📌 Pattern & Key Significance
1. Descending Triangle → Statistically leans bearish, but strong reversals are common if broader market sentiment is bullish.
2. Fibonacci Golden Pocket (0.5–0.618: 0.7753–0.6707) → Strong confluence zone; potential accumulation area for bulls.
3. Apex Point → The closer price gets to the apex, the stronger the eventual breakout/breakdown move.
---
🧭 Trading Strategies
Bullish Traders (Breakout Players):
Enter on a confirmed 3D close above 1.1499, preferably after a retest. Target 1.38 and 1.81 with stop loss below 0.95–0.85.
Bearish Traders (Breakdown Players):
Short after a 3D close below 0.6707, with confirmation from failed retest. Targets 0.45 and 0.2840. Stop loss above 0.78.
Swing Traders (Risk-Reward Optimizers):
Consider speculative longs at 0.77–0.67 with tight SL below 0.62, aiming for potential breakout to 1.15+.
---
📊 Key Levels
Critical Support Zone: 0.7753 – 0.6707 (Fibonacci confluence).
Major Resistances: 1.1499 → 1.3797 → 1.8132 → 2.7430 → 4.2894 → 4.8722.
Historical Low: 0.2840.
Pattern: Descending Triangle → approaching resolution.
---
🚀 Conclusion
DOGWIFHAT is at a major crossroads. This descending triangle could serve as a springboard into the next altcoin rally or a trapdoor toward new lows.
The golden Fibonacci pocket (0.77–0.67) is the key battleground. If it holds, bulls have a real shot at reclaiming higher levels. If it breaks, bears will likely dominate the structure.
---
#DOGWIFHAT #WIFI #Crypto #Altcoin #ChartAnalysis #TechnicalAnalysis #DescendingTriangle #SupportResistance #Fibonacci #Breakout #Breakdown
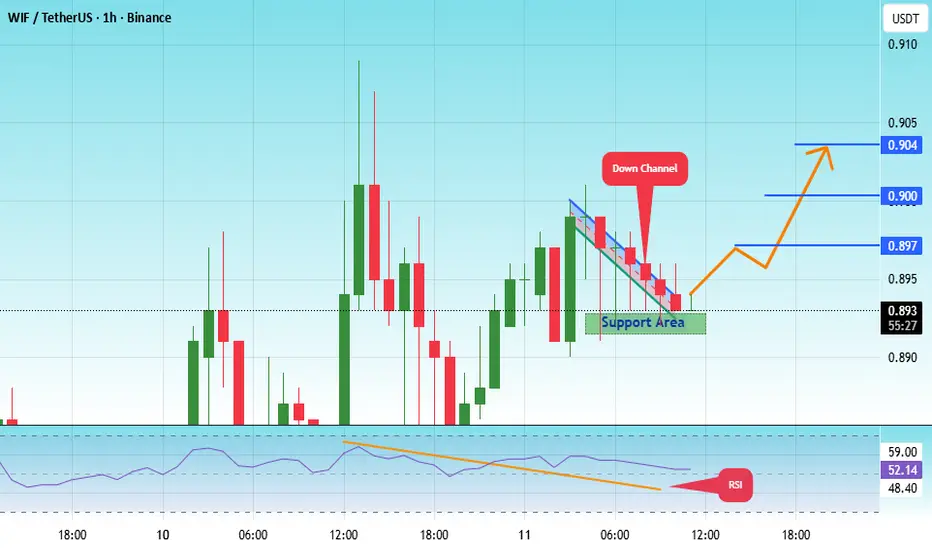
#WIF/USDT Forming Descending Channel#WIF
The price is moving within a descending channel on the 1-hour frame, adhering well to it, and is heading for a strong breakout and retest.
We have a bearish trend on the RSI indicator that is about to be broken and retested, which supports the upward breakout.
There is a major support area in green at 0.890, representing a strong support point.
For inquiries, please leave a comment.
We are in a consolidation trend above the 100 moving average.
Entry price: 0.893
First target: 0.897
Second target: 0.900
Third target: 0.905
Don't forget a simple matter: capital management.
When you reach the first target, save some money and then change your stop-loss order to an entry order.
For inquiries, please leave a comment.
Thank you.
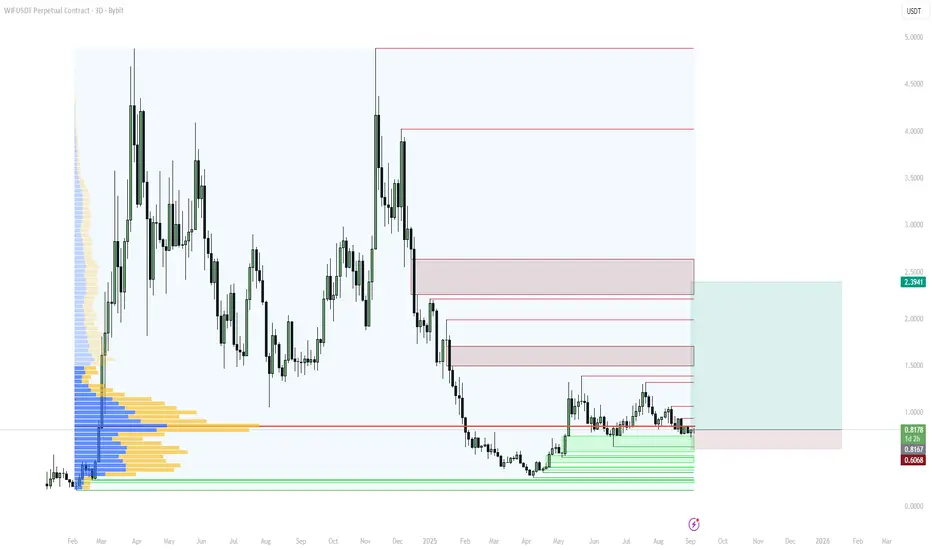
Long from accumulation range: targets 1.50 → 2.35 (Weekly FVG)Price is sitting at the upper edge of the 0.78–0.83 accumulation. Above, unfilled FVG clusters on D1/W1 act as magnets; the first target is 1.50, then 2.00–2.35 (Weekly FVG). VPVR shows the main volume base at 0.70–0.83.
Idea
Counter-trend long from range support with base R/R ≈ 3.7. Expectation: liquidity sweep to the upside and FVG fills.
Trade Plan (laddered limits)
Entries: 0.820 (40%), 0.780 (30%), 0.650 (30%)
Hard stop (invalidation): 0.611
TP1: 1.500 (take 50%)
TP2: 2.350 (leave 50%)
Risk / Reward
Max risk to stop: −23.63% from 0.800 → 0.611.
Upside: +87.5% to 1.50 and +193.8% to 2.35.
Base R/R ≈ 3.7.
Management
After 1.00–1.05, move stop to breakeven (avg entry). After TP1, trail under the latest H4/D1 HL and hold for the Weekly FVG 2.00–2.35.
Key Levels
Support: 0.83 / 0.78 / 0.72–0.70 / 0.65
Resistance: 1.00 / 1.20–1.35 / 1.50 / 1.95 / 2.35
Confirmation Triggers
H4/D1 close above 0.90–1.00 (fresh HH)
Impulsive move from 0.78–0.83 with volume and absorption of the last bearish block
Alternative (bearish)
Clean break and acceptance below 0.611 cancels the idea; wait for a new base/re-accumulation.
Risks
Meme coins are prone to sharp liquidity flushes; use strict position sizing and respect the stop.
WIF/USDT Technical UpdateBINANCE:WIFUSDT has successfully broken out of the falling wedge 📉➡️📈 and has already completed a clean retest of the breakout zone ✅.
Currently price action is forming a potential ABC corrective wave structure (Elliott Wave count), with:
🅰️ Wave (A) aiming toward the 0.84–0.85 resistance zone
🅱️ Wave (B) likely testing support around the breakout area (~0.80)
🅾️ Wave (C) targeting the major resistance zone at 0.93–0.94
Key confluences:
✨ Bullish market structure shift after wedge breakout
✨ Support-turned-resistance flip successfully tested
✨ Momentum favors the upside if BTC continues bullish momentum 🟢
📌 Watch out for BTC’s move — if BTC pumps, WIF has a high probability to continue rallying toward 0.93–0.94 🎯
⚠️ Invalid below 0.78 support zone
