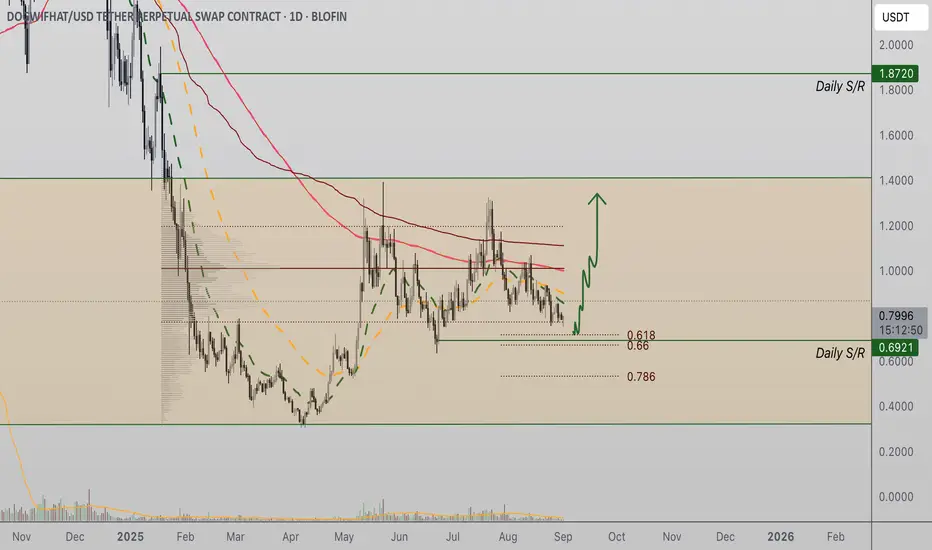
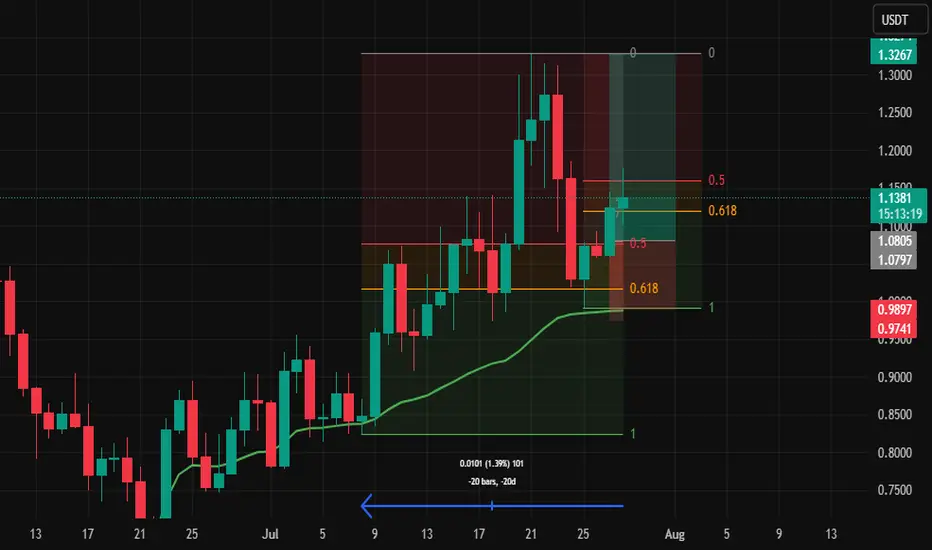
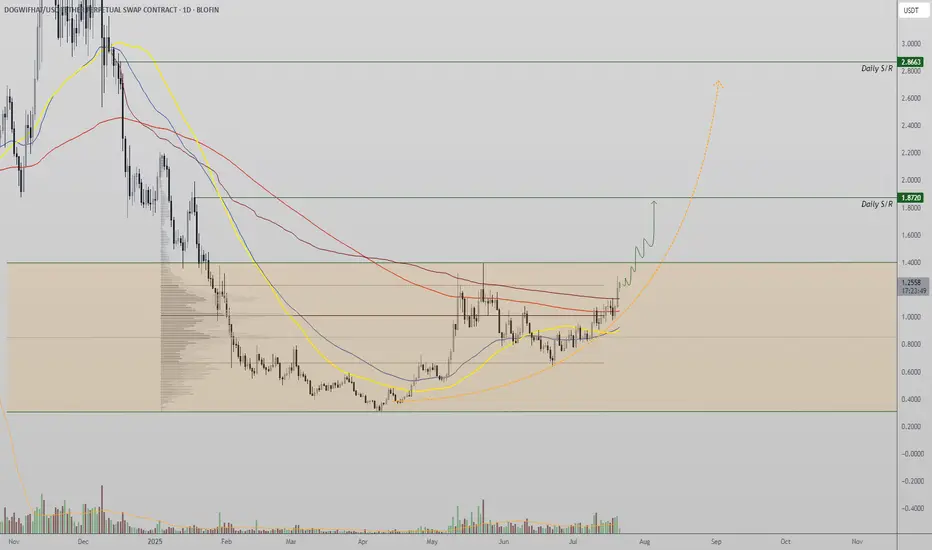
WIF Holds Fibonacci Support as Range ConsolidatesWIF Coin is respecting the 0.618 Fibonacci retracement, which aligns with daily support and the value area low of its current range. Price action remains rotational, but a move toward range resistance is developing.
WIF Coin continues to trade within a longer-term defined range, where both support and resistance have held firm. At present, price is finding support at the 0.618 Fibonacci retracement, a key technical level in confluence with daily support and the value area low. This alignment strengthens the case for a potential rotation higher within the range, although a broader breakout has yet to occur.
Key Technical Points
- 0.618 Fibonacci Confluence: Price is currently holding above the retracement aligned with daily support and value area low.
- Rotational Range Structure: WIF Coin remains locked in a sideways trading range, awaiting breakout confirmation.
- Resistance in Focus: The next major test lies at range resistance, which price is now approaching.
The current price behavior of WIF Coin illustrates the mechanics of range-bound markets. Strong confluence between the 0.618 Fibonacci retracement, the daily support level, and the value area low has created a reliable structural base. As long as this level holds, the likelihood of continuation higher within the range remains strong.
Despite this supportive base, WIF Coin has yet to escape its longer-term trading range. Resistance overhead continues to cap upside momentum, while support has repeatedly caught downside attempts. This equilibrium creates a rotational environment where traders can anticipate cycles from the lower boundary back toward the highs.
Currently, price is leaning toward the resistance zone at the top of the range. A move toward this level would fit the rotational structure, but the key factor will be volume confirmation. Without increasing volume, any rally risks stalling before testing resistance. Conversely, a surge in bullish volume would strengthen the case for a decisive breakout attempt.
The critical catalyst lies in the eventual range resolution. A breakout above the defined resistance would open the door to significant upside expansion, while a breakdown below support would tilt the market firmly bearish. Until such a resolution occurs, price action remains rotational within the defined boundaries.
What to Expect in the Coming Price Action
If WIF Coin continues to respect the 0.618 Fibonacci support, a rotation toward range resistance remains the most probable scenario. However, only a decisive breakout will unlock explosive directional momentum. For now, the market remains balanced, with traders awaiting volume confirmation to determine the next trend-defining move.
Trade ideas
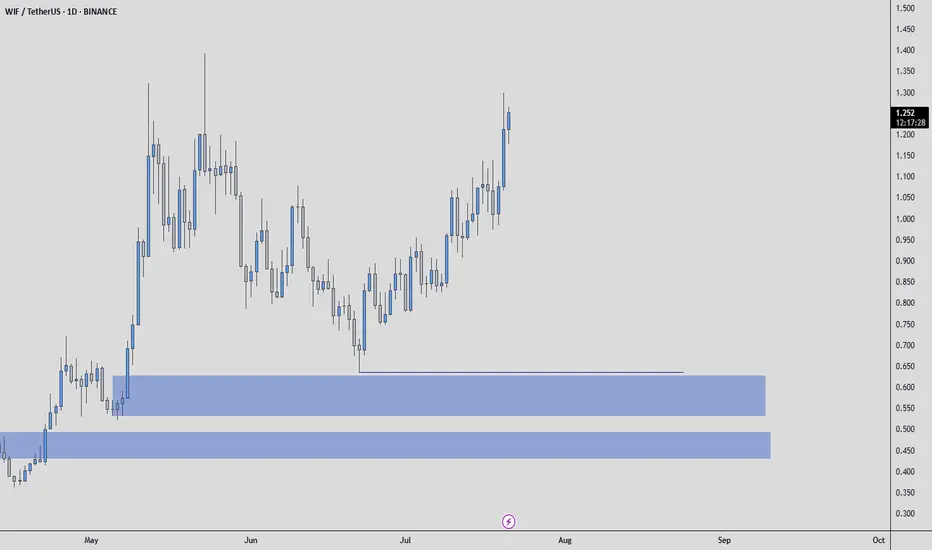
WIFUSDT — Critical Demand Zone: Bounce or Breakdown?Currently, WIFUSDT is trading around 0.7605 and retesting the major demand zone (~0.62 – 0.78) — a level that previously acted as strong resistance before flipping into support.
The price action here will determine the medium-term direction:
Either a bullish reversal fueled by accumulation,
Or a bearish continuation if this zone fails.
---
🔎 Market Structure & Pattern
1. Macro Trend:
From late 2024 to early 2025, WIF faced a strong downtrend.
A sharp rebound in March–May 2025 pushed the market into a consolidation range.
Since then, the chart has been forming lower highs, showing persistent selling pressure.
2. Critical Flip Zone (0.62 – 0.78):
Previously acted as heavy resistance.
Flipped into support after a breakout in May.
Now being retested as a decisive level.
3. Potential Reversal Formation:
Holding this zone may form a double bottom / base pattern → bullish setup.
Losing this zone could trigger a continuation breakdown toward new lows.
---
🟢 Bullish Scenario
Confirmation: Daily close above 0.75–0.78 with a strong bullish candle.
Upside targets:
1.0251 → nearest resistance.
1.2008 → major consolidation area.
1.8468 – 2.1772 → mid-term resistance levels.
Ideal setup: Retest & bounce with rising volume, forming a higher low.
---
🔴 Bearish Scenario
Confirmation: Daily close below 0.62 with strong follow-through.
Downside targets:
0.50 → psychological level & minor demand.
0.3040 → major low from the chart.
Ideal setup: Breakdown → retest of yellow zone as resistance → rejection → continuation downtrend.
---
⚖️ Key Notes
The yellow zone (0.62 – 0.78) is the decision zone for WIF.
Breakout or breakdown here will likely trigger strong momentum.
Aggressive traders: may enter inside the zone with a tight SL below 0.62.
Conservative traders: wait for a daily close confirmation with volume.
Always use risk management — WIF is highly volatile.
---
✍️ Conclusion
WIFUSDT is at a strategic turning point:
Holding above support could trigger a bullish reversal toward 1.02 → 1.20.
Losing this zone could open the door to deeper downside toward 0.40 – 0.30.
The next daily close will be crucial for validating direction.
#wifusdt #dogwifhat #cryptoanalysis #altcoins #supportresistance #demandzone #bullishscenario #bearishscenario #cryptotraders #priceaction #technicalanalysis

Setting up a Tradingview screener to fit your systemSetting up a Tradingview screener to fit your system. Very simple and if you have ideas to make it simpler let me know.

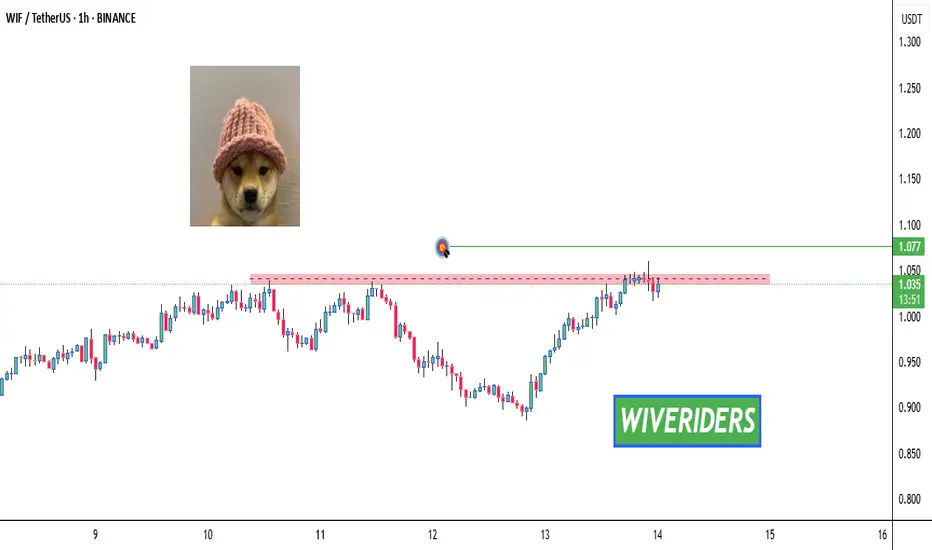
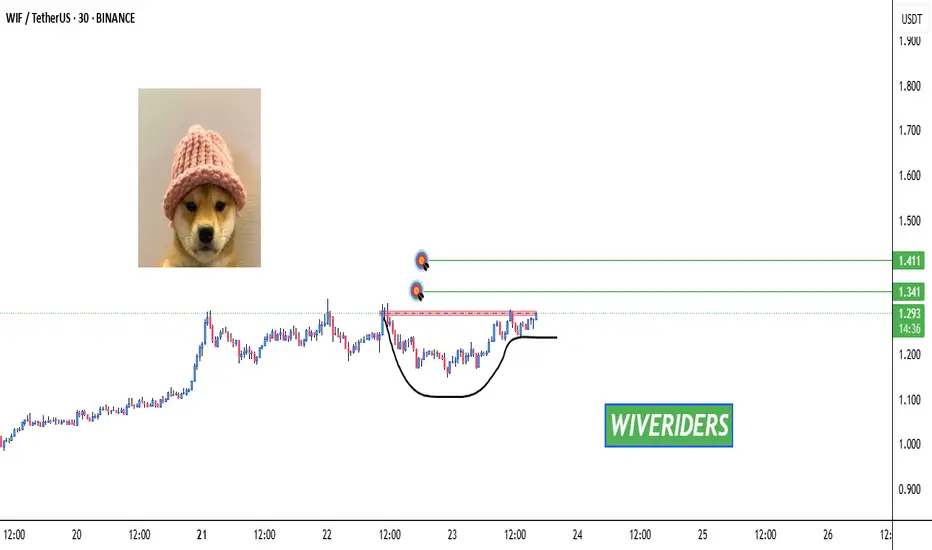
WIF Breakout Watch – Testing Key Resistance! 🚨 WIF Breakout Watch – Testing Key Resistance! 🔴⏳
WIF is testing the red resistance zone right now.
📊 If a breakout confirms, the next move could target:
🎯 First Target → Green line level
A confirmed breakout here could trigger strong bullish continuation.
WIF/USDT – 15M | FVG & Breaker Block in Play Price is hovering near the P1D Low / OB zone. Two possible scenarios to watch:
📈 Bullish – Hold above P1D Low (~0.8980) → Break into FVG (~0.9250) → Push toward Breaker Block (~0.9700) for further confirmation.
📉 Bearish – Fail to hold P1D Low → Break below OB (~0.8800) → Continue toward deeper downside liquidity.
Key Levels:
Breaker Block: ~0.9700
FVG: ~0.9250
P1D Low: ~0.8980
OB Support: ~0.8800
⚠️ Monitor price action at the P1D Low for directional confirmation.

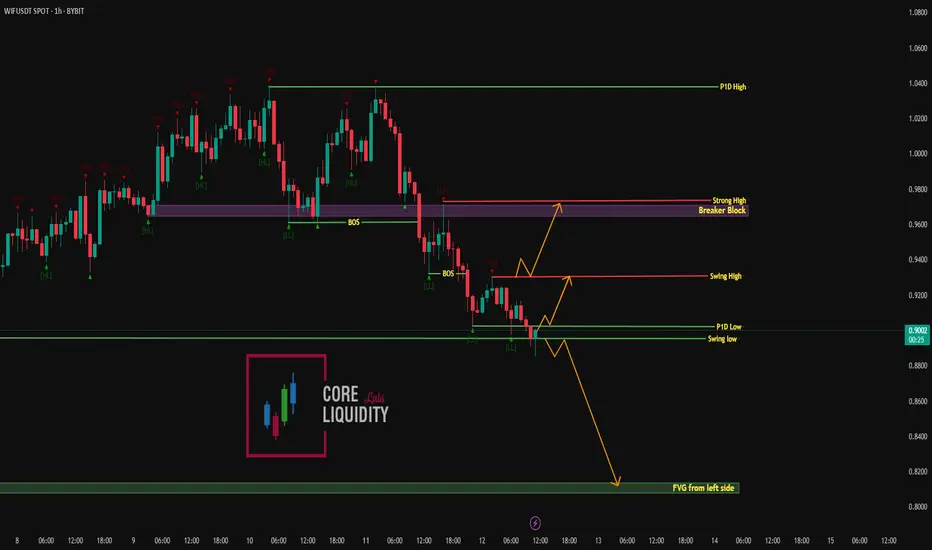
WIF/USDT – 1H | Key Levels & Breaker Block in FocusPrice is holding near the P1D Low / Swing Low zone. We’re watching two scenarios:
📈 Bullish – Hold above P1D Low → Break Swing High (~0.9400) → Push toward Breaker Block (~0.9750) and potentially higher.
📉 Bearish – Fail to hold P1D Low → Break lower → Continuation toward FVG (~0.8100) for potential reaction.
Key Levels:
Breaker Block / Strong High: ~0.9750
Swing High: ~0.9400
P1D Low / Swing Low: ~0.8980
FVG from left side: ~0.8100
⚠️ Reaction at P1D Low will be critical in determining the next move.
CryptoWolfy - Buy NOW, The Pre-Moon Buy Zone🚀 WIF at $0.92 — The Pre-Moon Buy Zone
Massive Bullish Setup: Inverse Head & Shoulders + Bullish Engulfing on weekly — textbook breakout pattern.
Volume Surge + CMF Positive: Smart money is flowing in. Momentum is building.
Resistance at $1.20 is weak — once cracked, $4 is the next magnet.
Social Hype Reigniting: Meme coin cycles are fast and furious — WIF is next in line.
💥 WIF at $0.92 is not a dip — it’s a launchpad.
$4 isn’t a dream. It’s a destination.


day 3 supported my MAs looking to hold till it hit tp or until the close of day 3. break even at 1:2 r:r

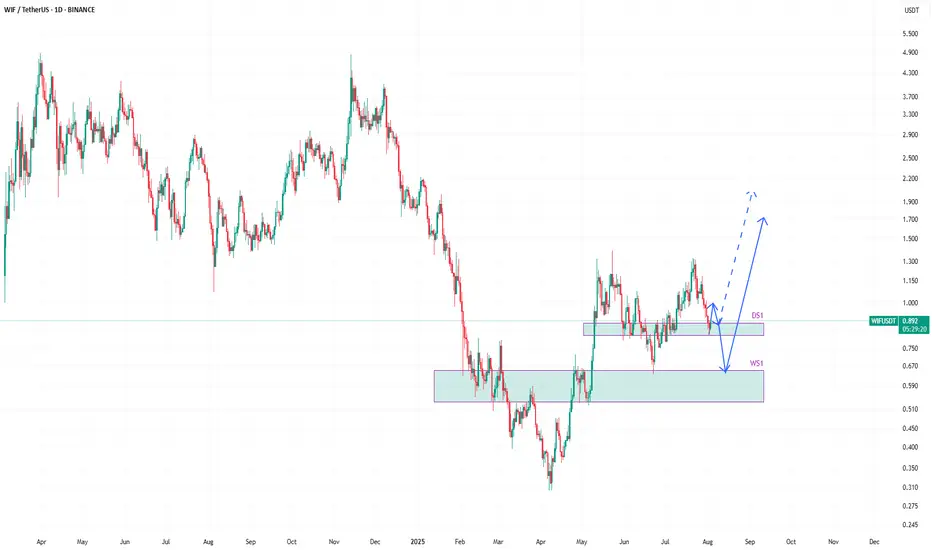
WIFUSDT to bounce from weekly support around 0.60#WIF #WIFUSD #WIFUSDT SEED_WANDERIN_JIMZIP900:WIF
On WIFUSDT, I see two possibilities for the upcoming price action.
The price has tapped into daily support DS1 and it is currently bouncing from there.
The first path suggests that this is the start of the reversal and upward journey continuation. But I am not very inclined to that possibility.
The second path suggests that the price will go down further to weekly support zone WS1 after the current bounce from DS1 is exhausted.
I am more inclined on the second path. This will allow a bounce with enough strength to make the price move beyond the current highs. And that bounce from weekly support WS1 will be a real breakout and allowing the price to move beyond 1.5 and so on.
Dogwifhat Poised For 22% Growth Toward $1.50Hello✌
Let’s analyze Dogwifhat’s upcoming price potential 📈.
📈 BINANCE:WIFUSDT is currently sitting near a strong daily support and trendline. At the same time, the Fibonacci Level support lines up closely with this key level. This convergence suggests a potential upside of about 22%, aiming for a target price of $1.50. 🔥
✨We put love into every post!
Your support inspires us 💛 Drop a comment we’d love to hear from you! Thanks , Mad Whale

Memecoin with potential for purchase.Hello friends🙌
Considering the decline we had in the weekly timeframe, you can now see that with the good growth we had, it gives us a good signal to buy, of course in a stepwise manner and with capital and risk management.
🔥Follow us for more signals🔥
*Trade safely with us*

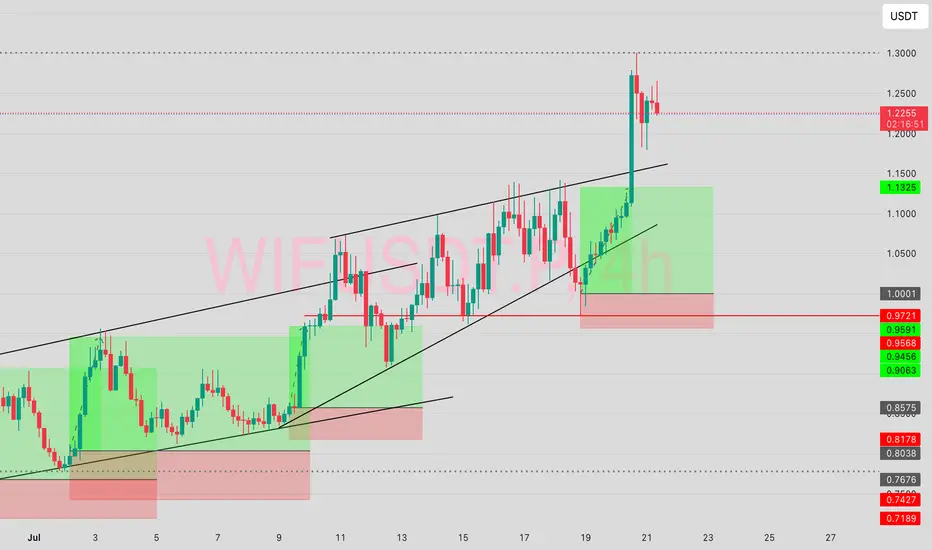
Wif 10-20% up this week?I am looking to grow my spot with a 10-20% move on wif this week if it takes the external liquidity.
I took a position on yesterday when it traded at the equilibrium of the 2 day range
Surprisingly, WIF looks good!I wanted to write a scathing review about what a terrible meme coin it is and how it should slide to zero.
➡️ But after looking at the chart in detail, I was surprised to see that technically, the token looks incredibly good! Let me explain why:
🔹 $1-1.08 are key levels for the token, with a large number of support levels that are actively holding the price so far. Since the token has undergone a powerful correction, it is not now falling down with every sneeze of Bitcoin.
🔹 Volume - purchase volumes are indeed diverging from the price, which means that buyers are not interested at current prices. However, this is currently observed across the entire market due to a decline in activity in the summer and after a powerful rebound.
🔹 Money Flow - the liquidity inflow indicator shows surprising harmony with the price! Moreover, WIF is one of the only tokens that has been actively receiving new liquidity since February 2025! This means that whales have long noticed this underprice and started to take positions. Even now, when the market is in a range, the indicator is in the positive zone.
🔹 Dynamic Support/Resistance - the token continues to be in a bullish structure (higher highs, higher lows) and has been rejected twice from key resistance at $1.359. This is currently the biggest resistance for the price, and once it is overcome, the movement will become much easier, especially given the huge number of short stops above, because everyone loves to short meme coins so much that their funding becomes negative within minutes of any correction.
But, as you can see from the chart, a huge and uniform layer of interest has formed from $0.85 down to $0.31. This shows that there are a lot of people willing to buy the token at low prices.
📌 Conclusion:
I am one of the main haters of WIF. It always looked like crap, I shorted it a lot at any hint of a correction and made good profits.
But now the token looks really good and is in the process of forming its low. So, if the structure remains the same, I will definitely consider buying it on the spot.

mega alt-season?Are they making you hope for a mega alt-season? Protect yourself by learning. The amount I specified in the chart is enough for Altseason
Don't be too optimistic about the market

Bullish Cup & Handle Pattern Formed 🚨 SEED_WANDERIN_JIMZIP900:WIF Testing Red Resistance – Bullish Cup & Handle Pattern Formed 📈
SEED_WANDERIN_JIMZIP900:WIF is currently testing the red resistance zone and has formed a bullish cup and handle pattern on the chart.
If a breakout occurs, potential upside toward:
✅ First Target: Green line level
✅ Second Target: Green line level
Wait for breakout confirmation before entering long. 📊
Patience is key—watch this closely! 💼💸
WIFUSDT: Mid-Term AnalysisI know the prices I want are very cheap.
But I believe this market can give me those prices if I’m patient.
Until then, I’m watching calmly. If price comes to my levels, I will look for:
✅ Footprint absorption
✅ CDV support
✅ Structure reclaim for confirmation
If it aligns, I’ll take the trade with clear risk. If not, I’ll keep waiting.
No rush. The right price, or no trade.
$WIF with CATBYBIT:WIFUSDT.P is probably the pair that has made me the most profit in recent weeks.
I have meticulously followed it to do all its dance since 2-3weeks and its been all amazing.
Here's yet another one with that sort of profit. 1:3RR isn’t that bad, is it?
It’s a WIN!!!!
WIFUSDT Cup And Handle PatternWIF is showing a classic Cup and Handle pattern on the daily chart, a strong bullish reversal setup.
The price has broken above the neckline resistance around the $1.25–$1.30 area with bullish momentum. This breakout, if sustained with volume confirmation, could open the doors for a major upside move.
Cheers
Hexa
BINANCE:WIFUSDT
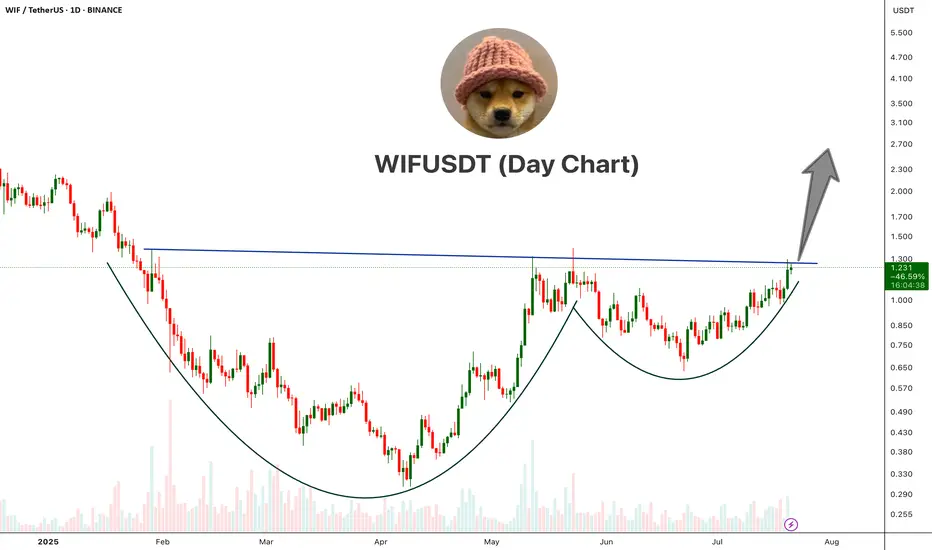
WIF Eyes Bullish Expansion as Range High NearsWIF (W-I-F) is gearing up for a potential parabolic move as it presses against key range high resistance. A confirmed breakout from this level, supported by rising volume, could trigger a bullish expansion first toward the $1.60 mark, with a secondary target of $2.60 in play.
Technically, the asset has reclaimed its 200-day moving average — a strong bullish signal that often precedes trend continuation. However, the current volume profile remains below average. For this breakout to be considered valid and sustainable, it must be accompanied by a noticeable surge in volume.
As long as price breaks above the range high with strong volume support, WIF remains poised for significant upside in the coming weeks and months. The overall structure suggests bullish continuation — but volume confirmation will be the key trigger to watch.
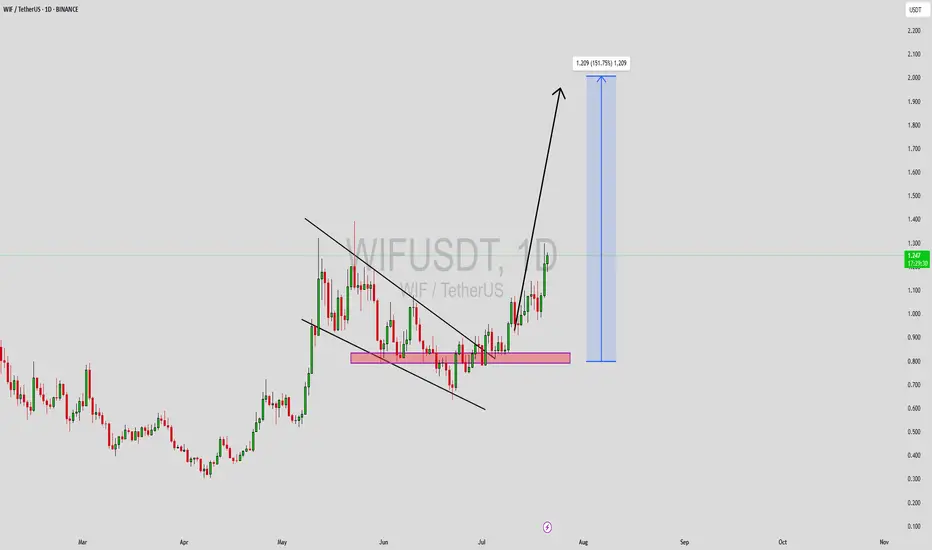
WIFUSDT Forming Descending ChannelWIFUSDT is currently trading within a descending channel pattern, a structure often considered bullish when found in a broader uptrend. This pattern indicates a period of healthy correction and consolidation, which often precedes a breakout move to the upside. With good trading volume and growing interest from the crypto community, WIF may be preparing for a strong reversal. The technical setup suggests a potential gain of 140% to 150%+ upon a confirmed breakout above the upper boundary of the channel.
Dogwifhat (WIF) has garnered significant attention due to its strong meme coin narrative within the Solana ecosystem. As meme tokens continue to attract retail attention, WIF has remained one of the more resilient and talked-about assets in its category. This strong community support, combined with current technical indicators, adds confidence to the bullish case.
The descending channel has allowed price to compress and reset RSI levels, setting the stage for a possible explosive move. If price breaks out with volume, this could mark the beginning of a new bullish wave. Traders should watch for a breakout candle with strong follow-through above recent resistance zones as a key confirmation point.
✅ Show your support by hitting the like button and
✅ Leaving a comment below! (What is You opinion about this Coin)
Your feedback and engagement keep me inspired to share more insightful market analysis with you!
WIFUSDT strong Bullish formationWIFUSDT is currently developing a classic Cup and Handle pattern, with the handle approaching the key neckline resistance zone. The neckline is acting as a strong barrier, and a confirmed breakout above this level is expected to trigger significant bullish momentum.
Target levels are clearly outlined on the chart. Keep a close watch on this setup, it has the potential to accelerate quickly once the breakout is validated.

WIF/USDT.p Short term potentialWIF is positioned to explode! It is currently testing the neckline of a perfect cup & handle.
