30-minute USOIL Key Buy Zones AnalysisHello Guys,
I’ve prepared a USOIL analysis for you.
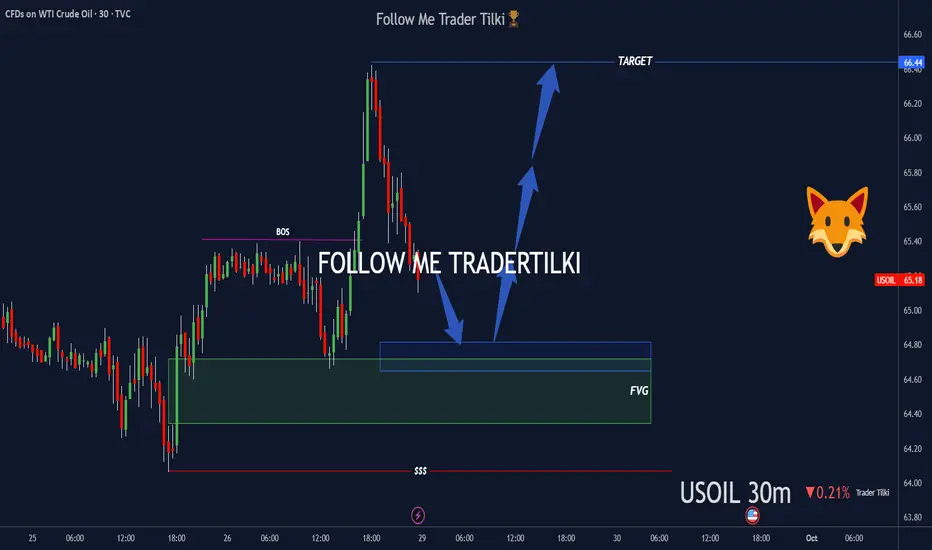
I’m watching two buy zones on USOIL:
🔹 First buy zone: 64.70
🔹 Second buy zone: 64.35 or 64,00
From these levels, I’ll definitely open buy positions and take my shot.
🎯 Target level: 66.40
Every like is my biggest motivation to k
About CFDs on WTI Crude Oil
Crude Oil is a naturally occurring liquid fossil fuel resulting from plants and animals buried underground and exposed to extreme heat and pressure. Crude oil is one of the most demanded commodities and prices have significantly increased in recent times. Two major benchmarks for pricing crude oil are the United States' WTI (West Texas Intermediate) and United Kingdom's Brent. The differences between WTI and Brent include not only price but oil type as well, with WTI producing crude oil with a different density and sulfur content. The demand for crude oil is dependent on global economic conditions as well as market speculation. Crude oil prices are commonly measured in USD. Although there have been discussions of replacing the USD with another trade currency for crude oil, no definitive actions have been taken.
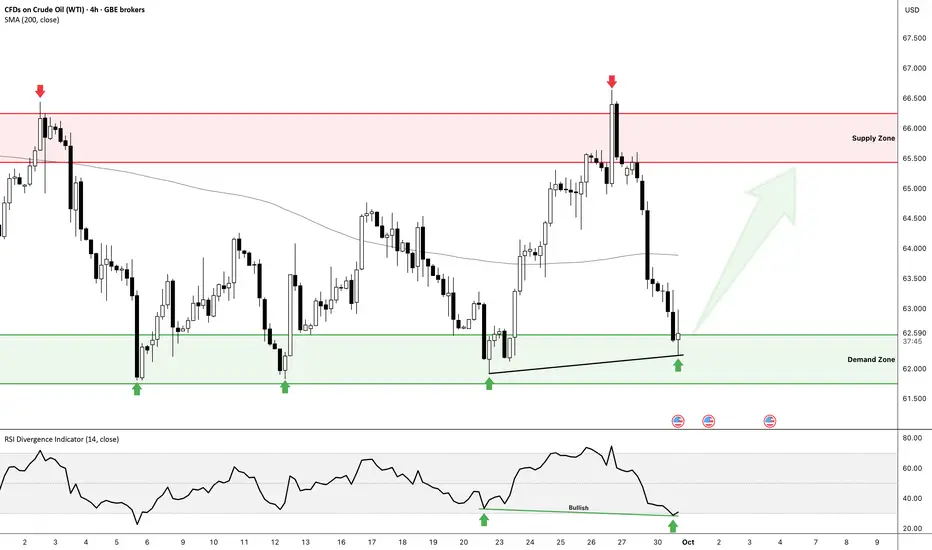
OIL Set for another bounce - 65 Target in Play📊 NFX GBEBROKERS:USOIL Chart Update
Fresh setup spotted:
Price tapped into demand zone and bounced cleanly.
Bullish RSI divergence confirmed → momentum shift to the upside.
Eyeing the supply zone above as the next key test.
🎯 Bias:
As long as demand holds, I’m favoring longs into supp
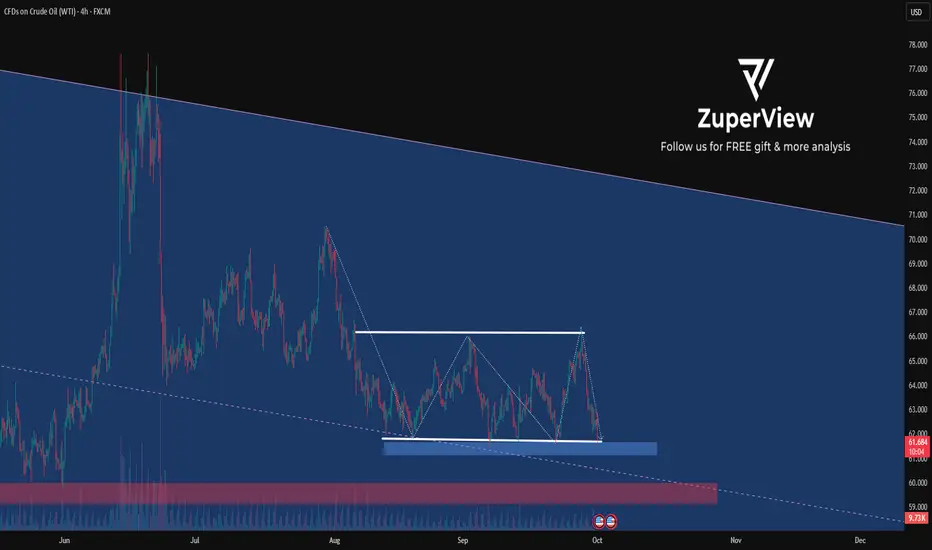
XTIUSD Pull back trade LONGRecently XTIUSD has fallen heavily and now price is consoldiating and pullback is possible to 63.5 before furhter decline, let us see how it plays out. Use strict SL as recnt swing Low.

WTI Crude Oil Short Setup: Retest of Flipped ResistanceHello TradingView Community,
This post outlines a potential short trade setup for WTI Light Crude Oil (XTIUSD) on the 15-minute timeframe.
Technical Analysis:
The chart highlights a key horizontal price level at approximately $63.50. This level previously acted as a solid support base, holding the p

WTI Crude Oil
As shown in my previous analysis (pinned below this post), we shorted oil from the range high.
Now price has reached the range low, where two key buy levels are marked on the chart ✅.
🔹 If these levels break, the opposite scenario still stands.
🔹 We’re not in OPEC, we don’t make political or war d

WTI Bearish Idea
As mentioned last evening , The fib will show small signs of pullback but since a regular candle has closed below fib support level 62.90 (38.20%) is strongly pulling price to 61.84 (14.60%) support which will play a major support. If this gets broken and the 4h candle closes below 61.84 level i

WTI OIL Channel Up bottom buy signalWTI Crude Oil (USOIL) has almost touched the bottom (Higher Lows trend-line) of its September Channel Up, following a strong rejection (Bearish Led) just below the 1D MA200 (orange trend-line).
With the 4H RSI entering its medium-term Buy Zone, we have a strong short-term buy signal at our hands. O


USOIL: Waiting for a reaction at strong supportTo better understand my current outlook on USOIL, please refer to my previous higher-timeframe and fundamental analyses.
* Trend: assessed using at least three trend indicators, with market structure as the primary guide.
** Weak or Reversal Signals: Assessed based on one of our criteria fo
Hellena | Oil (4H): SHORT to support area of 60 (Wave 3).The price is still not reaching the target of 60. I decided to make a new forecast, slightly changing the labeling of waves, or rather their importance.
At this stage, as before, I think that the price will reach the area of the level 60 in the middle wave “3”.
This movement is the development of th

See all ideas
Displays a symbol's price movements over previous years to identify recurring trends.