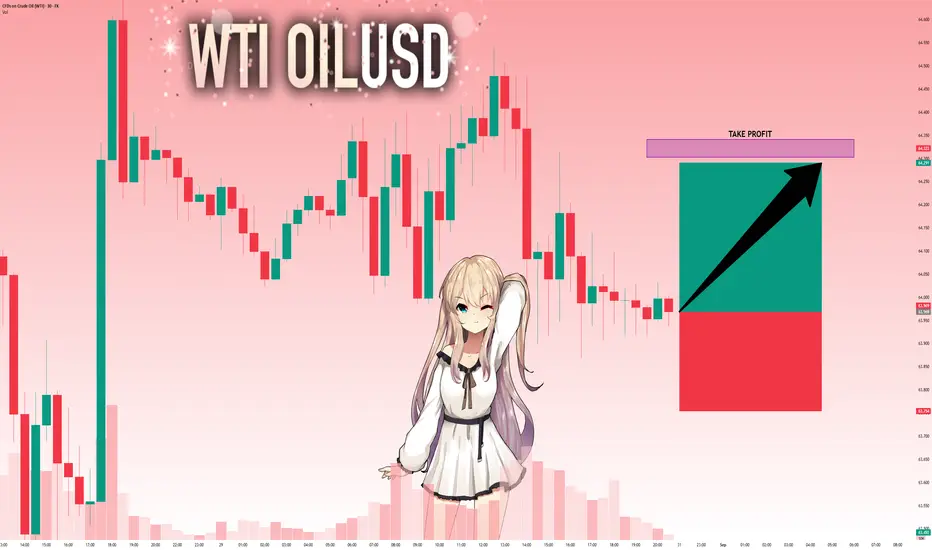
USOIL: Target Is Up! Long!
My dear friends,
Today we will analyse USOIL together☺️
The in-trend continuation seems likely as the current long-term trend appears to be strong, and price is holding above a key level of 63.969 So a bullish continuation seems plausible, targeting the next high. We should enter on confirmation, and place a stop-loss beyond the recent swing level.
❤️Sending you lots of Love and Hugs❤️
USOIL trade ideas
WTI Crude Oil – Range Support in FocusWe're waiting for price to reach the bottom of the range, and with a solid buy signal, we’ll consider going long.
However, since this level has been tested multiple times, it’s highly vulnerable to stop fishing — so caution is key.
As always, we’re ready for all scenarios:
If price breaks below, we’ll wait for a pullback to enter short.
But right now, we’re watching the range support for potential longs

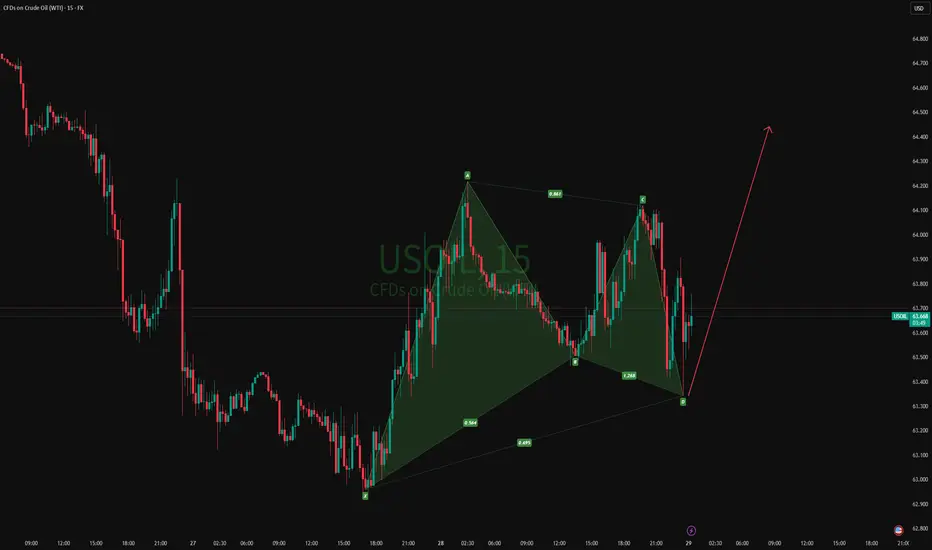
29-08-2025 USOILThe market is not always chaotic and disorderly, and there is a precise geometric beauty hidden in price fluctuations. The harmonic form long strategy is a powerful tool for accurately identifying potential market reversal points based on the Fibonacci ratio. When the form forms perfectly at the key support level, it often indicates the depletion of bearish momentum and the initiation of bullish trends.
As shown in the figure: 15M Bullish Gartley
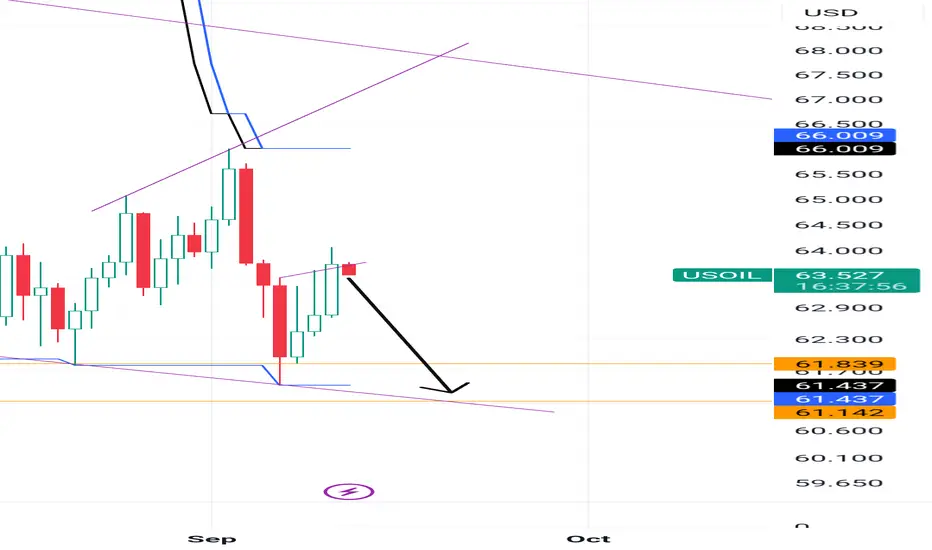
USOIL SENDS CLEAR BEARISH SIGNALS|SHORT
USOIL SIGNAL
Trade Direction: short
Entry Level: 64.06
Target Level: 61.35
Stop Loss: 65.86
RISK PROFILE
Risk level: medium
Suggested risk: 1%
Timeframe: 12h
Disclosure: I am part of Trade Nation's Influencer program and receive a monthly fee for using their TradingView charts in my analysis.
✅LIKE AND COMMENT MY IDEAS✅

Oil Market Faces Balancing Act as Supply Risks Meet Glut FearsOil Market Faces Balancing Act as Supply Risks Meet Glut Fears
Russian supply risks are clashing with growing concerns of a global supply glut as summer winds down. Crude benchmarks gained over 1% in the previous session after the EIA reported a larger-than-expected draw in U.S. crude inventories, though the pace of declines slowed from the prior week.
Analysts warn that OPEC+ unwinding production cuts, combined with rising output from non-member producers, could tip the market into surplus, according to MUFG’s Soojin Kim.
While Brent continues to trade at a near-term premium, signaling tight supplies, that premium has narrowed — a sign of softening demand expectations ahead.

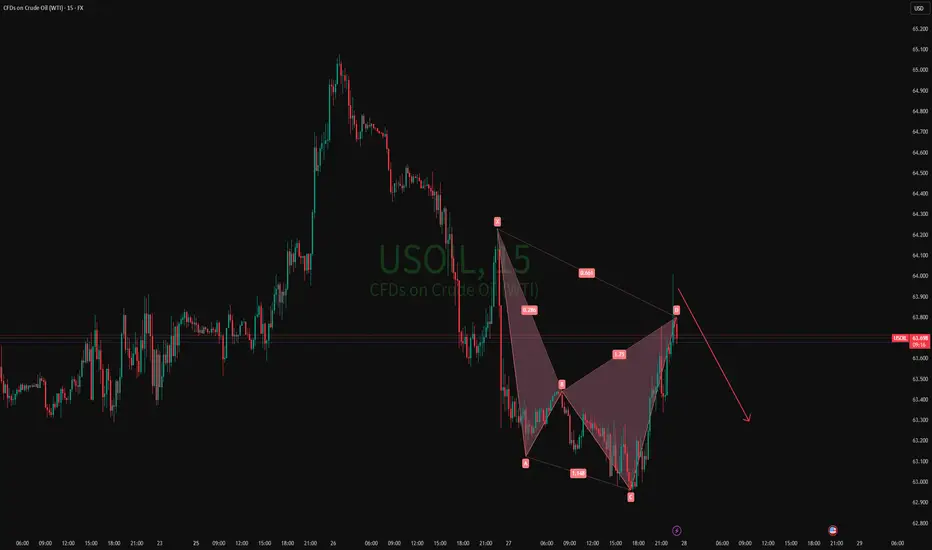
27-08-2025 USOILThe market is not always chaotic and disorderly, and there is a precise geometric beauty hidden in price fluctuations. The harmonic form long strategy is a powerful tool for accurately identifying potential market reversal points based on the Fibonacci ratio. When the form forms perfectly at the key support level, it often indicates the depletion of bearish momentum and the initiation of bullish trends.
As shown in the figure: 15M Bearish shark
Oil (WTI) – Short Term Turmoil Dominates Heading into SeptemberIt’s been a choppy week for Oil (WTI), with traders frequently adjusting their positions in response to various short-term factors. On Monday, optimism around a potential Federal Reserve rate cut, which could stimulate the global economy, drove oil prices higher and WTI rose from its opening level of 64.28 to a three-week high of 65.84.
Tuesday saw selling pressure dominate, as traders awaited news on whether the Trump Administration would enforce a proposed increase in tariff penalties on India, from 25% to 50%, for purchasing Russian energy. This uncertainty pushed prices down to a low of 63.66. However, once confirmation came that the tariffs would indeed be implemented, and an EIA report revealed a decline in inventories at the key U.S. storage hub in Cushing, Oklahoma (the first drop in two months), oil prices rebounded.
Looking ahead, oil prices may remain volatile in the short term as traders await clearer signals about the strength of the global economy, particularly from the U.S. and China. Key data releases over the next 10 days could provide that insight.
On Sunday, China will publish its official PMI manufacturing survey, offering a snapshot of industrial activity. Then, on Friday, September 5th, the U.S. Non-Farm Payrolls report will give a crucial update on the health of the American labour market.
Another key factor to watch will be developments from OPEC+, as markets await further updates on whether the group will move to restore between 1.3 and 1.6 million barrels per day of previously shuttered production. Their next meeting, scheduled for early September, could provide crucial direction for oil prices depending on the outcome.
Technical Update: Upside Held by 38% Retracement Resistance
Since posting the 62.24 August 13th session low, Oil (WTI) has enjoyed a period of price strength, with the market moving higher to 65.84 on August 25th.
However, as the chart above shows, this strength was capped by 65.70 which is equal to the 38.2% Fibonacci retracement resistance, a level that is often a focus for traders, when prices rally following an extended phase of weakness.
Oil (WTI) has seen prices pullback from this 65.70 area this week, suggesting it may be a level to watch in the coming sessions. However, what could be the potential support or resistance levels, if either, 65.70 continues to act as resistance and pushes prices lower, or if further price strength emerges and it gives way on a closing basis?
Potential Support Levels, If 65.70 Continues to Hold Price Strength:
After facing selling pressure at the 65.70 retracement level, Oil (WTI) has shown signs of weakness. Attention may now turn to 62.24, the low from August 13th. As buyers were found here before, they may be again, reinforcing 62.24 as next possible support.
However, as the chart shows, since the highs of June 23rd, Oil (WTI) has been forming a pattern of lower highs and lower lows, which may indicate negative sentiment. If prices close below the 62.24 support level, it could trigger further downside momentum, potentially towards 60.17, the low from May 30th.
Potential Resistance Levels, If 65.70 is Broken on a Closing Basis:
While a close above the 65.70 resistance wouldn’t guarantee continued strength, it could open the door to a more sustained phase of upside momentum.
Such moves could then result in the extension of the current recovery to test 67.84, the higher 61.8% retracement, possible further, if this in turn gives way on a closing basis.
The material provided here has not been prepared accordance with legal requirements designed to promote the independence of investment research and as such is considered to be a marketing communication. Whilst it is not subject to any prohibition on dealing ahead of the dissemination of investment research, we will not seek to take any advantage before providing it to our clients.
Pepperstone doesn’t represent that the material provided here is accurate, current or complete, and therefore shouldn’t be relied upon as such. The information, whether from a third party or not, isn’t to be considered as a recommendation; or an offer to buy or sell; or the solicitation of an offer to buy or sell any security, financial product or instrument; or to participate in any particular trading strategy. It does not take into account readers’ financial situation or investment objectives. We advise any readers of this content to seek their own advice. Without the approval of Pepperstone, reproduction or redistribution of this information isn’t permitted.


Oil at the crossroads - buy zone or bear trap?Technically , WTI is testing the lower boundary of a converging wedge, hovering around the identified buy zone. Holding above 62–63 is critical for bulls, as a breakdown would expose targets at 61.30 and 58.80. Conversely, a rebound from current levels could trigger a move toward 70.50 and even 77.60 if momentum builds. The daily stochastic hints at a potential reversal to the upside, suggesting that a short-term bounce may be in play.
Fundamentally , the outlook remains tense: weak demand from China and global economic uncertainty are weighing on prices, while OPEC+ continues to maintain control over supply. U.S. inventory swings, with alternating builds and exports, add to volatility. Overall, the setup looks neutral with elevated risk - macro data could easily tip the balance either way.
Tactically , the market is facing a binary scenario: sustained strength above 63 opens the way to 70.50 and 77.60, while failure here brings 58.80–55.60 into focus.
In short, oil is at a crossroads and the next decisive move depends on whether bulls can hold the line.

USOILIt has been seen that the price is continuously consolidating at the same range but below the resistance.
Does it mean that it is bearish?
The answer is yes the price is in the sellers's hand.
NATO opens fire for the first time! World War Just One Step AwayAmid the escalating conflict between Ukraine and Russia, Poland, a NATO member, took unprecedented military action on Wednesday (September 10th), shooting down a suspected Russian drone. This marked the first direct engagement of fire by the Western military alliance during the Ukrainian-Russian conflict, drawing significant international attention.
Polish Prime Minister Donald Tusk solemnly stated in parliament that the incident was "the closest we have come to open conflict since World War II," but stressed that there was no reason to believe the situation had slid to the brink of war.
The operation was supported by air support from NATO allies, including Polish F-16 fighter jets, Dutch F-35 fighter jets, Italian AWACS reconnaissance aircraft, and NATO aerial refueling tankers, which were scrambled from Tuesday evening to Wednesday morning local time to respond to threats entering Polish airspace.
Polish officials revealed that during Russia's large-scale attack on military facilities in western Ukraine, a total of 19 unidentified objects entered Polish airspace, of which those posing a direct threat were successfully shot down. This incident not only tested NATO's air defenses but also exposed the risk of conflict spillover.
Crash Site: Village Houses Destroyed, Residents Remain in Terror
The immediate consequences of the drone incursion were vividly demonstrated in the eastern Polish village of Wielikiwola. Around 6:30 a.m. local time on Wednesday, a drone crashed into a two-story brick house belonging to retiree Tomasz Wesolowski. He was sitting at home watching news coverage of the incident when he suddenly saw the roof completely destroyed, leaving the bedroom strewn with rubble and debris.
In an interview with reporters, Wesolowski described the house as completely uninhabitable and in need of complete demolition and reconstruction. He recalled the shock of that moment, as if the shadow of war had descended directly upon ordinary people.
Meanwhile, another crash site was discovered in a field in southeastern Poland, leaving a distinct blackened mark, indicating that more than one drone had concluded its flight path there. These details vividly illustrate the destructive power of the incursions and raise the specter of how conflict can spill from battlefields into civilian areas in neighboring countries, heightening tensions across the region.
Russian Denials and International Condemnation: Moscow Accuses Ukraine, Western Leaders Unanimously Denounce
Russia responded swiftly to Poland's accusations, firmly denying any responsibility.
A senior diplomat in Poland claimed that the drones actually originated from Ukraine and were not Russian. The Russian Ministry of Defense further clarified that while large-scale drone strikes against military targets in western Ukraine were indeed carried out, there was absolutely no plan to target any targets in Poland.
In an interview with RIA Novosti, Russian Charge d'Affaires in Poland, Andrey Ordash, stressed that the accusations of Russian aggression were "groundless" and criticized Poland for failing to provide any corroborating evidence.
Kremlin spokesman Dmitry Peskov, more generally, stated that the EU and NATO "accuse Russia of provocations every day," attempting to downplay the incident as standard Western propaganda.
In stark contrast to Russia's denials, Western leaders strongly condemned the incident.
U.S. President Trump quickly spoke with Polish President Nikolaj Nawrotsky following the incident. Polish President Nawrotsky posted on the X platform that the call was part of consultations with allies and reaffirmed their solidarity. Prior to this, Trump had posted on social media, "What's up with Russia violating Polish airspace with a drone? We're here!" While he didn't provide further details, his statement demonstrated the United States' unwavering support for its allies.
Leaders of NATO member states, including France, the United Kingdom, Germany, and Canada, also condemned the suspected Russian intrusion. European leaders are working to persuade Trump to strengthen sanctions against Russia and increase support for Ukraine, arguing that a collective response is warranted.
In addition, Slovenia, Denmark, Greece, France, and the United Kingdom have requested a UN Security Council meeting on Friday specifically to discuss Russia's violation of Polish airspace, further highlighting the international significance of the incident.
NATO Response and Strategic Analysis: Article 4 Activation, Suspected Air Defense System Test
NATO's response to the incident was swift and firm. The NATO US commander publicly stated that this response fully demonstrated the alliance's resolve to defend allied territory and emphasized that NATO will not tolerate any violations.
Polish Prime Minister Donald Tusk characterized the incident as a "large-scale provocation" and has invoked Article 4 of the NATO treaty, which allows member states to consult with other allies to coordinate their response strategies when faced with a threat.
While Poland and NATO have yet to fully disclose the drones' specific intentions, a senior military source revealed that the flight paths of at least five drones were directed toward Rzeszów Airport, a major hub for NATO arms delivery to Ukraine. The source believes Russia may have been deliberately testing NATO's air defense and early warning system capabilities to assess the Western alliance's response speed and strength. This strategic intent makes the incident more than just an isolated intrusion, but could also foreshadow the risk of a larger-scale confrontation.
Drone Model Revealed: Cheap Long-Range Weapons
Regarding the specific type of the invading drones, Polish military officials revealed that at least some were "Gerbera" models. This is a low-cost, long-range drone, assembled from kits provided by the Asian power at the Yelab factory in Russia, according to Ukrainian intelligence. This drone, despite its simple design and low cost, possesses a long range and considerable attack capability, making it a common tool on the modern battlefield. Although Russia denied using such drones to invade Poland, the revelation of this detail has further heightened international concerns and highlighted the complex role of global supply chains in military conflict.
Impact and Outlook: A Wake-Up Call on the Brink of War, a Test of NATO Unity
In short, Poland's downing of a suspected Russian drone was not only a milestone, marking the first NATO engagement during the Ukrainian-Russian War, but also exposed the potential dangers of conflict spillover. From the destruction of villages and houses to the condemnation of international leaders and the activation of NATO's Article 4, the entire process was a terrifying moment, reminding the world that the flames of war could spread at any moment. While Russia's denial attempted to defuse the crisis, the Western bloc's collective response demonstrated a high degree of unity. With the upcoming UN Security Council meeting, this incident may prompt tougher sanctions and aid measures, while also testing NATO's strategic resilience. Amidst increasing global geopolitical tensions, such provocative incidents undoubtedly serve as a wake-up call, urging all parties to resolve differences through diplomatic means and avoid a slide into larger-scale conflict.
As a traditional safe-haven asset, gold's price performance is typically highly sensitive and direct during sudden, high-intensity geopolitical crises like these. The subsequent trajectory of gold prices depends entirely on the subsequent responses of NATO and Russia.
If the situation escalates (for example, NATO issues stronger warnings, imposes stricter sanctions on Russia, or intensifies friction), safe-haven buying for gold will persist, and gold prices are expected to stabilize at high levels or even rise further. The market will begin pricing in the risks of a wider war and a disruption to global economic growth.
If the situation de-escalates (for example, both sides de-escalate through diplomatic channels or the incident is characterized as an "accident" or "mistake"), gold prices may give back much of the gains driven by risk aversion, experiencing a "high-rise-and-lower" trend. However, the subsequent low is likely to be higher than the pre-event level, as the market recognizes the fragility of the situation in Eastern Europe and the geopolitical risk premium persists.
For the crude oil market, the impact of this event is more complex, but overall, concerns about supply disruptions will dominate market sentiment and drive oil prices higher. US crude oil closed up approximately 1.5% on Wednesday, marking the third consecutive day of gains. Russia is one of the world's most important oil and natural gas producers and exporters. Any event that could directly or indirectly disrupt Russian energy supplies would trigger market panic. It's important to note that, to date, Russian crude oil exports via pipelines and the Black Sea have not been actually disrupted by this incident. Therefore, the current oil price increase is almost entirely based on a premium based on expectations and sentiment. Once expectations subside, oil prices will quickly fall. Conversely, any signs of supply disruptions could trigger a new round of price increases. FX:XAUUSD FX:USOIL PYTH:XAUUSD GBEBROKERS:USOIL

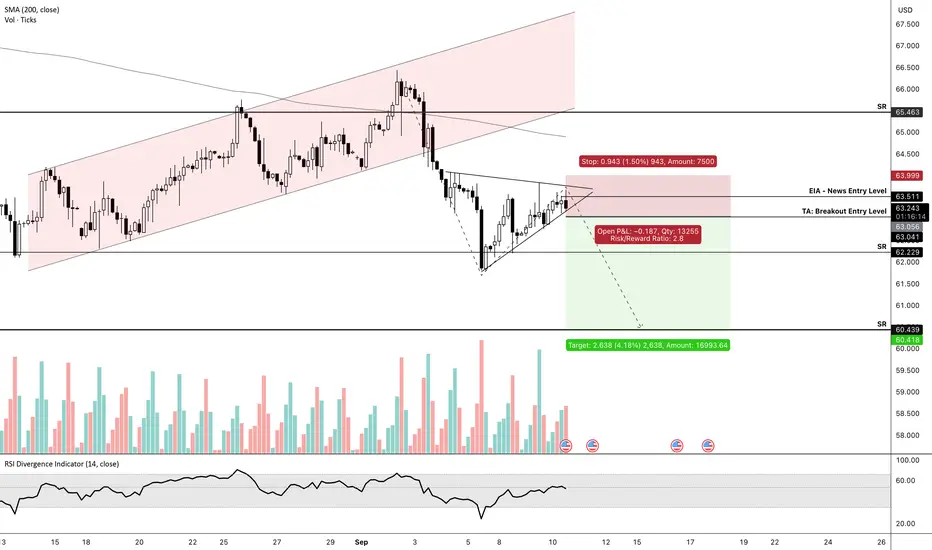
USOIL Trade Insights📢 NFX Trade Update – FX:USOIL USOIL (WTI-USD)
Strong rejection at the 23.6% Fibonacci resistance, with price dropping exactly as expected, confirming the liquidity grab setup. A textbook SMC play.
We anticipate further downside on Oil. Our trade is active, and for those who entered around $64.10 (per the last video analysis), you’re already sitting on +350 pips in profit.
Looking ahead, I expect price to drop below the EIA entry level and potentially test the $62/barrel zone before Friday’s market close.


OIL Trade Setup📢 NFX Trade Update – USOIL FX:USOIL
Price pushed above $64, tagging the 23.6% Fibonacci retracement, which I believe should hold. This move looks like a liquidity grab, hunting short stop-losses (our last setup included 😅). Classic SMC in play.
Now we have clearer insight: the key question is whether price respects the 23.6% Fib or extends higher. Based on strong fundamentals (recent inventory build signaling oversupply), I doubt sustained higher prices. The bearish case still holds weight.
🎥 Full breakdown and details in the video.


USOIL Trade Setup📢 NFX Trade Alert – Swing Setup
💹 Instrument: FX:USOIL Crude Oil (WTI-USD)
🛒 Trade Type: Swing – Sell at Market
📍 Entry: $63.50
⛔ Stop Loss: $64.00
✅ Target Profit: $60.50
Analysis:
Crude Oil turned bearish after failing to hold above the $64.00 resistance. The latest EIA Crude Oil Inventories report (Sep 10, 2025) showed a +3.939M build versus a forecasted -1.900M draw and a previous +2.415M, signaling weaker demand and oversupply pressures.
This aligns with the current technical setup: lower highs forming and supply pressure weighing on price action. A rejection around $63.50 opens room for continuation to the $60.50 support zone. Risk remains tight with a stop above $64.00, maintaining a favorable risk-to-reward profile.
WTI Crude Oil resistance at 6540The WTI Crude Oil is currently trading with a bearish bias, aligned with the broader downward trend. Recent price action shows a retest of the resistance, suggesting a further selling pressure within the downtrend.
Key resistance is located at 6540, a prior consolidation zone. This level will be critical in determining the next directional move.
A bearish rejection from 6540 could confirm the resumption of the downtrend, targeting the next support levels at 6200, followed by 6070 and 6000 over a longer timeframe.
Conversely, a decisive breakout and daily close above 6540 would invalidate the current bearish setup, shifting sentiment to bullish and potentially triggering a move towards 6650, then 6830.
Conclusion:
The short-term outlook remains bearish unless WTI Crude breaks and holds above 6540. Traders should watch for price action signals around this key level to confirm direction. A rejection favours fresh downside continuation, while a breakout signals a potential trend reversal or deeper correction.
This communication is for informational purposes only and should not be viewed as any form of recommendation as to a particular course of action or as investment advice. It is not intended as an offer or solicitation for the purchase or sale of any financial instrument or as an official confirmation of any transaction. Opinions, estimates and assumptions expressed herein are made as of the date of this communication and are subject to change without notice. This communication has been prepared based upon information, including market prices, data and other information, believed to be reliable; however, Trade Nation does not warrant its completeness or accuracy. All market prices and market data contained in or attached to this communication are indicative and subject to change without notice.

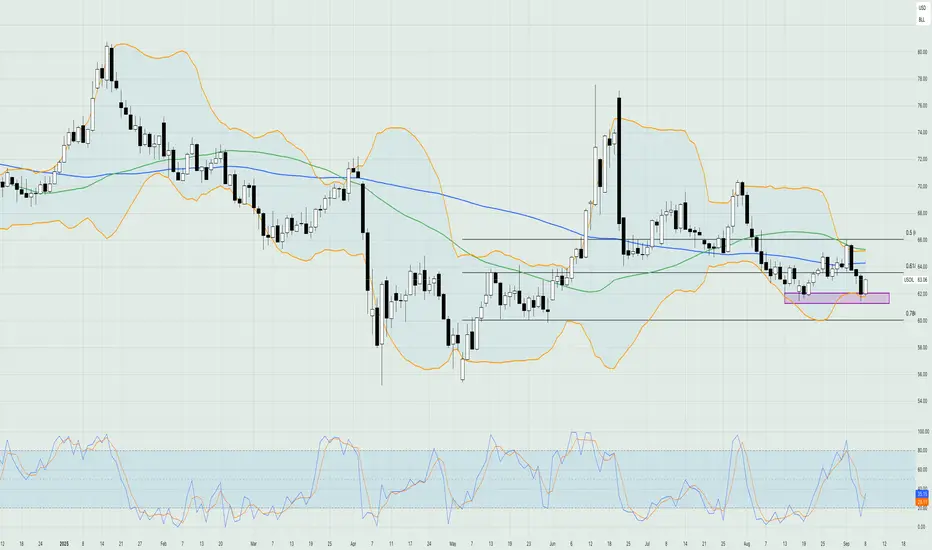
Crude Outlook: sideways moves possible as volatility persistsOil prices ticked higher after OPEC+ approved a modest production increase, reversing earlier cuts and signaling a shift toward market share over price support. While the hike was smaller than in previous months, questions remain over whether members can deliver the extra supply, with some facing limits on output. Geopolitics and China’s stockpiling provide temporary support, but traders are watching inventory data and compliance closely as oversupply risks point to renewed volatility ahead.
On the technical side, the price of crude oil has found sufficient support around the $62 area, which has been a price reaction area since mid-August. The moving averages crossed last week, validating the bearish shift in the market, while the Bollinger bands are still quite expanded, showing that there is volatility to support any significant moves in the short term. The Stochastic oscillator seems to be rebounding from the extreme oversold levels, hinting that the recent sideways movement can project to the upcoming sessions if no major catalyst takes place.
Disclaimer: The opinions in this article are personal to the writer and do not reflect those of Exness

USOIL (WTI) Gann & Harmonic Pattern Points to Major Move!🛢️ 🛢️ USOIL (WTI CRUDE) Points to Major Move! ⚡ 📊
💹 Comprehensive Price Action Strategy | September 2025 Edition 🎯
📈 MARKET SNAPSHOT
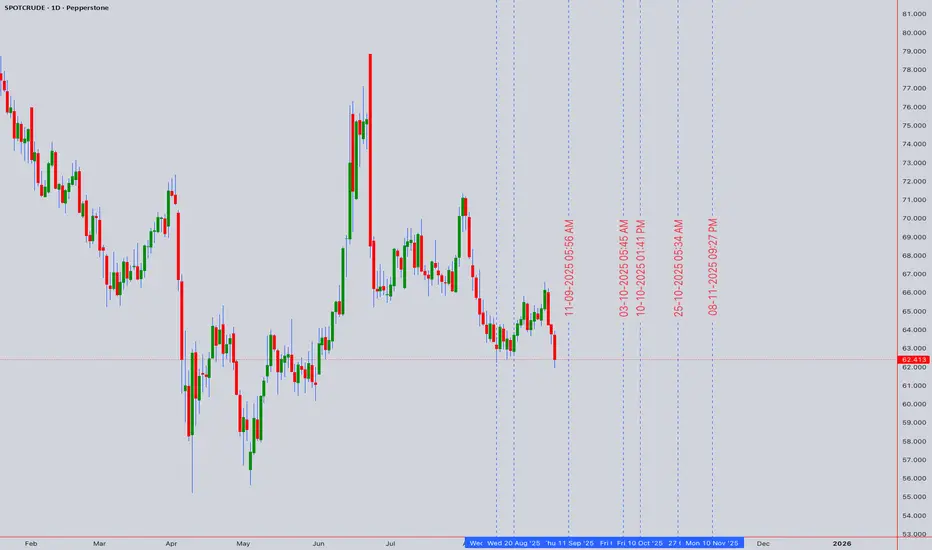
Asset: USOIL (SPOTCRUDE/WTI CASH)
Current Closing Price: $64.413
Date: September 6, 2025
Market Status: 🔴 Critical Support Zone Testing
🎯 EXECUTIVE SUMMARY
WTI Crude Oil is currently trading at $64.413, positioned at a crucial technical juncture. Our multi-timeframe analysis reveals a bearish-to-neutral bias with potential for a significant reversal if key support levels hold. The convergence of multiple technical indicators suggests heightened volatility ahead, presenting both risk and opportunity for astute traders.
📊 COMPREHENSIVE TECHNICAL ANALYSIS
🕯️ Candlestick Pattern Analysis
The recent price action has formed a Bullish Hammer pattern at the $64.00 psychological support level, suggesting potential exhaustion of selling pressure. This formation, combined with increasing volume, indicates possible accumulation phase initiation.
Key Patterns Identified:
- ✅ Bullish Hammer at support
- ⚠️ Evening Star formation on 4H chart
- 📍 Doji cluster indicating indecision
🌊 Elliott Wave Analysis
Current wave count suggests we're completing Wave 5 of a larger corrective structure:
Primary Count: Completing Wave C of ABC correction
Alternative Count: Wave 4 consolidation before final Wave 5 push
Target Zones:
- Bullish: $72.50-$74.00 (Wave 5 extension)
- Bearish: $58.00-$60.00 (Wave C completion)
📐 Harmonic Patterns
A Bullish Bat Pattern is forming on the daily timeframe:
- X: $78.45 (Recent High)
- A: $61.20 (Recent Low)
- B: $71.85 (0.618 Retracement)
- C: $64.41 (Current Price)
- D: $59.80-$60.50 (Projected - 0.886 XA)
Trading Implication: Watch for reversal signals near $60.00 for high-probability long entries.
🔄 Wyckoff Analysis
Current market structure suggests:
Phase: Potential Spring Test within Trading Range
Volume Analysis: Declining volume on recent decline = Lack of selling pressure
Smart Money Behavior: Accumulation signals emerging
Projected Move: Re-accumulation before markup phase
📊 W.D. Gann Analysis
Gann Square of 9 Calculations:
- Current Price: $64.413 sits on 225° angle
- Next Resistance: $68.00 (270° angle)
- Critical Support: $61.00 (180° angle)
Gann Time Cycles:
- September 15, 2025: Major time pivot ⏰
- September 22, 2025: Secondary cycle completion
Gann Fan Analysis:
- Price respecting 2x1 angle from July low
- Break above 1x1 angle at $66.50 signals trend change
☁️ Ichimoku Cloud Analysis
Current Position: Price below cloud - Bearish bias
Tenkan-sen: $65.80 (Immediate resistance)
Kijun-sen: $67.25 (Major resistance)
Cloud Support: $62.00-$63.50
Chikou Span: Bearish, below price 26 periods ago
📉 KEY TECHNICAL INDICATORS
📊 RSI (14-Period)
Current Reading: 42.5
Status: Approaching oversold territory
Divergence: Bullish divergence forming on 4H chart
Signal: Potential reversal zone approaching
📈 Bollinger Bands
Upper Band: $68.20
Middle Band (20 SMA): $65.85
Lower Band: $63.50
Current Position: Testing lower band
Volatility: Bands contracting - Breakout imminent
💹 VWAP Analysis
Daily VWAP: $64.85
Weekly Anchored VWAP: $66.20
Monthly VWAP: $67.50
Volume Profile POC: $65.00 (High volume node)
📊 Moving Averages Confluence
20 EMA: $65.85 ⬇️
50 SMA: $67.20 ⬇️
100 EMA: $69.50 ⬇️
200 SMA: $71.00 ⬇️
Status: Death cross on daily (50/200) - Bearish medium-term
🎯 TRADING STRATEGY
⚡ INTRADAY TRADING (5M-1H)
LONG SETUP 🟢
Entry Zone: $63.80-$64.20
Stop Loss: $63.40 (-1%)
Target 1: $64.80 (+1.5%)
Target 2: $65.40 (+2.5%)
Target 3: $66.00 (+3.5%)
Risk/Reward: 1:3.5
SHORT SETUP 🔴
Entry Zone: $65.60-$65.90
Stop Loss: $66.30 (-1%)
Target 1: $65.00 (-1.5%)
Target 2: $64.40 (-2.5%)
Target 3: $63.80 (-3.5%)
Risk/Reward: 1:3.5
📈 SWING TRADING (4H-DAILY)
BULLISH SCENARIO 🚀
Entry: $64.00-$64.50 (Current levels)
Stop Loss: $61.50 (-4%)
Target 1: $68.00 (+5.5%)
Target 2: $72.00 (+11.8%)
Target 3: $75.50 (+17.2%)
Position Size: 2% portfolio risk
BEARISH SCENARIO 📉
Entry: $65.80-$66.20 (Resistance retest)
Stop Loss: $67.50 (+2%)
Target 1: $62.00 (-6%)
Target 2: $59.50 (-10%)
Target 3: $57.00 (-14%)
Position Size: 1.5% portfolio risk
🗓️ WEEKLY FORECAST
Monday-Tuesday (Sept 9-10) 📅
- Expected Range: $63.50-$65.80
- Bias: Neutral with bullish undertone
- Key Level: Watch $64.00 support hold
Wednesday-Thursday (Sept 11-12) 📅
- Expected Range: $64.00-$67.00
- Bias: Potential breakout day
- Catalyst: EIA Inventory Data
Friday (Sept 13) 📅
- Expected Range: $65.00-$68.50
- Bias: Trend continuation
- Note: Options expiry volatility
🌍 MARKET CONTEXT & FUNDAMENTALS
Geopolitical Factors 🌐
- ⚠️ Middle East tensions supporting price floor
- 🇨🇳 China demand concerns capping upside
- 🇺🇸 SPR refill discussions providing support
Supply/Demand Dynamics ⚖️
- OPEC+ production cuts extended
- US shale production moderating
- Global inventory draws accelerating
Economic Indicators 📊
- Dollar Index weakening (Bullish for Oil)
- Global growth concerns (Bearish pressure)
- Inflation expectations rising (Supportive)
⚠️ RISK MANAGEMENT
Position Sizing Guidelines 💰
Intraday: Max 1-2% account risk per trade
Swing: Max 3-5% account risk per position
Correlation Risk: Monitor energy sector exposure
Stop Loss Strategies 🛡️
1. ATR-Based: 1.5x ATR from entry
2. Structure-Based: Below/above key S/R levels
3. Time-Based: Exit if no movement in 2-3 candles
Risk Factors ⚠️
- 🔴 Break below $61.50 invalidates bullish thesis
- 🔴 Unexpected OPEC+ policy changes
- 🔴 Rapid Dollar strengthening
- 🟢 Surprise inventory draws
- 🟢 Geopolitical escalation
🎯 KEY LEVELS TO WATCH
SUPPORT LEVELS 🟢
S1: $63.50 (Immediate)
S2: $61.50 (Critical)
S3: $59.00 (Major)
S4: $57.00 (Yearly Low)
RESISTANCE LEVELS 🔴
R1: $65.80 (Immediate)
R2: $67.25 (Daily 50MA)
R3: $69.50 (Daily 100MA)
R4: $72.00 (Major)
💡 PRO TRADING TIPS
1. 🎯 Best Entry Times: London/NY overlap (8-11 AM EST)
2. 📊 Volume Confirmation: Look for >20% above average
3. 🔄 Correlation Trades: Monitor USD/CAD inverse relationship
4. ⏰ Avoid Trading: 30 mins before/after EIA releases
5. 📈 Scale Strategy: Add to winners, not losers
🔮 MONTH-END PRICE TARGETS
September 2025 Projections:
Bullish Target: $72.00-$74.00 🎯
Base Case: $66.00-$68.00 📊
Bearish Target: $58.00-$60.00 📉
Probability Assessment:
- Bullish Scenario: 35% 📈
- Base Case: 45% ➡️
- Bearish Scenario: 20% 📉
📌 CONCLUSION & ACTION PLAN
USOIL presents a compelling risk/reward opportunity at current levels. The confluence of technical support at $64.00, combined with oversold conditions and potential harmonic pattern completion, suggests a tactical long position with tight risk management is warranted.
Recommended Strategy:
1. Primary: Accumulate long positions $63.50-$64.50
2. Alternative: Wait for breakout above $66.00 for momentum trades
3. Hedge: Consider put options if below $61.50
📝 TRADING CHECKLIST
Before entering any position:
- ✅ Confirm volume supports move
- ✅ Check RSI for divergences
- ✅ Verify multiple timeframe alignment
- ✅ Set stop loss before entry
- ✅ Calculate position size
- ✅ Review correlation with DXY
- ✅ Check economic calendar
- ✅ Assess market sentiment
🏷️ *Last Updated: September 6, 2025, 12:54 AM UTC+4*
🔔 Follow for daily updates and real-time trading signals!
For individuals seeking to enhance their trading abilities based on the analyses provided, I recommend exploring the mentoring program offered by Shunya Trade. (Website: shunya dot trade)
I would appreciate your feedback on this analysis, as it will serve as a valuable resource for future endeavors.
Sincerely,
Shunya.Trade
Website: shunya dot trade
⚠️Disclaimer: This post is intended solely for educational purposes and does not constitute investment advice, financial advice, or trading recommendations. The views expressed herein are derived from technical analysis and are shared for informational purposes only. The stock market inherently carries risks, including the potential for capital loss. Therefore, readers are strongly advised to exercise prudent judgment before making any investment decisions. We assume no liability for any actions taken based on this content. For personalized guidance, it is recommended to consult a certified financial advisor.
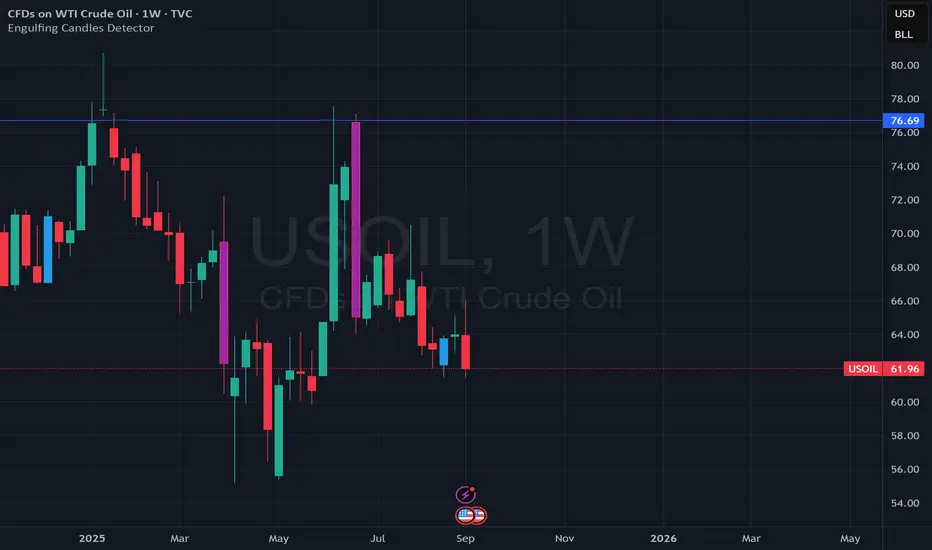
Bearish Engulfing Weekly For Oil Futures. Might be fair to target 60 or more on oil this next week. Since June oil does two bearish weeks in a row and last week was week number 1.
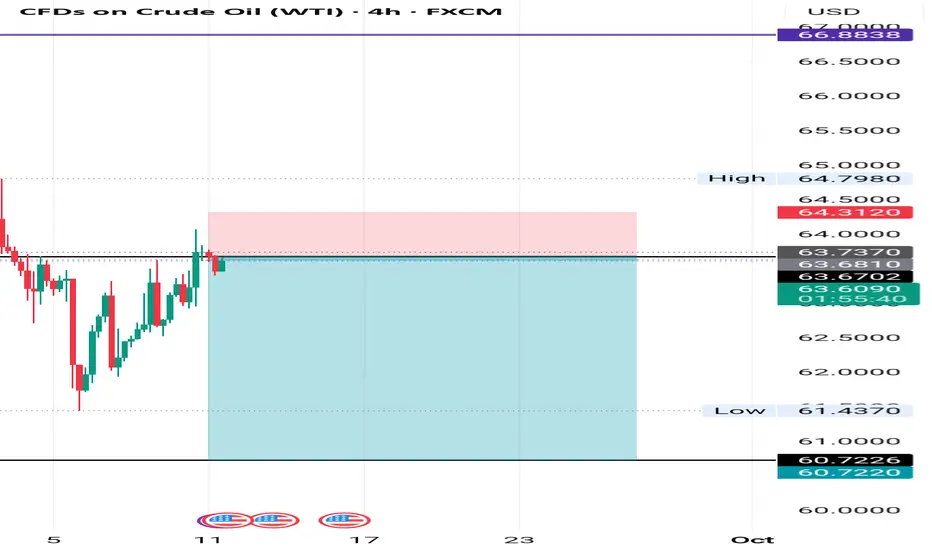
WTI 4HTrading Outlook for the Upcoming Week
In this series of analyses, we review trading perspectives and short-term outlooks.
As can be seen, in each analysis there is a key support/resistance zone near the current price of the asset. The market’s reaction to—or breakout from—this zone will determine the next price movement toward the specified levels.
Important Note: The purpose of these trading outlooks is to highlight key levels ahead of the price and the market’s potential reactions to them. The analyses provided are by no means trading signals!
