Will oil continue its upward trend?
Hi dears
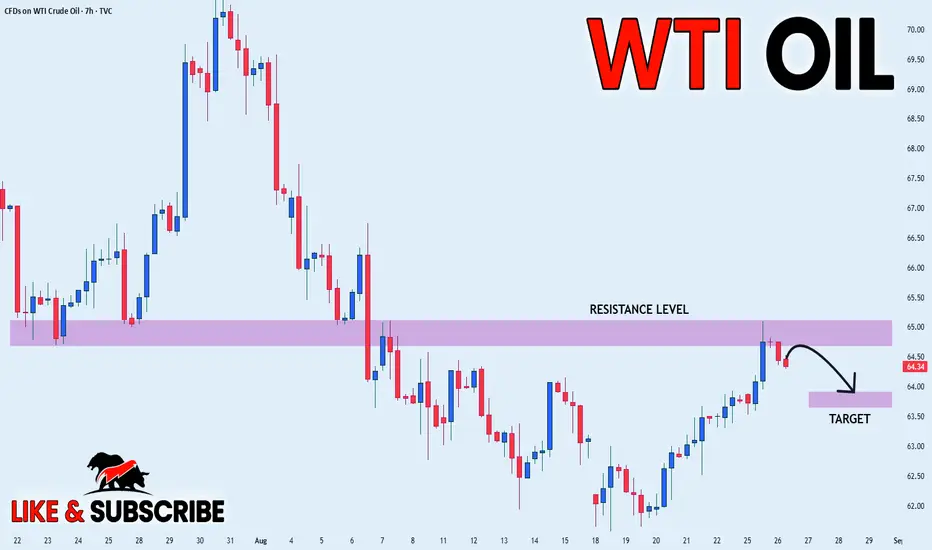
Oil will remain bullish if and only if the price condition on the chart is met. This resistance area must be broken with a strong and bearish candle, otherwise we should continue to see oil prices rally.
It is best to watch for the current situation to determine the status of this resistance area.
Whatdo you think?
USOIL trade ideas

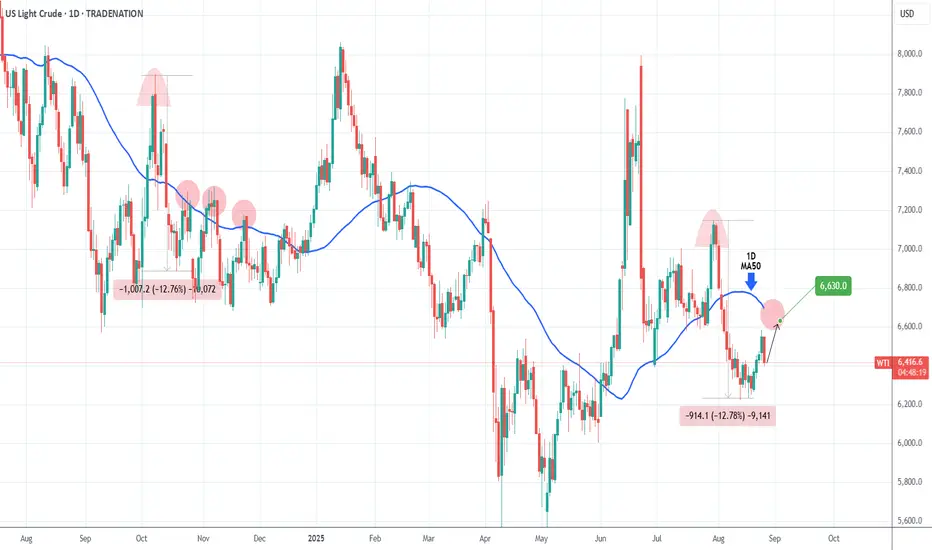
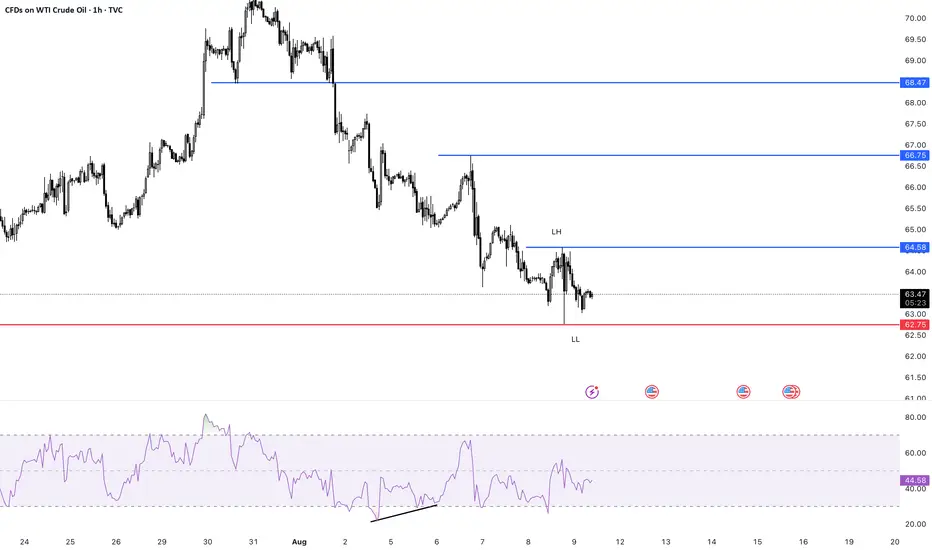
WTI OIL technically more chances to test the 1D MA50. Buy.Last week (August 20, see chart below) we issued a bullish break-out signal on WTI Oil (USOIL) that reached our $65.60 Target within 3 days:
This time we get a new buy signal, despite today's sharp pull-back. The -12.78% decline since the July 30 rejection, resembles the one since the October 08 2024 High.
This rebounded to just above the 1D MA50 (blue trend-line) to form a new Lower High and get rejected again.
As a result, our immediate short-term Target is $66.30.
-------------------------------------------------------------------------------
** Please LIKE 👍, FOLLOW ✅, SHARE 🙌 and COMMENT ✍ if you enjoy this idea! Also share your ideas and charts in the comments section below! This is best way to keep it relevant, support us, keep the content here free and allow the idea to reach as many people as possible. **
-------------------------------------------------------------------------------
Disclosure: I am part of Trade Nation's Influencer program and receive a monthly fee for using their TradingView charts in my analysis.
💸💸💸💸💸💸
👇 👇 👇 👇 👇 👇
USOIL - NEW BREAKOUT!Hello Traders!
The USOIL failed to create a new lower low!
The price broke the resistance level (64.427 - 63.894).
This key level becomes new support!
So, I expect a bullish move🚀
______________
TARGET: 66.200🎯

Crude oil prices are about to start fallingPreviously, market volatility increased due to news reports: Trump's direct dismissal of Federal Reserve Board Governor Tim Cook. This move undoubtedly undermined the Fed's independence. Historically, such incidents have undoubtedly put immeasurable pressure on currencies. The US dollar index plummeted in response, and gold prices followed a V-shaped trend, retracing to the 3351 level as expected and then rising to around 3386 before fluctuating and correcting. The current low is 3367, which is also the entry point for long positions we shared with you. This entry point can be entered twice, and both times it reached the target above 3380.
Crude oil fell rapidly from around 64.7, initiating a short-term correction today. The daily K-line has been rising for several consecutive days, indicating the need for a short-term correction.
Strategy
Open a short position if crude oil rebounds to 64.5. If it continues to rebound to around 65, increase the short position.
The target is around 63.

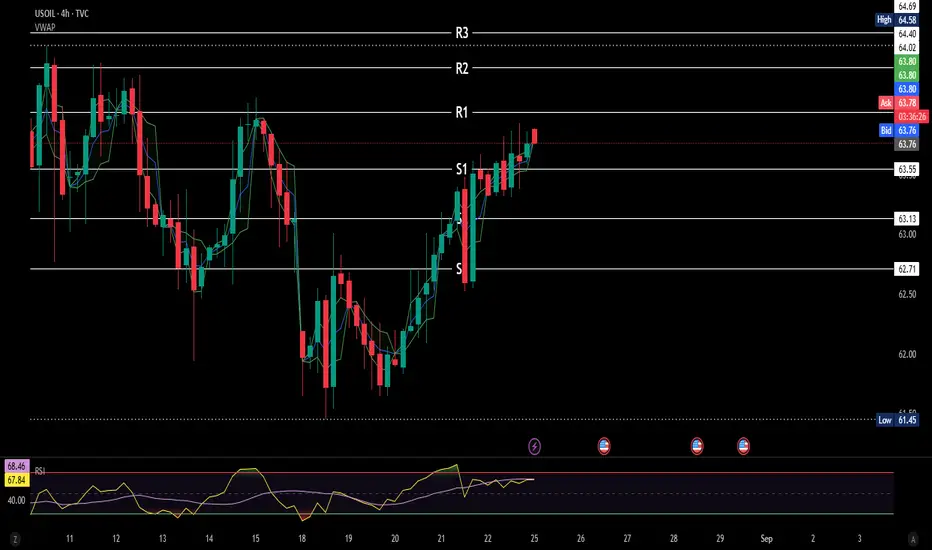
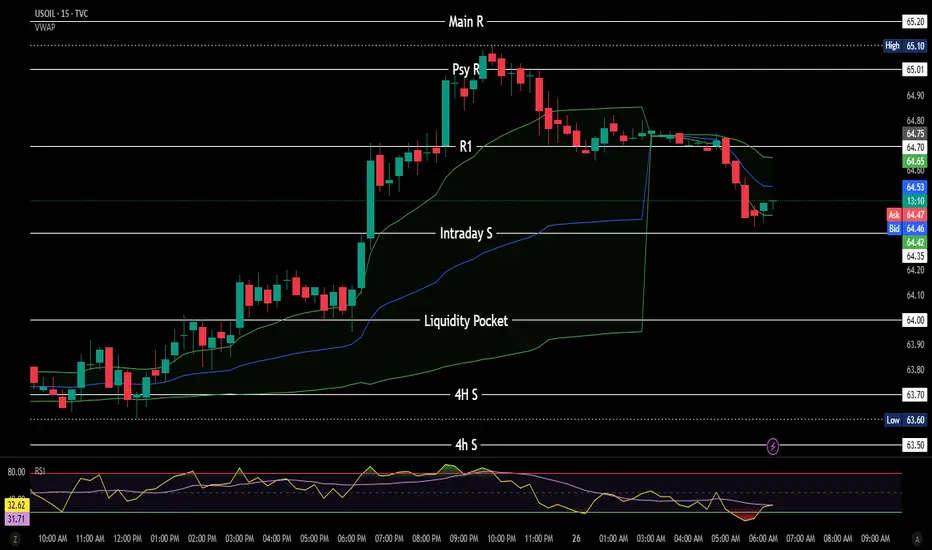
Crude Oil (WTI / USOIL) Technical AnalysisThe price of oil is currently in a downward trend on both the daily and hourly timeframes, and it is testing a support zone at $63.50.
🔹 Bearish Scenario:
If the price breaks the $63.50 support level and holds below it, we may see a target of $63.00.
🔹 Bullish Scenario:
If the price returns to break above $63.90 and holds, this could push the price toward $64.50 as an initial target, followed by a retest of $65.00.

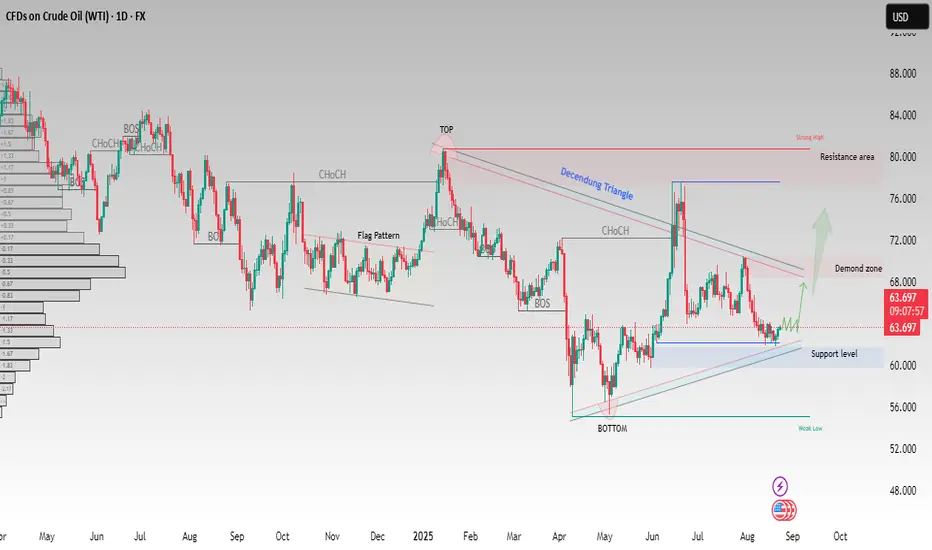
USOIL(WTI) – Demand Zone Tested,Potential Bullish Reversal AheadCrude Oil (WTI) is showing signs of strength after respecting the support level near $60–62 and forming a clear demand zone. Price has been consolidating within a descending structure and is now attempting to push higher.
Key observations:
✅ Support level held strongly near $60.
✅ Multiple Change of Character (CHoCH) signals indicating momentum shift.
✅ A potential breakout above the descending triangle may open the path toward the $70–72 demand zone.
📈 If bullish momentum continues, next targets lie around $76–80 resistance area.
On the downside, a break below $60 would invalidate the bullish setup and expose a move toward $56–54.
This structure highlights a possible trend reversal from the bottom toward higher levels, as long as buyers maintain control above support.
This analysis is for educational purposes only. It is not financial advice. Please trade responsibly and manage your risk
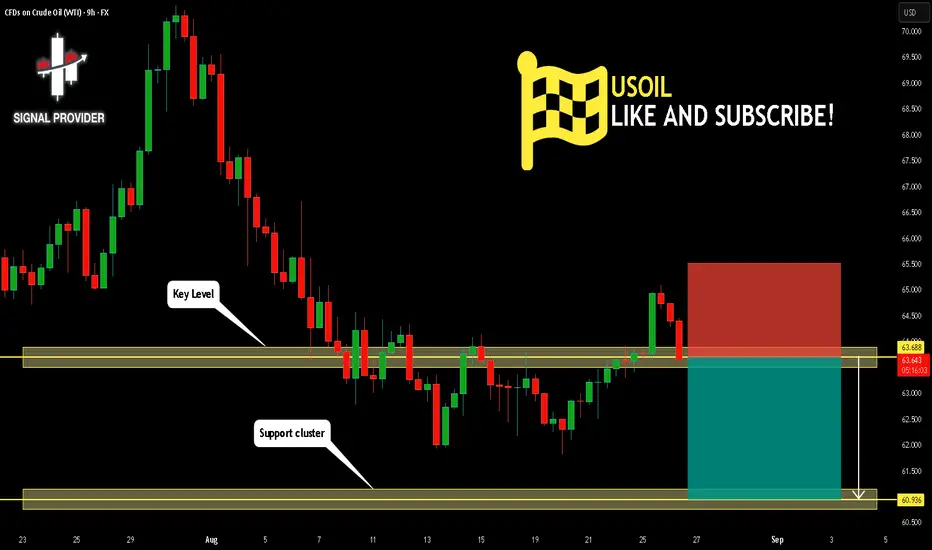
USOIL Is Bearish! Short!
Take a look at our analysis for USOIL.
Time Frame: 9h
Current Trend: Bearish
Sentiment: Overbought (based on 7-period RSI)
Forecast: Bearish
The price is testing a key resistance 63.688.
Taking into consideration the current market trend & overbought RSI, chances will be high to see a bearish movement to the downside at least to 60.936 level.
P.S
The term oversold refers to a condition where an asset has traded lower in price and has the potential for a price bounce.
Overbought refers to market scenarios where the instrument is traded considerably higher than its fair value. Overvaluation is caused by market sentiments when there is positive news.
Disclosure: I am part of Trade Nation's Influencer program and receive a monthly fee for using their TradingView charts in my analysis.
Like and subscribe and comment my ideas if you enjoy them!
ANALYSE US OIL us oil now on way to finish lawt wave
stopt loss : 64.332
target : 61.825
like and folow our profile for more free analyse forex crypto stocks future anything
note :for help or ask for the best place fore entre just inbox me

USOIL USOIL ,I see oil dropping after the break of the weekly demand floor ,the price action show that oil buyers are not ready to go long, if the shot again oil could be trading around 55k-53k per barrel.
trading is probability manage your risk.
GOODLUCK.

CRUDE OIL SHORT FROM RESISTANCE|
✅CRUDE OIL has retested a key resistance level of 65.10$
And as the price is already making a bearish pullback
A move down to retest the demand level below at 63.85$ is likely
SHORT🔥
✅Like and subscribe to never miss a new idea!✅
WTI Edges Up On Big EIA Draw, Risk-on ToneFundamental approach:
- Last week, USOIL was modestly higher amid risk-on sentiment and tighter supply signals after a larger‑than‑expected US crude draw.
- Support came from the EIA’s reported six-million-barrel crude draw tied to lower imports and stronger exports, reinforcing a tightening balance even as Cushing stocks ticked up; broader sentiment also leaned on expectations of looser Fed policy aiding demand.
- Gains were tempered by mixed macro cues, fading Eastern Europe risk headlines, choppy dollar moves, and cautious positioning ahead of the next API/EIA prints.
- However, China's Sinopec last week reported a sharp profit drop, citing weak fuel consumption. The trend of subdued fuel demand is likely to continue as factors including lower consumer confidence, rising electric-vehicle adoption and improved fuel efficiency are reducing petroleum demand in China.
- Into late week, USOIL could firm if US inventories show continued draws and risk tone improves, while any surprise builds or de‑escalation of supply risks may cap rallies; follow‑through from Fed‑cut pricing and geopolitics could potentially steer near‑term direction.
Technical approach:
- USOIL found support quickly after closing below the key level at 63.90. The price is retesting both EMAs and closed above the key level at 63.90, signaling a make-or-break situation. The market awaits a clear breakout to determine the short-term movement.
- If USOIL closes above both EMAs and breaks the descending trendline, the price may continue to advance to retest the following resistance at 67.50.
- On the contrary, closing below the support at 63.90 may prompt a further weakness to retest the next support at 60.00.
PS: I shared a piece of the above ideas on The Wall Street Journal: www.wsj.com
Analysis by: Dat Tong, Senior Financial Markets Strategist at Exness

TRADE WENT SIDEWAYSIn the trade I posted today, the price managed to take the LQ, fill the Buyside FVG and keep climbing higher.
Small loss which will be recovered in the following days!
Follow for more!
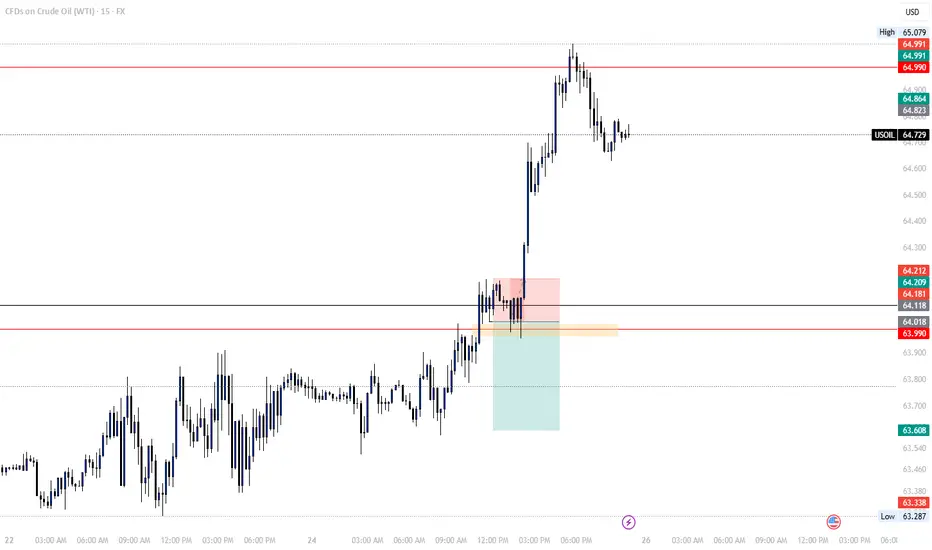
SELL USOILOur trade today on OIL is going to be a short one,
We entered after that the market swept the LQ and gave us a reversal as a confirmation.
Follow for more!

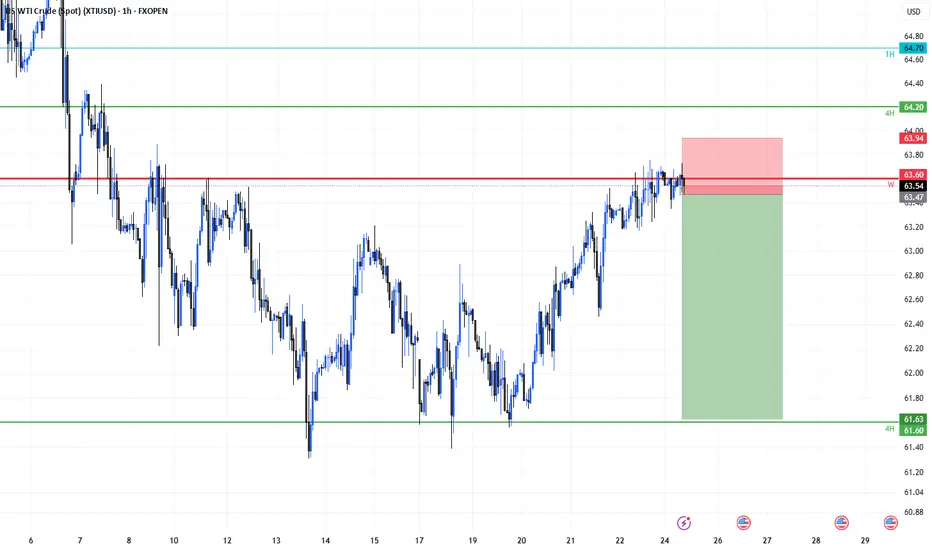
WTI Crude Awaits Breakout Amid Sanction RisksWTI Crude Oil – Overview
Oil Holds Steady on Fed Cut Bets and Sanction Risks
Oil prices are flat in early trade as markets weigh the likelihood of a U.S. Fed rate cut in September against potential disruptions to Russian crude flows. Brent trades at $67.18 (-0.1%), while WTI is steady at $63.64, following a 2.5% gain last week.
Fading optimism over a Russia–Ukraine summit and renewed U.S. tariff threats against India add to volatility. Markets are closely watching the Aug. 27 deadline, when secondary U.S. tariffs against India for Russian oil purchases are expected to take effect.
🔹 Technical Outlook
WTI is trading in bullish momentum as long as it holds above 63.47.
Price is likely to consolidate between 63.47 – 64.72 until a breakout.
✅ Above 64.72: Bullish continuation toward 65.83 → 67.20.
⚠️ Below 63.47: Bias turns bearish, targeting 61.83.
🔹 Key Levels
Support: 63.47 – 61.83
Resistance: 64.72 – 65.83 – 67.20
✅ Summary:
WTI crude remains range-bound but biased to the upside, supported by Fed cut expectations and geopolitical risks. A decisive break from the 63.47–64.72 range will set the next trend direction.

WTI Steadies as Rate-Cut Bets and Supply Risks CollideWTI Steadies as Rate-Cut Bets and Supply Risks Collide
WTI crude hovered around $64 on August 25, steady after last week’s gains as traders balanced U.S. rate-cut expectations with geopolitical risks. The Fed is seen 85% likely to cut rates in September, boosting demand outlooks.
Supply concerns persist after Washington threatened 50% tariffs on Indian imports over Russian oil purchases, while India signaled it will keep buying from Moscow. Stalled Russia-Ukraine talks and renewed attacks on energy infrastructure add to uncertainty.

US OIL LONG RESULT Oil Price had been in multiple falling channel until reaching the support from which it consolidated in a sideways falling wedge and broke to the upside, from which I took the long setup, but price didn't retest the zone to fill it, so I took another entry from the next demand zone and boom, TP done ✅
_THE_KLASSIC_TRADER_.💪🔥

WTI Bull setupSwing trade
Bull points
- RSI div
- Wait for trend reversal
Put Buy stop on last Lower High or wait for HH and HL or reversal
RRR 1:1
Go for 1:2 manage your risk first...
Crude Oil pauses as fed meets supplyOil steadied after a strong week, with WTI holding around $63. Markets are balancing the Fed’s signal of rate cuts, which could support demand, against rising supply from OPEC+ that risks creating an oversupply. The U.S. also moved to double tariffs on Indian imports in retaliation for its continued purchases of Russian crude, though Indian refiners signaled they’ll keep buying from Moscow. Risk assets gained broadly on expectations of easier monetary policy, but analysts cautioned that underlying fundamentals still point to downside risks. On the geopolitical front, Washington has intensified efforts to end the war in Ukraine, with Trump warning of “massive sanctions” on Russia if no deal is reached soon.
On the technical side, the price of crude oil is currently testing the resistance area consisting of the 61.8% of the weekly Fibonacci retracement level and the dynamic resistance between the 50 and 100-day simple moving averages. The Bollinger bands have somewhat contracted, showing that volatility in the market for crude might be slowing down for the time bein,g while the Stochastic oscillator is pushed near the extreme overbought levels, hinting that there might be a bearish correction in the upcoming session,s possibly retesting the lows of $62.
Disclaimer: The opinions in this article are personal to the writer and do not reflect those of Exness

Bearish Outlook: Short Position Based on Technical and FundamentBased on a detailed assessment of key support and resistance levels, as well as recent fundamental news, I believe the price is set to decline. The current price action is approaching a critical resistance zone, which has historically proven to be a strong reversal point. Combined with bearish market sentiment driven by , the outlook for the asset appears to be skewed to the downside.
The risk-reward ratio on this short position is favorable, with the potential for significant profit if the price breaks THE ACCTUAL PRICE. I will be monitoring this trade closely for any signs of reversal or further confirmation of bearish momentum.
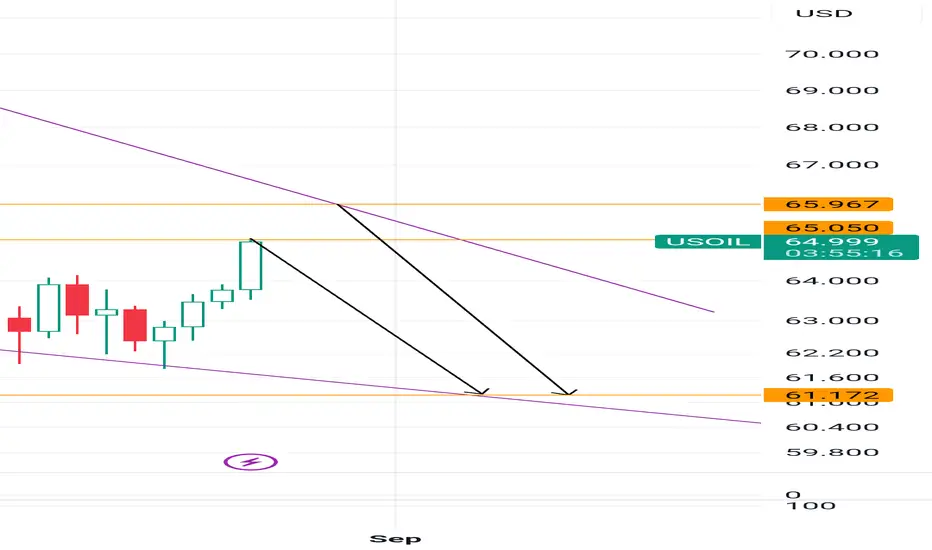
Bearish continuation?WTI Oil (XTI/USD) is rising towards the pivot and could reverse to the 1st support, which is a pullback support.
Pivot: 65.65
1st Support: 60.66
1st Resistance: 70.97
Risk Warning:
Trading Forex and CFDs carries a high level of risk to your capital and you should only trade with money you can afford to lose. Trading Forex and CFDs may not be suitable for all investors, so please ensure that you fully understand the risks involved and seek independent advice if necessary.
Disclaimer:
The above opinions given constitute general market commentary, and do not constitute the opinion or advice of IC Markets or any form of personal or investment advice.
Any opinions, news, research, analyses, prices, other information, or links to third-party sites contained on this website are provided on an "as-is" basis, are intended only to be informative, is not an advice nor a recommendation, nor research, or a record of our trading prices, or an offer of, or solicitation for a transaction in any financial instrument and thus should not be treated as such. The information provided does not involve any specific investment objectives, financial situation and needs of any specific person who may receive it. Please be aware, that past performance is not a reliable indicator of future performance and/or results. Past Performance or Forward-looking scenarios based upon the reasonable beliefs of the third-party provider are not a guarantee of future performance. Actual results may differ materially from those anticipated in forward-looking or past performance statements. IC Markets makes no representation or warranty and assumes no liability as to the accuracy or completeness of the information provided, nor any loss arising from any investment based on a recommendation, forecast or any information supplied by any third-party.