USOIL ANALYSIS SETUP READ THE CAPTIONUSOIL is consolidating above a strong support zone while forming higher lows, indicating bullish pressure building. Price is currently testing the trendline resistance, and a clean breakout could open the way toward the upper target zone. As long as price stays above support, the bullish scenario remains valid.
Please Support with Boost and comments
Trade ideas

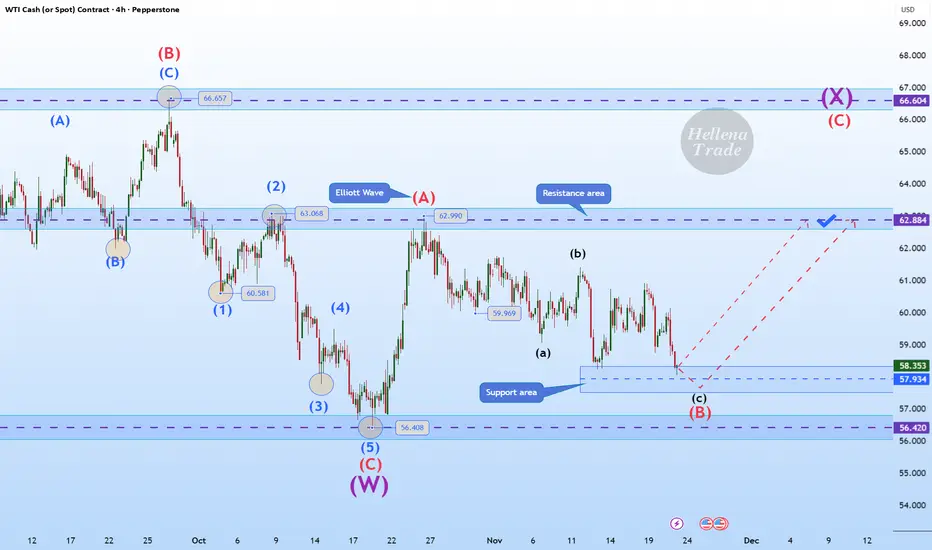
Hellena | Oil (4H): LONG to the area of the maximum of wave “A”.Colleagues, the past forecast has not been canceled, but I see some changes and therefore feel it is necessary to make a fresh forecast.
Apparently, the corrective wave “B” has extended to the area of 57.930. This is quite close to the low of wave “C” at 56.408 and the price should not update it, otherwise there will be a full-fledged break of the structure.
In connection with the above, I think that the price is already completing the downward movement and I expect the resumption of the upward movement at least to the area of the maximum of wave “A” - 62.990.
Manage your capital correctly and competently! Only enter trades based on reliable patterns!
USOIL-Watching for Reversal From Support Zone Toward Key TargetsUSOIL has dropped into a strong support zone near 57.15–57.40, where price is showing early signs of a potential bounce. If this support holds, oil may push upward toward the marked target levels.
Support Zone: 57.15 – 57.40
Target Levels:
Target 1: 58.50
Target 2: 59.21
Target 3: 60.05
Price structure suggests a short-term bullish correction if buyers defend the support area. Waiting for confirmation before continuation toward higher levels.
Kindly Support with comment and bosst i will be glad

Potential bullish reversal?WTI Oil (XTI/USD) is falling towards the pivot and could bounce to the 61.8% Fibonacci resistance.
Pivot: 59.38
1st Support: 59.01
1st Resistance: 60.16
Disclaimer:
The opinions given above constitute general market commentary and do not constitute the opinion or advice of IC Markets or any form of personal or investment advice.
Any opinions, news, research, analyses, prices, other information, or links to third-party sites contained on this website are provided on an "as-is" basis, are intended to be informative only, and are not advice, a recommendation, research, a record of our trading prices, an offer of, or solicitation for, a transaction in any financial instrument and thus should not be treated as such. The information provided does not involve any specific investment objectives, financial situation, or needs of any specific person who may receive it. Please be aware that past performance is not a reliable indicator of future performance and/or results. Past performance or forward-looking scenarios based upon the reasonable beliefs of the third-party provider are not a guarantee of future performance. Actual results may differ materially from those anticipated in forward-looking or past performance statements. IC Markets makes no representation or warranty and assumes no liability as to the accuracy or completeness of the information provided, nor any loss arising from any investment based on a recommendation, forecast, or any information supplied by any third party.

BULLISH SCENARIO - USOILHello traders,
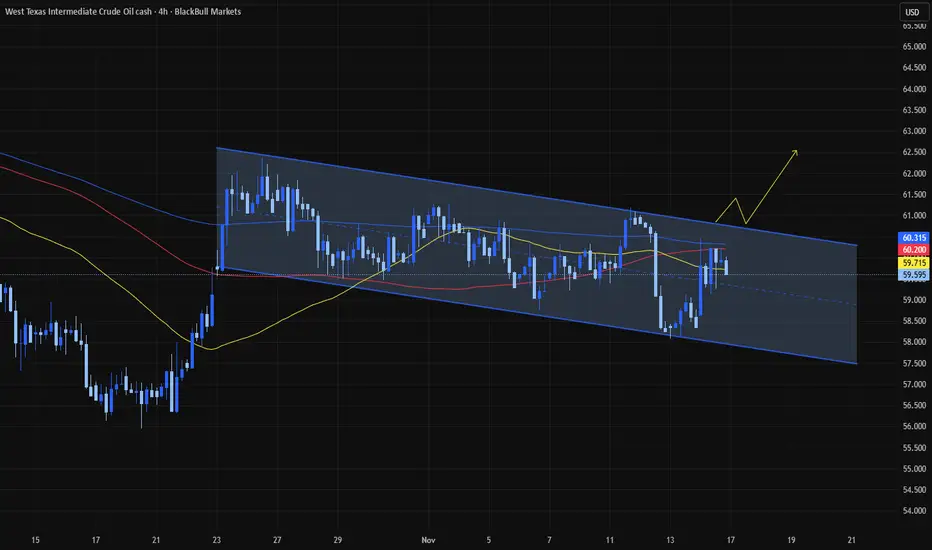
USOIL is currently moving inside a descending channel.
A bullish breakout is in focus:
If the price breaks the channel resistance and confirms the close above,
a strong upward movement is expected 🚀
🎯 TARGET: 65.150

Market Analysis: WTI Crude Oil Extends RecoveryMarket Analysis: WTI Crude Oil Extends Recovery
Crude oil price is rising and it could climb further higher toward $62.00.
Important Takeaways for WTI Crude Oil Price Analysis Today
- WTI Crude oil prices are moving higher above the $60.00 resistance zone.
- There is a key bullish trend line forming with support near $59.80 on the hourly chart of XTI/USD.
WTI Crude Oil Price Technical Analysis
On the hourly chart of WTI Crude Oil, the price started a decent increase from $58.00 against the US Dollar. The price gained bullish momentum after it broke $59.00.
There was a sustained upward movement above $59.50 and $60.00. The bulls pushed the price above the 50-hour simple moving average, and the RSI climbed toward 70. A high was formed near $60.75 before there was a minor pullback.
The price declined toward the 23.6% Fib retracement level of the upward move from the $58.11 swing low to the $60.75 high. However, the bulls are active above $60.00. There is also a key bullish trend line forming with support near $59.80.
Immediate resistance is near $60.75 level. If the price climbs further, it could face hurdles near $61.50. The next major stop for the bulls might be $62.20. Any more gain might send the price toward $63.50.
Conversely, the price might correct gains and retest the 50-hour simple moving average or the trend line. The next area of interest on the WTI crude oil chart is near the 61.8% Fib retracement at $59.10. If there is a downside break, the price might decline to $58.10. Any more losses may perhaps open the doors for a move toward $56.50.
This article represents the opinion of the Companies operating under the FXOpen brand only. It is not to be construed as an offer, solicitation, or recommendation with respect to products and services provided by the Companies operating under the FXOpen brand, nor is it to be considered financial advice.

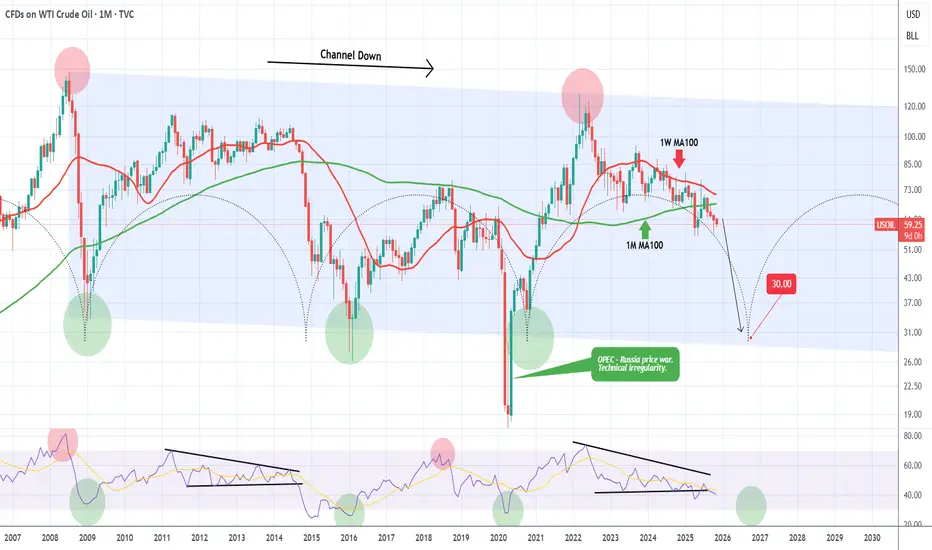
WTI OIL Is it possible to crash at $30.00?WTI Oil (USOIL) has been declining for 3 straight months (current red 1M candle is the 4th one) since the June 2025 rejection on the 1W MA100 (red trend-line). That has been the last rejection of a series of Lower Highs rejections on the 1W MA100 in the past 2 years.
On the much longer-term scale, this is the aftermath of the March 2022 market Top, made as a direct result of the Ukraine - Russia war. On a 17-year horizon, that was the 2nd Lower High of the multi-year Channel Down that WTI has been trading in since the July 2008 Top of the Housing Crisis.
As you can see, there is a high degree of symmetry on this pattern with Lower Lows in particular (market bottoms) getting formed around every 5-6 years. The use of the Time Cycles can fairly accurately project this. The next one is estimated to be towards the end of 2026, which matches perfectly the projected Bear Cycle bottom on the stock markets.
Based on this model, we may very well see WTI drop to as low as $30.00. A fairly solid bottom buy indicator would be when (if) the 1M RSI breaks below its 30.00 (oversold) barrier.
---
** Please LIKE 👍, FOLLOW ✅, SHARE 🙌 and COMMENT ✍ if you enjoy this idea! Also share your ideas and charts in the comments section below! This is best way to keep it relevant, support us, keep the content here free and allow the idea to reach as many people as possible. **
---
💸💸💸💸💸💸
👇 👇 👇 👇 👇 👇
OIL Rejected Again at Resistance OIL Rejected Again at Resistance: Bears Preparing for Another Push Down
Oil continues to struggle below the 60.50–60.60 resistance zone, where price has been rejected multiple times, confirming selling pressure.
Each test of this zone has led to a swift bearish move — and this time might be no different. As long as oil trades below 60.50, the short-term bias remains bearish.
A clean breakdown could open the way toward:
🎯Quick Target: 59.40
🎯 Target 1: 59.00
🎯 Target 2: 58.30
You may find more details in the chart!
Thank you and Good Luck!
❤️PS: Please support with a like or comment if you find this analysis useful for your trading day❤️

WTI/USD: Bullish Rally to 62.45?CFI:WTI is gearing up for a bullish rally on the 4-hour chart , with price rebounding from a key support zone near cumulative long liquidation levels, setting up a strong entry opportunity if buyers maintain control and push toward resistance amid recent consolidation. Entry from current levels could also be favorable with proper risk management.
Entry zone between 57.5-58.3 for a buy position. Target at 62.45 near resistance.🎯 Set a stop loss at 56.335 , offering a risk-reward ratio greater than 1:2 . 📊 Watch for confirmation with a bullish close above entry and rising volume, capitalizing on oil's volatility.🌟
Fundamentally , WTI crude has fallen to around $58.13 per barrel as of November 21, 2025, amid supply outpacing demand, but recent breakouts above $60.7 signal near-term positivity despite forecasts of further drops to $53.50-$45.00 due to OPEC+ hikes and record US output. 💡
📝 Trade Setup
🎯 Entry Zone (Long): 57.5 – 58.3
🎯 Target (TP1): 62.45
❌ Stop Loss: 56.335
⚖️ Risk-to-Reward: Greater than 1:2, offering a clean upside swing with defined invalidation.
What's your take on this setup? Drop your thoughts below! 👇

OIl in to start wave e of traingle B (Long - Short/Medium Term)- The clearest count right now is that we are in the start of wave E around 65- 70 of traiangle B.
- To follow a deeper correcton for wave C to around $30 a Barrel

USOIL strong down trend entry on consolidation breakdown USOIL Technical Outlook – 4H Timeframe
USOIL continues to show strong downside momentum, with sellers maintaining control. Price is currently respecting the downtrend structure, and a consolidation breakdown below 59,100 is confirming further bearish pressure.
📉 Key Technical Levels:
Immediate Support: 58,300
Next Major Support: 56,400
As always, ensure you are using proper risk management and wait for clear confirmations before entering any position.
👍 Like • Follow • Comment • Share
Stay updated for more professional market insights.

USOIL : LIVE TRADEHello friends
Given the price growth, you can see that buyers have repeatedly tried to break the resistance but were unsuccessful and the weakness of the trend is quite clear.
Now we can trade with capital and risk management and account management.
This is not a buy or sell offer.
*Trade safely with us*

WTI resumes slideExcess supply concerns continue to hold back oil each time it tries to stage a recovery, and today it looks like the market has decided that it wants to trade below $60 per barrel. WTI has been testing this barrier from underneath for a few days but today it looks like the advance has been rejected once again. Prices have broken below the lows of the past two days, thus triggering some stops. From here $58.00 could be the next stop, below which there is nothing significant in terms of support until $55.00.
By Fawad Razaqzada, market analyst with FOREX.com

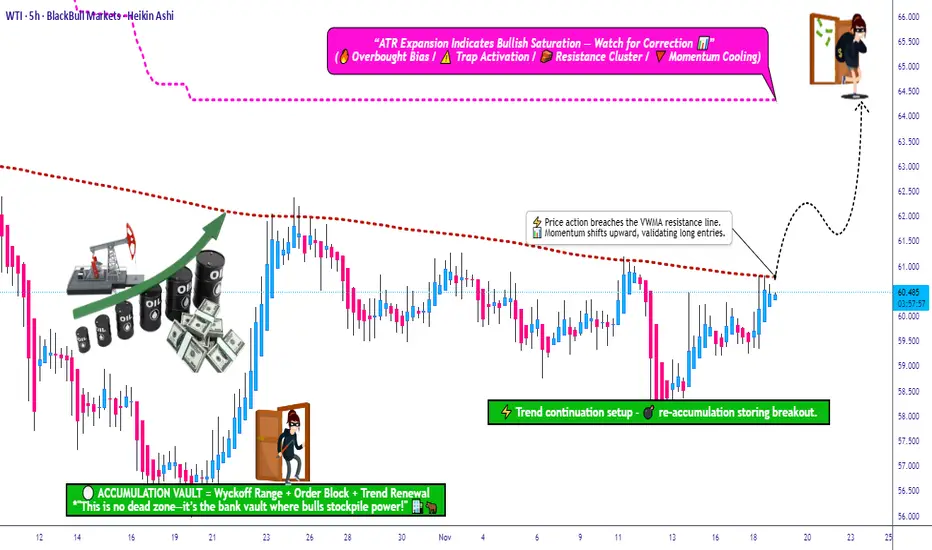
USOIL Breakout Confirmed—Is the Uptrend Ready to Extend?📈 WTI CRUDE OIL (USOIL) – SWING TRADE SETUP | VWMA BREAKOUT CONFIRMED 🛢️⚡
🎯 TRADE OVERVIEW
Asset: WTI Crude Oil (USOIL) – Energies Market
Trade Type: Swing Trade (Multi-Day Position)
Bias: 🟢 BULLISH – Volume Weighted Moving Average (VWMA) breakout confirmed near $61.00
📊 TRADE PLAN
🔹 Entry Strategy: "Thief Layering Method"
Primary Entry Zone: Post-VWMA breakout above $61.00
Layered Limit Orders (Multiple Entry Points):
🟦 Layer 1: $59.00
🟦 Layer 2: $59.50
🟦 Layer 3: $60.00
🟦 Layer 4: $60.50
Note: You can add more layers based on your capital allocation and risk tolerance. This strategy allows averaging into the position as price pulls back.
🛑 Stop Loss Management
Thief's SL: $58.00
⚠️ IMPORTANT: Dear Ladies & Gentlemen (Thief OG's),
This is MY stop loss level. Adjust YOUR stop loss based on YOUR strategy and risk management plan. I do not recommend blindly following my SL – manage your own risk and capital accordingly.
🎯 Take Profit Target
Primary Target: $64.00
Technical Reasoning:
SuperTrend ATR line acts as strong dynamic resistance
Potential overbought zone + bull trap risk
Escape with profits before reversal pressure
⚠️ IMPORTANT: Dear Ladies & Gentlemen (Thief OG's),
This is MY take profit target. Take YOUR money at YOUR own risk. You are responsible for your profit-taking strategy – trail stops, scale out, or exit fully based on YOUR trading plan.
🔗 CORRELATED PAIRS TO WATCH (USD-Denominated)
Monitor these related assets for confirmation and risk assessment:
🛢️ Energy Sector:
Brent Crude Oil (UKOIL) – Typically trades $2-5 above WTI; if Brent is bullish, WTI usually follows
Natural Gas (NATGAS) – Energy sector sentiment indicator
💵 Currency Pairs:
USD/CAD – Inverse correlation to oil (CAD = petro-currency). If oil rises, USD/CAD typically falls
DXY (US Dollar Index) – Strong dollar = bearish pressure on oil. Watch for weakness in DXY to support oil rally
📈 Equity Markets:
Energy Sector ETFs (XLE) – Tracks US energy stocks; bullish XLE confirms oil sector strength
S&P 500 (SPX) – Risk-on sentiment supports commodity prices
⚡ Key Correlation Points:
Oil ↑ + USD/CAD ↓ = Strong bullish confirmation
Oil ↑ + DXY ↓ = Supportive macro environment
Oil ↑ + XLE ↑ = Energy sector momentum aligned
💬 Engagement Call-to-Action
👍 If you found this analysis helpful, smash that LIKE button!
💬 Drop your thoughts in the comments – are you bullish or bearish on oil?
🔔 FOLLOW for more professional trade setups and market insights!
CRUDE OIL (WTI): Bullish Move After Trap
There is a high chance that Crude Oil will pull back
from the underlined daily key level.
I see a confirmed bear trap followed by a bullish imbalance
candle on an hourly.
I expect a rise at least to 58.51 level.
❤️Please, support my work with like, thank you!❤️
I am part of Trade Nation's Influencer program and receive a monthly fee for using their TradingView charts in my analysis.

How to Trade Crude Oil with Smart Money Concepts SMC Explained
Smart Money Concepts is one of the most reliable techniques for trading WTI Crude Oil.
In this article, I will teach you a profitable SMC strategy for analysing and trading USOIL futures and CFD.
This simple strategy is based on an important event every SMC trader should know - a break of structure BoS.
In a bullish trend, the best break of structure will be based on a violation and a candle close above a current higher high.
It will signify a highly probable bullish continuation and provides a great opportunity to buy
Though you can spot a bullish break of structure on any time frame, the most reliable one is a daily.
After a formation of a new high, I suggest waiting for a short term intraday correctional movement.
With a high probability, the market will retest a recently broken structure and smart money will manipulate the market, pushing the price below that, making buyers close their positions.
Once the market starts retracing, analyze an hourly time frame. The price will need to establish an i ntraday minor bearish trend.
In this bearish trend, 2 trend lines should connect lower highs and lower lows composing an expanding, parallel or contracting channel - a bullish flag pattern.
Your best signal will be a breakout of a resistance line of the flag and a violation of the level of the last lower high - a bullish change of character of a liquidity grab.
It will confirm a completion of a correction.
Buy the market on a retest of the level of the last higher low, it will be your best entry.
Set your stop loss at least below a trend line and aim at the next strong daily resistance.
That will be a perfect model for trading break of structure on WTI Crude Oil.
We spotted such a setup in my trading academy on one of the live streams with my students.
WTI Crude Oil was trading in an uptrend on a daily time frame.
A bullish violation of the last Higher High and a candle close above that confirmed a Break of Structure BoS.
The price started a correctional movement then, and we spotted a bullish flag pattern on an hourly time frame.
The market completed a correction after grabbing a liquidity below a broken structure.
A bullish movement started then, and the price violated a resistance line of the flag and the level of the last lower high.
These 2 breakouts confirmed a completion of a correction and a resumption of a bullish trend.
We opened a buy position immediately on a retest of a broken level of the last lower high.
Stop loss was below a trend line, take profit was based on the closest key daily resistance.
And the price went straight to the target.
Break of Structure BoS will be useful for analysis, forecasting and trading WTI Crude Oil.
Combining that with top-down analysis and lower time frames confirmations will provide accurate signals and profitable trading setups.
Integrate a price model that I shared in your strategy, and good luck to you trading USOIL!
❤️Please, support my work with like, thank you!❤️
I am part of Trade Nation's Influencer program and receive a monthly fee for using their TradingView charts in my analysis.

Weekly Watchlist – Oil AnalysisThese days, oil prices have dropped due to the relatively calm situation in the Middle East. However, over the past couple of days, disruptions in tanker traffic suggest that oil could open **higher this week**.
Therefore, a breakout above the channel — after proper confirmation — could present a **long position opportunity**. It’s essential to wait for confirmation to ensure the price doesn’t fake out and return back into the channel.
USOIL:LIVE TRADEHello friends
you can see that we had a decline and the sellers were in power until the support was determined with Fibonacci, where buyers entered and were able to support the price.
Now, with Fibonacci, we have determined a resistance area for buyers that can move up to there, but considering the main trend, which is negative, the price increase is an opportunity for a sell trade.
Don't forget risk and capital management.
*Trade safely with us*


Oil analysis updateYou go to sleep at night, wake up in the morning, and suddenly see a two-meter candle.
On the 15-minute timeframe, you can trade within this range, and on higher timeframes, stay alert.
It’s a sudden move, so don’t miss the upward push in oil — set an alert or a buy stop.

Potential bearish drop?WTI Oil (XTI/USD) could rise towards the pivot and could reverse to the 1st support which acts as a swing low support.
Pivot: 60.07
1st Support: 56.77
1st Resistance: 61.63
Disclaimer:
The opinions given above constitute general market commentary and do not constitute the opinion or advice of IC Markets or any form of personal or investment advice.
Any opinions, news, research, analyses, prices, other information, or links to third-party sites contained on this website are provided on an "as-is" basis, are intended to be informative only, and are not advice, a recommendation, research, a record of our trading prices, an offer of, or solicitation for, a transaction in any financial instrument and thus should not be treated as such. The information provided does not involve any specific investment objectives, financial situation, or needs of any specific person who may receive it. Please be aware that past performance is not a reliable indicator of future performance and/or results. Past performance or forward-looking scenarios based upon the reasonable beliefs of the third-party provider are not a guarantee of future performance. Actual results may differ materially from those anticipated in forward-looking or past performance statements. IC Markets makes no representation or warranty and assumes no liability as to the accuracy or completeness of the information provided, nor any loss arising from any investment based on a recommendation, forecast, or any information supplied by any third party.

U S OILHI GUYS,
We expected a small triple top price pattern H4 last week,
however what has change is a market failed to form the correct sell pattern leading to a wide spread ranging as illustrated in the white box with wrong combination of sell patterns colored purple days of the week strategy.
we are currently out of the white box as of Friday yesterday market presented a proper price pattern on the on going correction.
we expect a continuation buy pattern (Monday, Tuesday) . then later in the week we then expect a sell pattern (Wednesday, Thursday) correction around level 61000

Crude oil trading strategyDemand side: Structural highlights stand out, terminal consumption resilience exceeds expectations
Asia resumes replenishment demand temporarily
China's refining margins have recovered (the 3-2-1 cracking spread has risen to $26 per barrel), with sufficient remaining import quotas in November, and it is expected that crude oil purchase volume will increase by 12%-15% in the latter half of the month. India's refineries have initiated a new round of replenishment due to the traditional consumption peak in December (increased holiday travel), with the import volume expected to exceed 5.4 million barrels per day in November. The increase in Asian demand accounts for more than 70% of the global demand increase, becoming a key support for short-term bulls.
Finished oil inventory reduction confirms consumption resilience
The latest EIA data shows that gasoline inventories have decreased for two consecutive weeks (cumulative reduction of 1.8 million barrels), and distillate oil inventories have decreased for three consecutive weeks (cumulative reduction of 2.1 million barrels). The extent of finished oil inventory reduction far exceeds market expectations, reflecting the resilience of terminal consumption. U.S. gasoline retail sales increased by 3.2% month-on-month (a new high in the past two months), and European diesel consumption decreased by 2.1% (previously 5.8%), with the improvement in the consumption side easing concerns about "weak demand", providing fundamental support for the rebound in crude oil prices.
Crude oil trading strategy
buy:59.30-59.60
tp:60.20-60.50
sl:58.80
