USOIL Will Go Lower From Resistance! Sell!
Here is our detailed technical review for USOIL.
Time Frame: 12h
Current Trend: Bearish
Sentiment: Overbought (based on 7-period RSI)
Forecast: Bearish
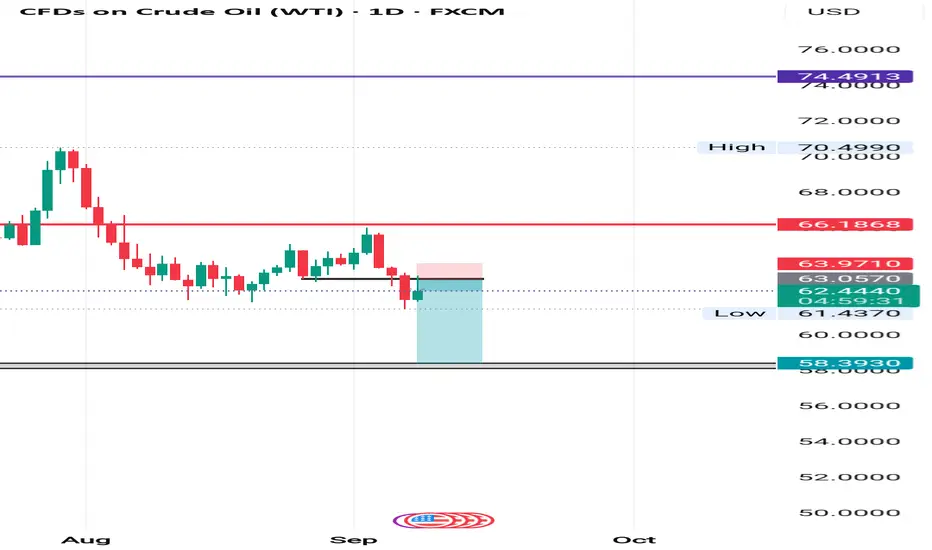
The market is testing a major horizontal structure 61.941.
Taking into consideration the structure & trend analysis, I believe that the market will reach 58.529 level soon.
P.S
The term oversold refers to a condition where an asset has traded lower in price and has the potential for a price bounce.
Overbought refers to market scenarios where the instrument is traded considerably higher than its fair value. Overvaluation is caused by market sentiments when there is positive news.
Disclosure: I am part of Trade Nation's Influencer program and receive a monthly fee for using their TradingView charts in my analysis.
Like and subscribe and comment my ideas if you enjoy them!
USOIL trade ideas

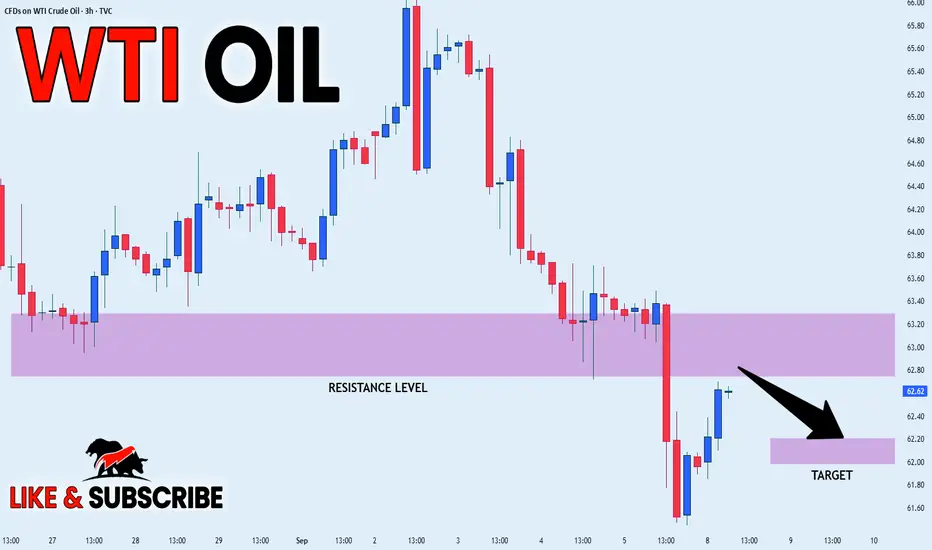
USOIL LOCAL SHORT|
✅CRUDE OIL is going up to retest
A horizontal resistance of 63.00$
And as OIL is in the downtrend
I am locally bearish biased
So I think that we will see a pullback
And a move down from the level
Towards the target below at 62.20$
SHORT🔥
✅Like and subscribe to never miss a new idea!✅
BUY USOILBeen a while since I last shared a trade to take, but today as you can see, the market grabbed the LQ to give us an entry point to take for a long trade.
Follow for more!

Brent Crude Futures Remember when Oil was $100 a barrel??? Looks like we are headed right back there.
Every 90 weeks we get a "change in trend" for Brent. This week Brent is 180 weeks down from high and 90 weeks from low. It is time for a turn. Brent was up 1.4% August 26. It is turning higher in sync with this 90-week cycle. And when you see a close above 72.65, be ready for "panic buying" and an oil shock.
But we all can use a little exercise. Time to either ride bikes, car share or SAVE and MANAGE money for Gas!!

USOIL BEARS WILL DOMINATE THE MARKET|SHORT
USOIL SIGNAL
Trade Direction: short
Entry Level: 65.90
Target Level: 59.95
Stop Loss: 69.84
RISK PROFILE
Risk level: medium
Suggested risk: 1%
Timeframe: 1D
Disclosure: I am part of Trade Nation's Influencer program and receive a monthly fee for using their TradingView charts in my analysis.
✅LIKE AND COMMENT MY IDEAS✅

Bearish reversal forming at key resistance?WTI Oil (XTI/USD) is rising towards the pivot, which is an overlap resistance and could reverse to the 1st support.
Pivot: 65.82
1st Resistance: 66.80
1st Support: 63.79
Risk Warning:
Trading Forex and CFDs carries a high level of risk to your capital and you should only trade with money you can afford to lose. Trading Forex and CFDs may not be suitable for all investors, so please ensure that you fully understand the risks involved and seek independent advice if necessary.
Disclaimer:
The above opinions given constitute general market commentary, and do not constitute the opinion or advice of IC Markets or any form of personal or investment advice.
Any opinions, news, research, analyses, prices, other information, or links to third-party sites contained on this website are provided on an "as-is" basis, are intended only to be informative, is not an advice nor a recommendation, nor research, or a record of our trading prices, or an offer of, or solicitation for a transaction in any financial instrument and thus should not be treated as such. The information provided does not involve any specific investment objectives, financial situation and needs of any specific person who may receive it. Please be aware, that past performance is not a reliable indicator of future performance and/or results. Past Performance or Forward-looking scenarios based upon the reasonable beliefs of the third-party provider are not a guarantee of future performance. Actual results may differ materially from those anticipated in forward-looking or past performance statements. IC Markets makes no representation or warranty and assumes no liability as to the accuracy or completeness of the information provided, nor any loss arising from any investment based on a recommendation, forecast or any information supplied by any third-party.

USOIL Buy Plan Exceeds Profit TargetThis USOIL accurate buy trade signal was accurately reached, and the rise exceeded the TP target of 62.2-62.8 area, and those traders who executed it would have won profits.
Potential bearish drop?WTI Oil (XTI/USD) has rejected off the pivot, which has been identified as a pullback resistance and could drop to the pullback support.
Pivot: 65.81
1st Support: 57.80
1st Resistance: 68.85
Disclaimer:
The above opinions given constitute general market commentary, and do not constitute the opinion or advice of IC Markets or any form of personal or investment advice.
Any opinions, news, research, analyses, prices, other information, or links to third-party sites contained on this website are provided on an "as-is" basis, are intended only to be informative, is not an advice nor a recommendation, nor research, or a record of our trading prices, or an offer of, or solicitation for a transaction in any financial instrument and thus should not be treated as such. The information provided does not involve any specific investment objectives, financial situation and needs of any specific person who may receive it. Please be aware, that past performance is not a reliable indicator of future performance and/or results. Past Performance or Forward-looking scenarios based upon the reasonable beliefs of the third-party provider are not a guarantee of future performance. Actual results may differ materially from those anticipated in forward-looking or past performance statements. IC Markets makes no representation or warranty and assumes no liability as to the accuracy or completeness of the information provided, nor any loss arising from any investment based on a recommendation, forecast or any information supplied by any third-party.

USOIL BULLISH BIAS RIGHT NOW| LONG
USOIL SIGNAL
Trade Direction: long
Entry Level: 63.13
Target Level: 65.08
Stop Loss: 61.82
RISK PROFILE
Risk level: medium
Suggested risk: 1%
Timeframe: 9h
Disclosure: I am part of Trade Nation's Influencer program and receive a monthly fee for using their TradingView charts in my analysis.
✅LIKE AND COMMENT MY IDEAS✅

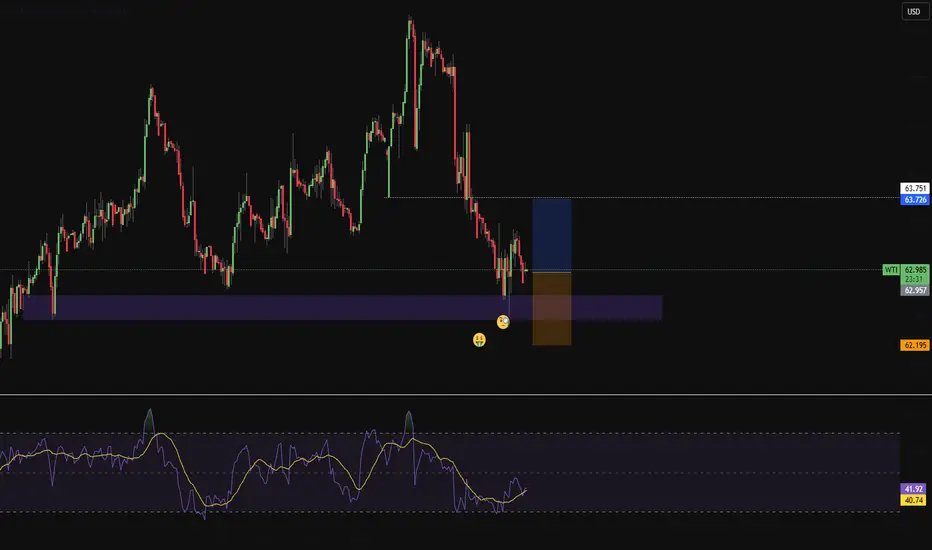
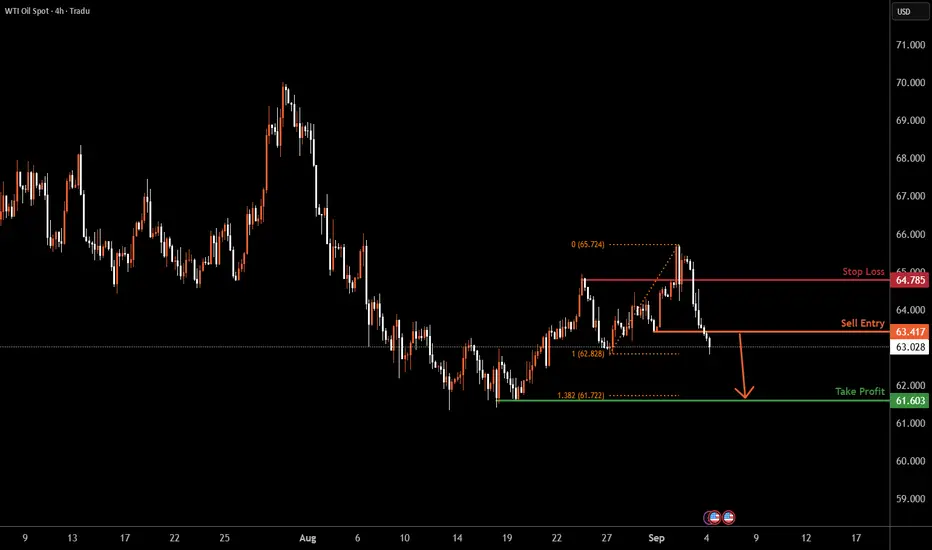
USOIL H4 | Potential bearish dropBased on the H4 chart analysis, we can see that the price has reacted off the sell entry, which is a pullback resistance and could drop from this level to the downside.
Sell entry is at 63.41, which is a pullback resistance.
Stop loss is at 64.78, which is a pullback resistance.
Take profit is at 61.60, which is a swing low support that lines up with the 138.2% Fibonacci extension.
High Risk Investment Warning
Trading Forex/CFDs on margin carries a high level of risk and may not be suitable for all investors. Leverage can work against you.
Stratos Markets Limited (tradu.com ):
CFDs are complex instruments and come with a high risk of losing money rapidly due to leverage. 65% of retail investor accounts lose money when trading CFDs with this provider. You should consider whether you understand how CFDs work and whether you can afford to take the high risk of losing your money.
Stratos Europe Ltd (tradu.com ):
CFDs are complex instruments and come with a high risk of losing money rapidly due to leverage. 66% of retail investor accounts lose money when trading CFDs with this provider. You should consider whether you understand how CFDs work and whether you can afford to take the high risk of losing your money.
Stratos Global LLC (tradu.com ):
Losses can exceed deposits.
Please be advised that the information presented on TradingView is provided to Tradu (‘Company’, ‘we’) by a third-party provider (‘TFA Global Pte Ltd’). Please be reminded that you are solely responsible for the trading decisions on your account. There is a very high degree of risk involved in trading. Any information and/or content is intended entirely for research, educational and informational purposes only and does not constitute investment or consultation advice or investment strategy. The information is not tailored to the investment needs of any specific person and therefore does not involve a consideration of any of the investment objectives, financial situation or needs of any viewer that may receive it. Kindly also note that past performance is not a reliable indicator of future results. Actual results may differ materially from those anticipated in forward-looking or past performance statements. We assume no liability as to the accuracy or completeness of any of the information and/or content provided herein and the Company cannot be held responsible for any omission, mistake nor for any loss or damage including without limitation to any loss of profit which may arise from reliance on any information supplied by TFA Global Pte Ltd.
The speaker(s) is neither an employee, agent nor representative of Tradu and is therefore acting independently. The opinions given are their own, constitute general market commentary, and do not constitute the opinion or advice of Tradu or any form of personal or investment advice. Tradu neither endorses nor guarantees offerings of third-party speakers, nor is Tradu responsible for the content, veracity or opinions of third-party speakers, presenters or participants.
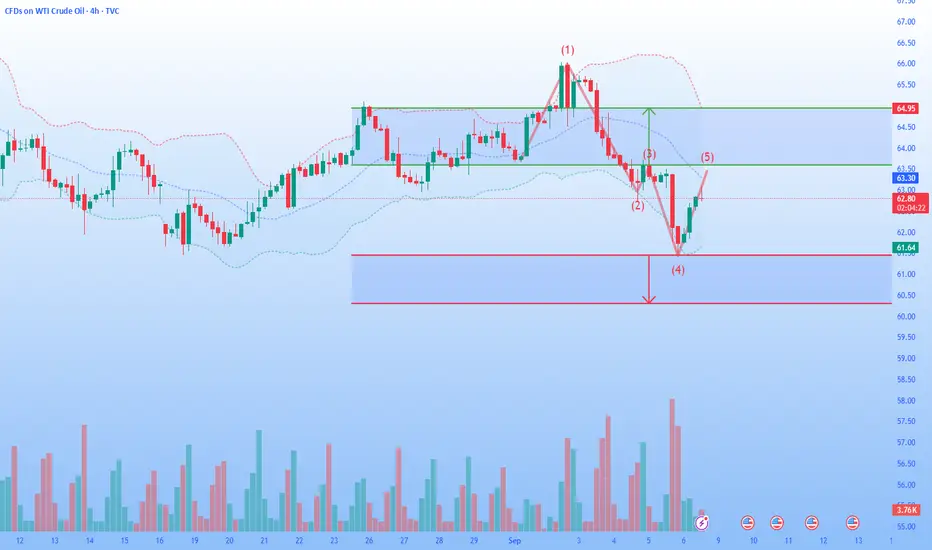
OILUSD – Demand Zone Reaction (4H Analysis)Price has been moving in a bearish trend, forming lower highs and lower lows. Recently, it tapped into a strong demand zone (blue box) and is now showing signs of a bullish reaction.
🔎 Key Points:
Price reacted strongly from the demand zone.
A trendline break is visible, suggesting bearish momentum is weakening.
Stop loss is placed below the demand zone (61.36).
Take profit is set at the next supply zone / resistance around 66.05.
💡 If buyers hold this level, we may see a strong push toward 66.05. But if demand fails, price could revisit lower levels.

WTI Oil Shorting Opportunity | Technical + Macro Confirm📌 WTI CRUDE OIL | Money-Making Thief Plan 🛢️ (Swing/Day Trade)
🗡️ Thief Strategy Plan (Bearish Bias)
Plan: Bearish setup confirmed — sellers in control after MA rejection of bulls 📉
Entry (Layered Style):
63.000 🔪
62.500 🔪
62.000 🔪
61.500 🔪
(You may increase or adjust layers based on your own plan)
Stop Loss (Thief SL): @64.000 ❌
⚠️ Adjust SL according to your risk & strategy
Target (Thief TP): Key resistance zone + overbought trap @4.6700 🎯
Note: Dear Ladies & Gentlemen (Thief OG’s) — I don’t recommend locking only my TP. Take your profits wisely & manage risk responsibly. 💰
❓ Why This Plan?
Moving average rejection confirms sellers’ dominance ⚔️
Technical indicators showing strong sell bias 📉
Layered entry strategy helps in catching moves efficiently 🎯
Oversupply risk + weak demand = bearish fuel 🔥
Retail & institutions both leaning short-side heavy 🐻
🔍 Market Analysis (Technical + Fundamental + Macro + Sentiment)
📊 Real-Time Price Action - Sep 05
Daily Change: -1.03%
Monthly Change: -2.84%
Yearly Change: -8.44%
😊 Retail & Institutional Sentiment
Retail Traders: 35% 🐂 | 55% 🐻 | 10% 😐
Institutional Traders: 30% 🐂 | 60% 🐻 | 10% 😐
🌡️ Fear & Greed Index
Current: 25/100 — Fear 😟
Mood: Cautious, driven by oversupply fears + weak demand
⚒️ Fundamental Score: 40/100 (Bearish)
U.S. crude inventories unexpectedly +2.42M vs. -2.19M expected 📈
OPEC+ considering production increase 🌍
Weak China demand signals 📉
🌐 Macro Score: 35/100 (Bearish)
Fed rate cut expectations (25bp likely in September) 💸
Global slowdown fears 🌎 (Europe + Asia weak data)
Geopolitical risks (Russia-Ukraine) limited impact 🚨
🏁 Overall Market Outlook: Bearish (Short Bias) 🐻
Declining prices + rising inventories + OPEC+ supply hike risk
Technicals = Strong Sell (daily/weekly)
Sentiment favors sellers across the board
🔮 Key Takeaway
WTI/USOIL remains heavy under supply pressure + demand weakness.
Market sentiment is fearful, with both retail & institutions leaning short.
⚡ Keep eyes on U.S. jobs data + OPEC+ decisions for any trend shifts.
📌RELATED PAIRS TO WATCH
BRENT CRUDE ( TVC:UKOIL ): $66.42 (-1.8% daily)
NATURAL GAS ( FX:NGAS ): $2.84 (-0.7% daily)
ENERGY ETFS: XLE, USO, UCO
OANDA:CADJPY : Oil-correlated currency pair
ENERGY STOCKS: NYSE:XOM , NYSE:CVX , NYSE:COP , NYSE:SLB
✨ “If you find value in my analysis, a 👍 and 🚀 boost is much appreciated — it helps me share more setups with the community!”
#USOIL #WTI #CrudeOil #ThiefTrader #EnergyMarkets #Commodities #OPEC #SwingTrade #DayTrade #OilAnalysis

Short OilI don't trust it man. It's just a bunch of black liquid. It's messy too. It gets on the oceans. The turtles have to drink it. Ask the turtles, they'll also short it.
No but really it's overbought, it's time for a retrace, and $70 looks like good support.

OIL PRICE IS RISING!Oil price currently trade at $62.4 per barrel. I anticipate further rise in. My target profit is at $64 and $64.5 level. This is a potential buy trade which I believe it has a good probability.
Technically, we can spot equal lows from the H4 timeframe which is a bullish signal.

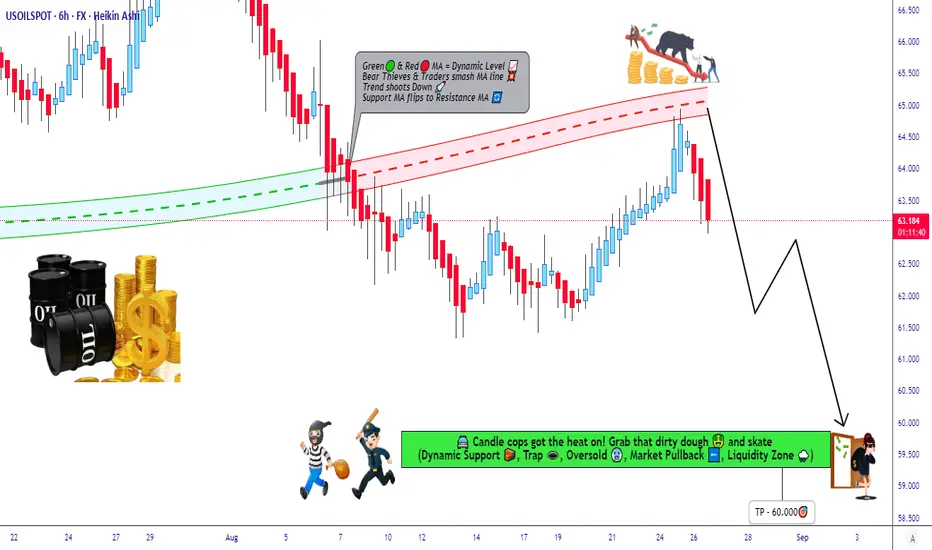
USOil Bear Trap Set: Ready For The Downside Raid?🛢️ WTI Oil Bearish Heist Plan 💣 | Thief Trader Layers Activated 🔐
💥 Welcome to the vault raid, Thief OG’s! 💥
We’re targeting US Oil Spot / WTI (XTIUSD) — and this time, the plan is pure Bearish robbery.
🚨 The Robbery Setup:
This isn’t just a sell — it’s a layered ambush. We place traps, let bulls walk in, and then we rob clean.
📌 Thief Entry Plan (Limit Layers):
Sell Limit @63.000
Sell Limit @63.500
Sell Limit @64.000
Sell Limit @64.500
👉 You can stack more layers if the vault door keeps opening.
🛑 Thief Stop Loss:
SL locked @65.500 🔒
⚠️ Adjust your SL like a true Thief — according to your risk + number of layers.
🎯 Escape Plan (Target):
🚔 Police barricade spotted around 59.000.
📌 Official Heist Exit: 60.000 — grab the loot before the cops arrive.
🧠 Thief Strategy Logic:
Multi-layer sell ambush 🏴☠️
Bearish pressure from supply + demand shifts 📊
Technical rejection zones aligning with macro weakness 📉
⚠️ Risk Management Note:
Thieves don’t rush!
👉 Place alerts before the raid.
👉 Don’t dump blind orders — wait for price to approach layers.
👉 Manage your position like a stealth operation, not a casino gamble.
💬 Thief Community Code:
Smash ❤️ & Boost if you’re with the robbery crew.
Drop your charts + sniper entries below.
We rob together. We win together. 🏆
🔔 Stay locked in — more heist plans dropping soon.
💰 Rob Smart. Trade Sharp. Exit Clean.
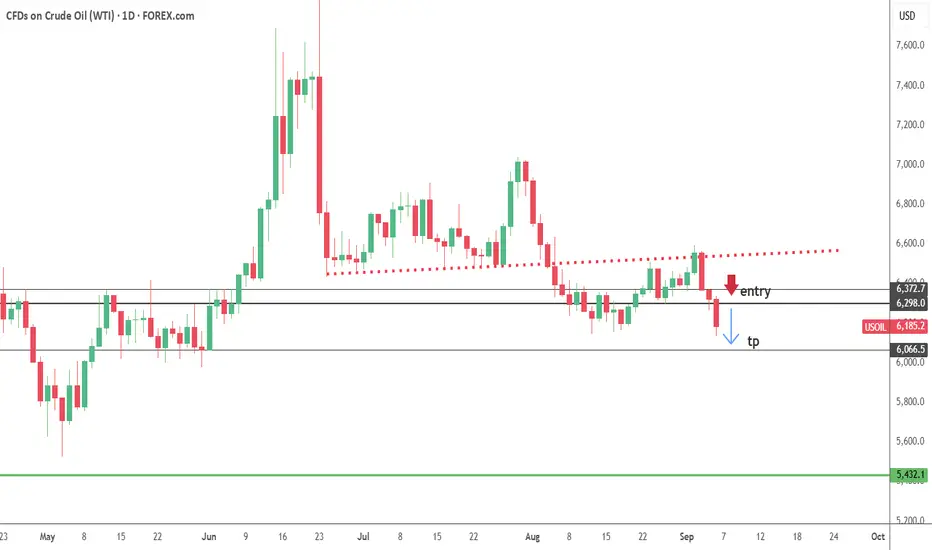
USOIL--SHORT--monthly bearish
--weekly bearish
--daily bearish
--tp and entry levels are as shown on chart
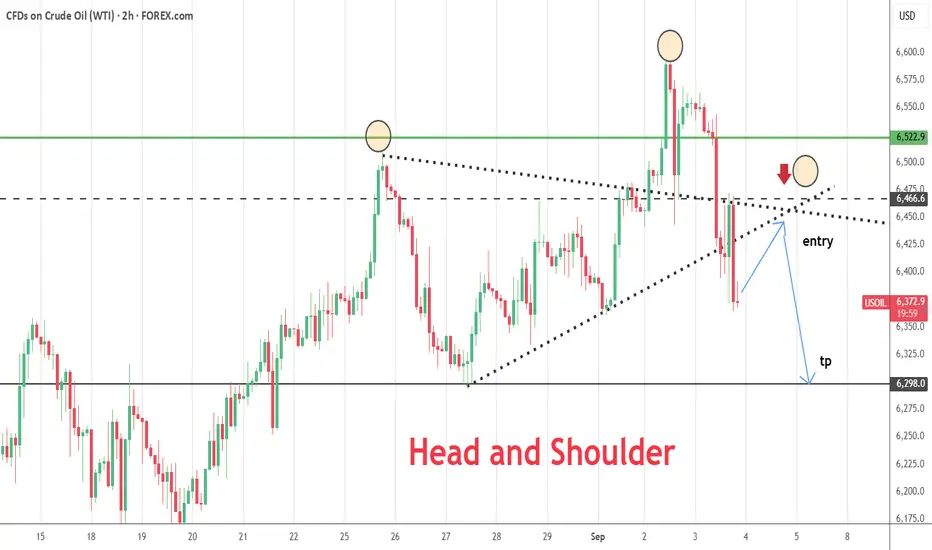
USOIL--Head and Shoulder--Head and shoulder is about to form.
--entry and tp levels are shown on chart
WTI Surges Above 65$ ResistanceCrude oil is currently supported by a combination of energy sanctions, geopolitical tensions, and rate cut expectations — with price action eyeing the $70 barrier as long as it holds above $65.20.
WTI maintained its rebound above the 61.80–62.00 support zone — aligning with the neckline of the previous inverted head and shoulders formation — and has broken above the 65 resistance level, signaling a potential continuation of bullish momentum. Daily RSI has also moved above the neutral 50 level, further confirming upside momentum.
• A clean hold above 65.20 may extend the rally toward 68.00, 69.40, and 70.40 — the next major resistance levels.
• On the downside, 62.00 and 61.80 remain key support levels. A break below them could expose oil to deeper losses toward 59.40 and 57.90.

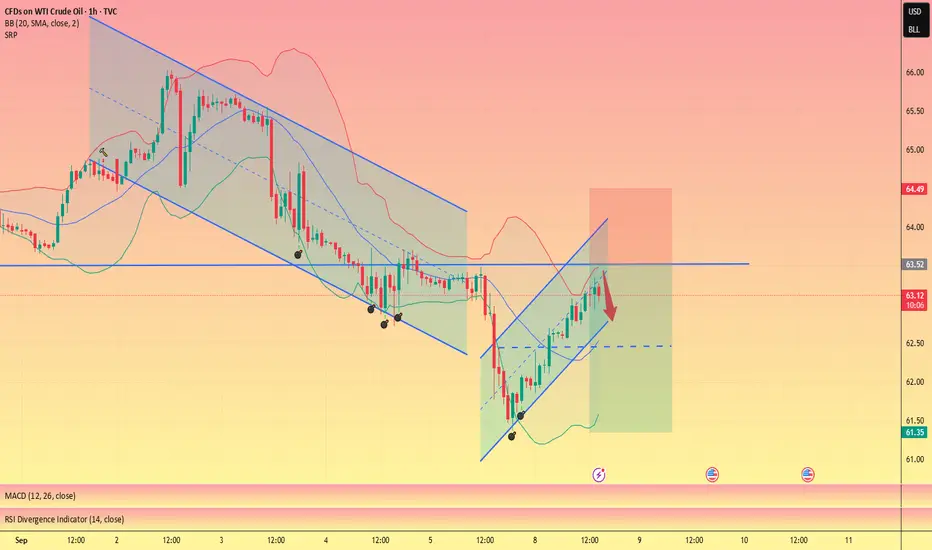
Please follow usoil's accurate buy and sell signals.usoil is currently experiencing a continuous rebound on the 4-hour chart. The price has subsequently reached a previous resistance zone. The hourly chart is currently in a narrow range of correction. The short-term rebound is almost complete.
Signal Recommendations:
1. Sell short at resistance level 63.4-63.8, target 62.3-61.8
2. Buy at support level 61.5-60.7, target 62.3-62.8
Trading involves risk. Profit and loss are controlled by the trader.
I hope that every accurate signal can help every independent trader and make trading profitable easier.


USOIL latest trend analysis and operation layout#USOIL
Crude oil continued to rebound in the European session, but the short-term 4H moving average was still pressing downward, and it was obvious that the short-selling momentum had not completely subsided. The overall trading rhythm is mainly based on rebound shorting. The short-term upper resistance level is 63.5-64.5. If it fails to break through effectively, crude oil will usher in a retracement, with the target looking at 62.5-61.5
🚀 SELL 63.5-64.5
🚀 TP 62.5-61.5