USOIL Bearish swing tradeEntry from last higher low breakout
RRR 1:2
overall in bearish momentum
have touch it's major support zone before going up
Trade ideas

Crude Oil Trading Strategy for TodayInventory data validates the short-term demand resilience: The U.S. EIA data shows that the crude oil inventory decreased by 960,000 barrels on a week-on-week basis as of October 17th, with the decline exceeding market expectations. At the same time, the gasoline inventory also decreased simultaneously, alleviating concerns about weak demand. The unexpected decline in inventories coincided with geopolitical benefits, driving speculative funds to quickly enter the market to repair the previously oversold situation.
Price patterns exhibit rebound momentum: Since October 17th, WTI crude oil has risen by more than 8% in the past three trading days, closing at $61.68 on October 24th, forming a "bottom-up volume-driven rebound" pattern; the main contract of Shanghai crude oil also rose significantly, with the closing price on October 24th rising by 6.7% compared to the low point on October 20th, and the trading volume has continuously expanded for three consecutive days, indicating a rapid accumulation of buying power.
Crude Oil Trading Strategy for Today
usoil @ buy 61-61.5
tp:62-62.5
SL:60

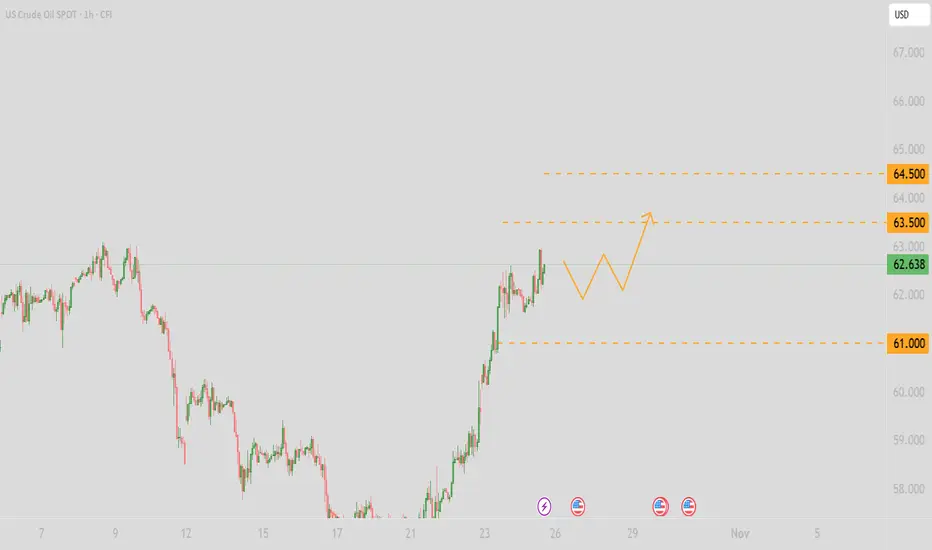
USOIL: Go long on pullbacksGeopolitical risks have dominated short-term market sentiment for crude oil. Investors' concerns about the supply side have overshadowed negative factors on the demand side, driving oil prices to rise consecutively. However, the weak global economy has dimmed the long-term demand outlook, limiting the extent of oil price increases, resulting in relatively complicated overall market sentiment.
From a technical indicator perspective, momentum indicators are showing positive signals, and the MACD is trending upward. This indicates that the bullish bias is strengthening, but a fully established uptrend has not yet formed.
Overall, technical indicators point to a certain bullish tendency, though it is also necessary to monitor the price performance at key resistance levels.
In the short term, focus on the resistance range of 63.5–64.5 on the upside and the support range of 60–61 on the downside. For intraday operations, the main strategy is to go long on pullbacks, with short positions on rebounds as a supplementary approach.
💎Trading Strategy:
Buy 61.8 SL 62.4 TP 61.1
Daily-updated accurate signals are at your disposal. If you run into any problems while trading, these signals serve as a reliable reference—don’t hesitate to use them! I truly hope they bring you significant assistance
USOIL: Waiting for price to react to 4h resistance
* Trend: assessed using at least three trend indicators, with market structure as the primary guide.
** Weak or Reversal Signals: Assessed based on one of our criteria for trend reversal signals.
*** Support/Resistance: Selected from multiple factors – static (Swing High, Swing Low, etc.), dynamic (EMA, MA, etc.), psychological (Fibonacci, RSI, etc.) – and determined based on the trader’s discretion.
**** Our advice takes into account all factors, including both fundamental and technical analysis. It is not intended as a profit target. We hope it can serve as a reference to help you trade more effectively. This advice is for informational purposes only and we assume no responsibility for any trading results based on it.
George Vann @ ZuperView
Crude oil shows an optimistic upward trend📈The situation of crude oil is relatively optimistic, showing an upward trend, mainly affected by geopolitics and supply-demand relationships.
💡Geopolitical factors:
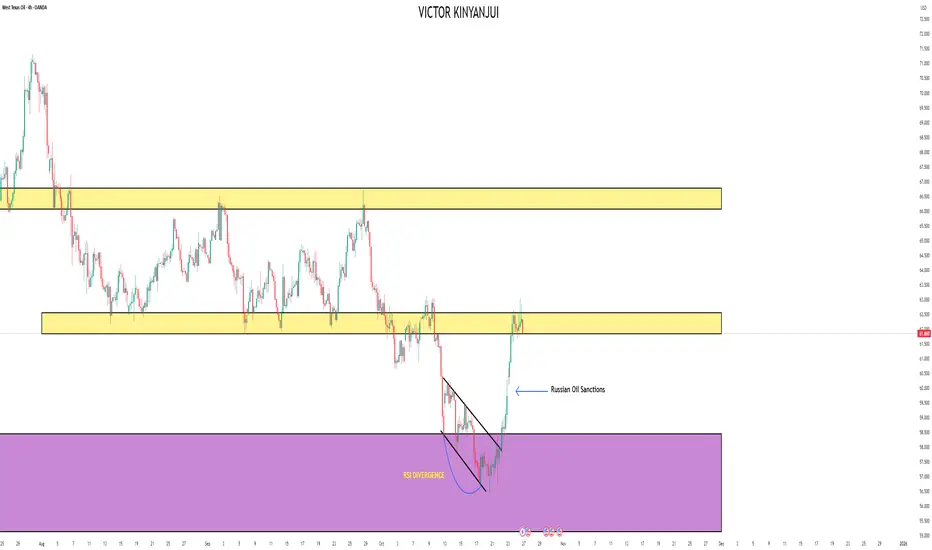
The United States has imposed sanctions on Russian oil companies, and the European Union's sanctions against Russia are also continuing. At the same time, the news that the United States intends to take military action against Venezuela has fermented, triggering market concerns about disruptions in crude oil supply and boosting oil prices.
💡Supply-demand factors:
On the one hand, OPEC announced at a new round of meetings that it would continue to increase production by 137,000 barrels, but the scale of production increase is relatively small, and the production increase capacity of some oil-producing countries is limited, which alleviates the pressure of oversupply. On the other hand, as of October 17th, the EIA crude oil inventory data decreased by 960,000 barrels, the gasoline inventory decreased by 21.05 million barrels per day, and the distillate oil inventory decreased by 1.48 million barrels per day. The decrease in inventory has provided some support for oil prices. However, the weakness of the global economy has made the long-term demand outlook bleak, which has suppressed the increase in oil prices to a certain extent.
💡Technical analysis:
From the daily line level, the daily K-line shows a trend of breaking below the previous low point and then recovering, and the weekly K-line forms a rising sun pattern, indicating that there is a possibility of continued rebound in prices in the short term. At the same time, the medium-term indicator MACD supports an upward trend, also indicating that the short-term trend is upward.
💎Trading Strategy:
Buy 60 SL 61.5 TP 59
Daily-updated accurate signals are at your disposal. If you run into any problems while trading, these signals serve as a reliable reference—don’t hesitate to use them! I truly hope they bring you significant assistance

Crude oil trading strategy for today.,Hope it is helpful to yoFactors That May Drive Up Crude Oil Prices (Bullish Logic)
1.Breakthrough in trade negotiations: If China and the United States reach a consensus at the summit to ease trade frictions, the global cargo transportation and economic outlook will improve, which may increase the demand for crude oil.
1.Unexpected geopolitical tensions: Although the Gaza conflict has ended, the situation between Russia and Ukraine remains unresolved. If further unrest breaks out in the Middle East or Eastern Europe, it may disrupt crude oil transportation. The market will worry about a shortage of oil supply, leading to a rise in oil prices.
1.Demand for technical rebound: Oil prices have dropped significantly from their previous highs, so a "short - term oversold rebound" may occur in the near future. Just like a ball bouncing back up after hitting the ground, some funds will take the opportunity to buy (and push up oil prices).
Crude Oil Trading Strategy for Today
usoil @buy57.50-58.00
pt:58.50-59
sl:57

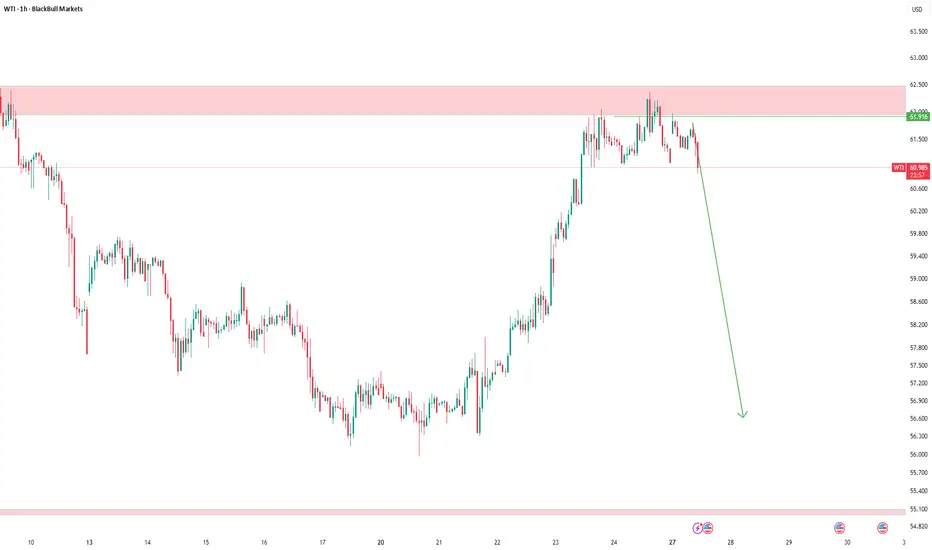
USOIL WILL FALL|SHORT|
✅CRUDE OIL/b] after engineering liquidity above the recent high, price reacted sharply from the 4H supply area, suggesting distribution by institutional players. With buy-side liquidity swept, the market now looks poised to rebalance inefficiency below the $61 handle. Time Frame 4H.
SHORT🔥
✅Like and subscribe to never miss a new idea!✅

WTI Crude Oil – Update
I’ve entered a short position around this zone.
I don’t predict the market — I just follow opportunities.
It doesn’t matter what happens after entry; I simply follow my plan.
Those who’ve been following me know my system:
At a 1:1 reward, I close half of my position — that means zero risk.
If the market reverses and hits my stop, I lose nothing.
If it keeps moving, I use a trailing stop to catch as much of the move as possible.
That’s what real position management looks like.
And if my level breaks, I don’t just sit and watch — I’ll go long with the market.
I don’t predict or guess the future;
I trade with discipline, patience, and respect for the market.
I’m a trader, not a fortune teller.
Upward trend in oilThe price of very clean oil reacted to the specified range and started an upward trend. We expect either the upward trend to continue or the price to correct and resume its upward movement from the specified range.

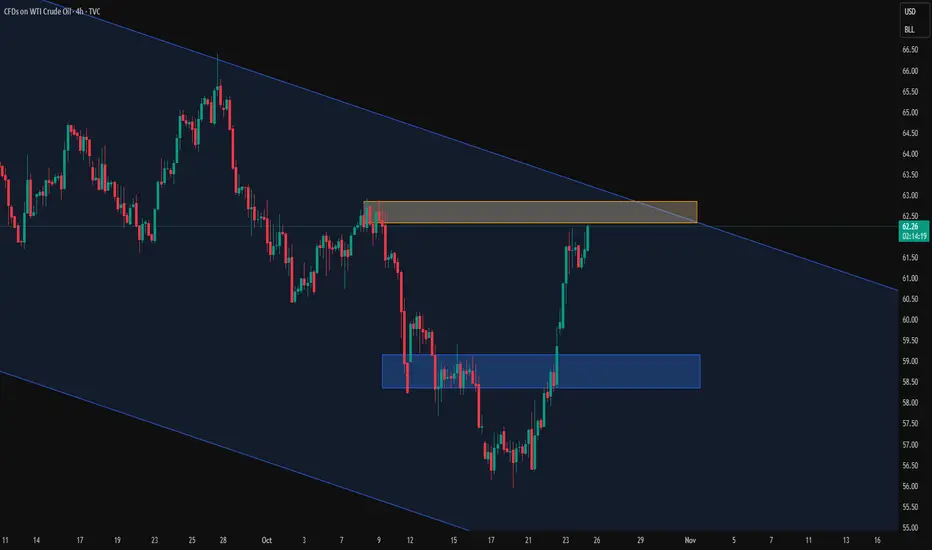
USOIL Double Top at Support Level Turned Resistance Zone.Price bounce back from a major Monthly support Level at (58.450 - 55.130), price rallied strongly to the next support level turned resistance at (62.550 - 61.835) and was strongly rejected with a double top followed by bearish engulfing candle presenting a good follow through selling the coming week.
USOIL SENDS CLEAR BEARISH SIGNALS|SHORT
USOIL SIGNAL
Trade Direction: short
Entry Level: 61.42
Target Level: 58.17
Stop Loss: 63.58
RISK PROFILE
Risk level: medium
Suggested risk: 1%
Timeframe: 6h
Disclosure: I am part of Trade Nation's Influencer program and receive a monthly fee for using their TradingView charts in my analysis.
✅LIKE AND COMMENT MY IDEAS✅

USOIL BULLS ARE STRONG HERE|LONG
USOIL SIGNAL
Trade Direction: short
Entry Level: 57.23
Target Level: 59.72
Stop Loss: 55.57
RISK PROFILE
Risk level: medium
Suggested risk: 1%
Timeframe: 12h
Disclosure: I am part of Trade Nation's Influencer program and receive a monthly fee for using their TradingView charts in my analysis.
✅LIKE AND COMMENT MY IDEAS✅

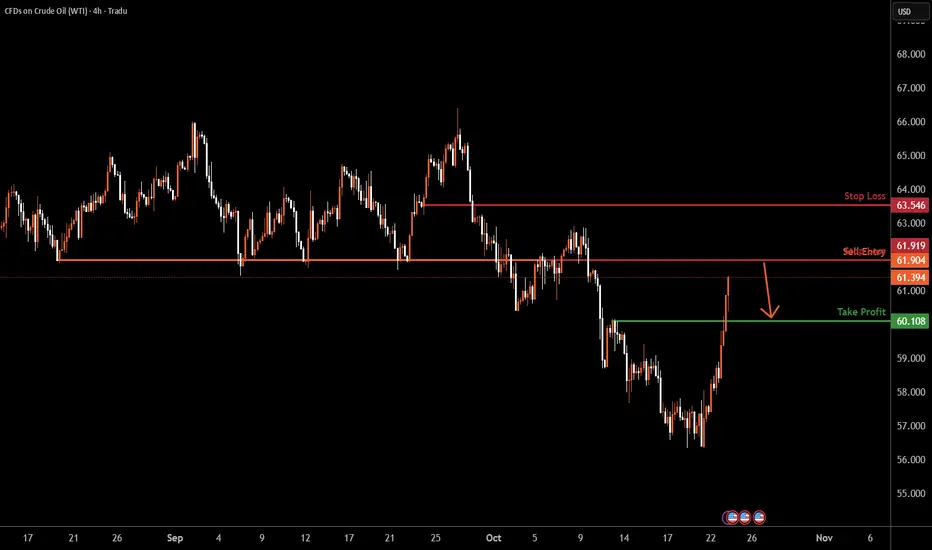
USOIL H4 | Approaching Major Resistance LevelBased on the H4 chart analysis, we could see the price rise to the sell entry which is an overlap resistance and could reverse from this levle to the take profit.
Sell entry is at 61.90, which is an overlap resistance.
Stop loss: 63.54, which is a pullbakc resistance.
Take profit is at 60.10, which is a pullback support.
Stratos Markets Limited (tradu.com ):
CFDs are complex instruments and come with a high risk of losing money rapidly due to leverage. 68% of retail investor accounts lose money when trading CFDs with this provider. You should consider whether you understand how CFDs work and whether you can afford to take the high risk of losing your money.
Stratos Europe Ltd (tradu.com ):
CFDs are complex instruments and come with a high risk of losing money rapidly due to leverage. 70% of retail investor accounts lose money when trading CFDs with this provider. You should consider whether you understand how CFDs work and whether you can afford to take the high risk of losing your money.
WTI Crude oversold bounce capped at 6030 resistanceThe WTI Crude Oil is currently trading with a bearish bias, aligned with the broader downward trend. Recent price action shows a retest of the longer term support, suggesting a temporary relief rally within the downtrend.
Key resistance is located at 6030, a prior consolidation zone. This level will be critical in determining the next directional move.
A bearish rejection from 6030 could confirm the resumption of the downtrend, targeting the next support levels at 5747, followed by 5677 and 5606 over a longer timeframe.
Conversely, a decisive breakout and daily close above 6030 would invalidate the current bearish setup, shifting sentiment to bullish and potentially triggering a move towards 6073, then 6170.
Conclusion:
The short-term outlook remains bearish unless the WTI Crude price breaks and holds above 6030. Traders should watch for price action signals around this key level to confirm direction. A rejection favours fresh downside continuation, while a breakout signals a potential trend reversal or deeper correction.
This communication is for informational purposes only and should not be viewed as any form of recommendation as to a particular course of action or as investment advice. It is not intended as an offer or solicitation for the purchase or sale of any financial instrument or as an official confirmation of any transaction. Opinions, estimates and assumptions expressed herein are made as of the date of this communication and are subject to change without notice. This communication has been prepared based upon information, including market prices, data and other information, believed to be reliable; however, Trade Nation does not warrant its completeness or accuracy. All market prices and market data contained in or attached to this communication are indicative and subject to change without notice.

WTI OIL OIL DEFENDED 56$-55$ ZONE ,THE NEXT TECHNICAL BUY POSITION WILL BE 60.79$-61$ ,IF THE LAYER IS RESPECTED I WILL HOLD BUY TILL WE BREAKOUT OF 62.188$ PER BARREL hoping to challenge the long term descending trendline holding price as supply roof and dynamic resistance to upswing.
buy target could exceed 66.219-65.567$
WTI (West Texas Intermediate) crude oil is a major benchmark for oil prices, representing light, sweet crude oil primarily produced in the U.S. It is widely used globally to price various grades of crude oil.
As of late October 2025, WTI crude oil prices have been trading around $61.745 per barrel. The recent price movement reflects several fundamental factors:
Supply Constraints: Ongoing production cuts by OPEC+ members and U.S. sanctions on key oil-producing countries are tightening supply, supporting prices.
Demand Dynamics: Global economic concerns, including slowing growth in major economies, have weighed on demand outlook, causing price volatility.
Inventory Levels: U.S. crude inventory data and storage capacity utilization have affected market sentiment with fluctuating stockpile levels.
Geopolitical Risks: Tensions in the Middle East and trade uncertainties continue to keep risk premium in prices.
Energy Transition Policies: Shifts toward renewable energy and emission reduction targets are influencing longer-term demand forecasts.
In summary, WTI prices near $61-62$ are driven by a mix of supply discipline, cautious demand outlook, and geopolitical uncertainties, creating a balanced but volatile oil market environment
This fundamental backdrop suggests that price action in WTI will remain sensitive to OPEC+ decisions, U.S. economic data, and geopolitical developments.
#USOIL #WTI #OIL #UKOIL

US OIL SUPPORT, RESISTANCE & TRENDLINE ANALYSISThe market is sideways kindly save your capital yall.
Go "long" if it breaks the trendline and 57.45 and aim for 57.80 and 58.14 and if it breaks 58.37 then we might see a good move upside.
Go "Short" if it breaks below 57.12 and breaking the trendline as well will lead to 56.77 and 56.43.
Good Night!!

XTI/USD Chart Analysis: Oil Prices Fall to Yearly LowsXTI/USD Chart Analysis: Oil Prices Fall to Yearly Lows
As shown on the XTI/USD chart, WTI crude is trading below $57 today, with the 2025 low sitting near $55. Several factors are currently weighing on oil prices:
→ Uncertainty surrounding the US-China trade deal — the world’s two largest oil consumers — continues to cloud the outlook for global growth and crude demand.
→ Increased output from OPEC+ members has added further pressure, with the IEA last week raising its forecast for a global oil surplus.
→ A decline in the risk premium following the peace agreement in the Middle East has also reduced support for oil prices.
So, what could happen next?
Technical Analysis of the XTI/USD Chart
Seven days ago, we noted that:
→ In the long-term context, oil price fluctuations — following the June escalation in the Middle East — have formed a downward channel (shown in red). The current price has now slipped below its lower boundary.
→ In the short term, the pace of the decline appears to be accelerating, highlighted by the purple trajectory lines.
At that time, we suggested a scenario in which WTI could drift towards its yearly low near $55, which is now materialising. However, note the following:
→ The RSI indicator is hovering near oversold territory.
→ The chart shows signs of a Falling Wedge pattern, which often precedes a bullish reversal.
Given these signals, it is reasonable to assume that, after a roughly 10% decline since the start of the month, bears may begin locking in profits on short positions. This could trigger a technical rebound in WTI prices — potentially towards the resistance area defined by:
→ The lower boundary of the red channel;
→ The psychological level of $60;
→ The median line of the purple channel.
This article represents the opinion of the Companies operating under the FXOpen brand only. It is not to be construed as an offer, solicitation, or recommendation with respect to products and services provided by the Companies operating under the FXOpen brand, nor is it to be considered financial advice.

19.10.25 Crude Oil WeeklyOil is about to approach the Weekly Demand Zone
Weekly (Higher Time Frame)
The Weekly Demand have 3 basing candle's: the Basing candle are so small it means price have been in balance til the buy pressure came in.
Also you the Demand zone was formed in a previously Supply zone. It means Supply became Demand (flip zone) and can indicate an uptrend.
Daily ( Lower Time Frame)
We are Having An Level on top of Level situation. Both level are covered in from Higher time frame. i will use both levels as my risk zone.
In the moment i reach twice profit of my risk i will move my stoplose to breakeven.
When we reach the first strong Supply i take of 75% of profit and let run the other 25% and trail my stoplose

Crude Oil Approaches End of Elliott Wave PatternAbove, is the video review for Crude Oil.
Taking a look at the longer perspective, a multi-year ending diagonal pattern is nearing its end.
The weekly chart for TVC:USOIL suggests the decline is wave 5 of a 5-wave diagonal. The 61% Fibonacci retracement level sits near $49. We're anticipating a bullish reversal between current prices and $49 to carry up to new all-time highs over the coming years.
Looking at a clusters of wave relationships and market geometry, I'd like to see Crude Oil reach the yellow box and punch new lows, but it doesn't have to.
If prices fall further, then the 61% Fib level at $49 may provide support.

USOIL Near Final Leg USOIL is forming a clear corrective pattern inside a falling channel. Price is currently in the final leg of wave (5) of (C), suggesting one more dip is likely before reversal.
The downside target lies near 5,000–5,200 , where support from the channel base aligns. Once this level holds, a strong bullish reversal is expected, marking the end of the correction and the start of a new upward trend.
Stay Tuned!
@Money_Dictators :)

Hellena | Oil (4H): SHORT to support area of 56-57.Colleagues, price is actively moving in a downward direction and I believe the move is not yet complete.
Earlier I saw this move as a big correction, but now the structure is more of an impulsive one. This means that the price is moving in the wave “3” of the higher order (Red), which should be completed soon.
For this to happen, the price needs to complete the correction in the wave “4” of medium order and then update the low, reaching the support area of 56-57.
The extension of wave “3” is possible - then the price will reach the target without correction.
Fundamental context
Global oil inventories are forecast to rise through 2025, putting downward pressure on prices despite efforts by some producers to restrain output.
OPEC+ has been increasing production again, which adds to the supply burden.
Meanwhile, demand forecasts have been trimmed amid softer economic growth indicators in key consuming regions.
Major banks have lowered long-term price expectations for crude — the balance is tilting toward a more bearish outlook.
Manage your capital correctly and competently! Only enter trades based on reliable patterns!

Crude Oil Outlook: Pressure Mounts as 2025 Lows Come Into ViewCrude oil prices are tracing another plunge back to yearly lows amid mounting oversupply, weak demand, and tariff concerns. New 2025 lows may be reached in the short-term horizon, aligning with the lower boundaries of a 3-year down trending channel
From a weekly time frame perspective, crude oil is facing the lower border of a three-year descending channel extending from the 2022 highs. The $55 support currently holds as the 2025 low, but a clean break below it could extend losses toward the $49 zone, aligning with the channel’s bottom boundary — a potential area of support. If this level fails, a deeper selloff could extend toward the $37 region.
On the upside, should prices recover above the $58 mark, a bullish rebound may extend toward $60, $63, and $66, respectively. However, for a sustainable bullish outlook on crude, a breakout above both the three-year downtrend and the $70 resistance is required.
Looking closely at the daily RSI, it is nearing oversold levels last seen in April 2025, suggesting that downside momentum could be approaching exhaustion.
In line with the recent movements of U.S. indices, will we see another dip-and-rebound scenario on crude oil — not identical, but perhaps reminiscent of April 2025?
- Written by Razan Hilal, CMT

WTI crude oil Wave Analysis – 17 October 2025
- WTI crude oil reversed from strong support level 56.00
- Likely to rise to resistance level 58.00
WTI crude oil recently reversed from the support area between the strong support level 56.00 (which reversed the price in April and May, as can be seen below) and the lower daily Bollinger Band.
This support area was further strengthened by the support trendline of the daily down channel from August.
Given the strength of the support level 56.00 and the oversold daily Stochastic, WTI crude oil can be expected to rise to the next resistance level 58.00.
