WTI Crude Oil Forms Major Head and Shoulders BreakdownHi guys.
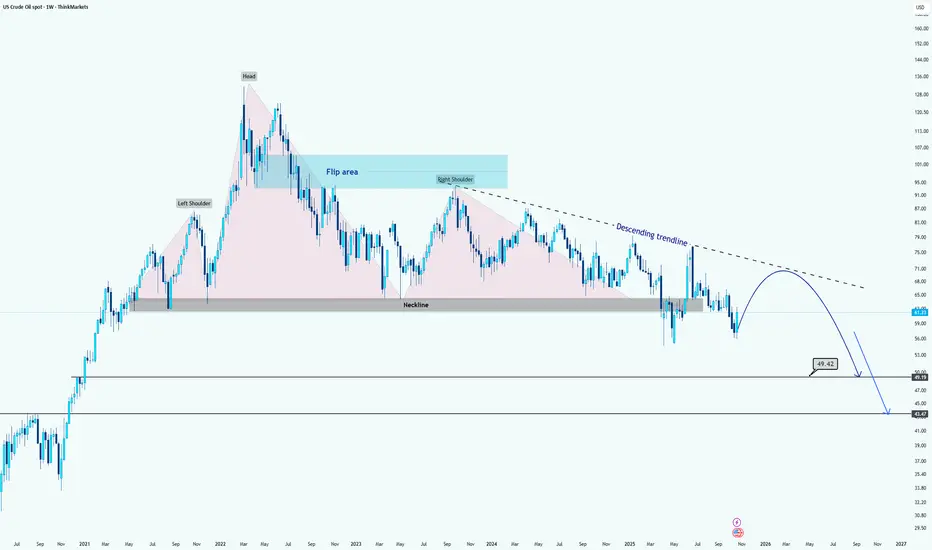
WTI has formed a massive Head and Shoulders pattern on the weekly timeframe, signaling a potential long-term bearish reversal structure.
After the right shoulder completed, price decisively broke below the neckline around the $67–$70 range, confirming the pattern breakdown. This neckline now acts as a major resistance zone and aligns closely with the descending trendline, adding confluence to the bearish bias.
The recent rebound appears to be a corrective pullback toward the neckline or flip area, before potentially continuing to the downside. As long as WTI remains below the descending trendline and neckline zone, bearish momentum is expected to dominate.
The projected measured move target from the pattern suggests two possible support objectives:
First target: around $49.40, corresponding to prior consolidation and structural support.
Final target: near $43.40, aligning with historical demand and the full measured move projection from the Head and Shoulders formation.
Overall, unless WTI reclaims and sustains above the $70 area, the medium- to long-term bias remains bearish, with corrective rallies likely to face selling pressure.
Disclaimer: As part of ThinkMarkets’ Influencer Program, I am sponsored to share and publish their charts in my analysis.
Trade ideas
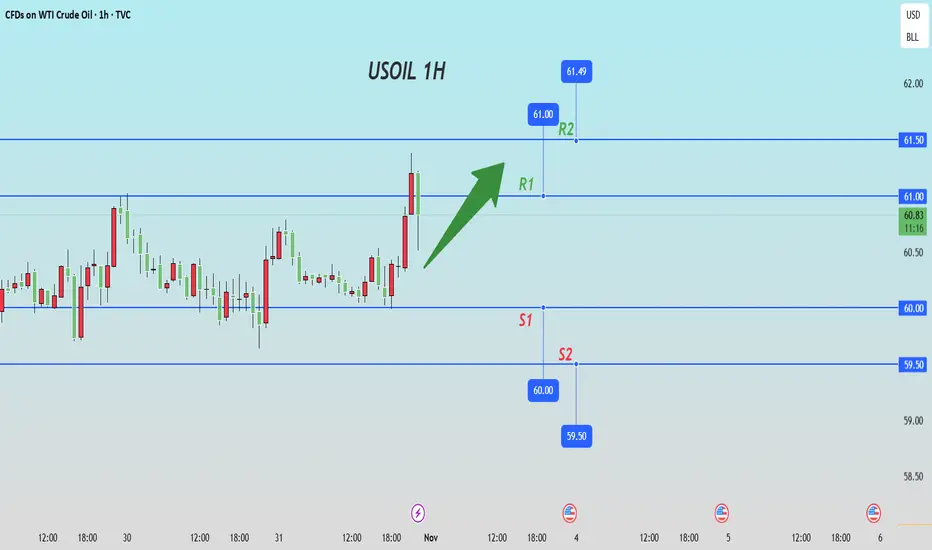
USOIL Symmetrical triangle buying from key support📊 USOIL Update (1H Timeframe)
🟢 Symmetrical Triangle Breakout Setup!
Price holding strong at the key support zone – $60.000 ✅
🎯 Technical Targets:
1️⃣ $60.800
2️⃣ $61.800
3️⃣ $62.400
🧭 Plan:
Looking for buying opportunities from the support zone as long as $60.000 holds.
⚠️ Risk Management is Key!
Always use proper SL and position sizing 🔐
💬 Like ❤️ | Follow 🔔 | Comment 💭 | Share 📢
#USOIL #CrudeOil #WTI #TechnicalAnalysis #PriceAction #ForexTrading #CommodityMarket #TradingSetup

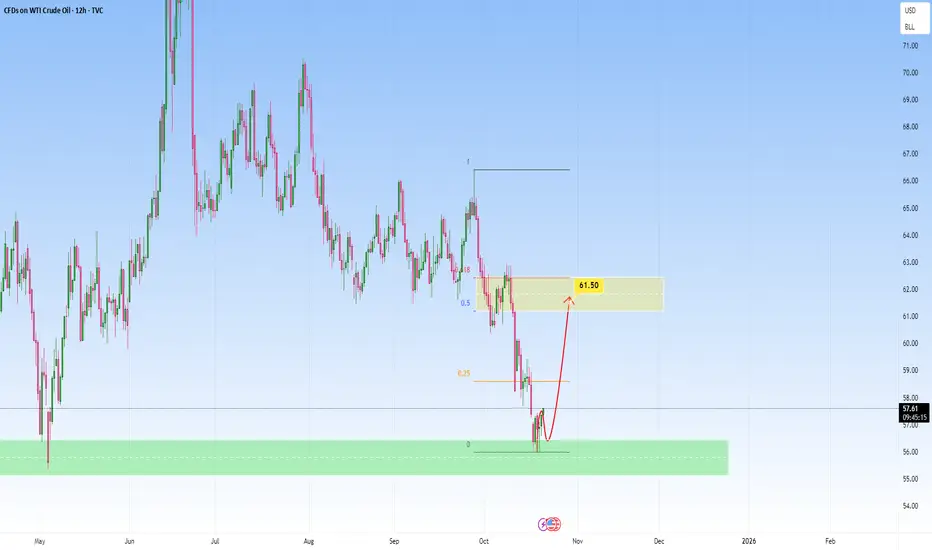
Oil: Key Fibonacci Zone to watch forPrice has been in a clear downtrend, with sellers firmly in control, driving a series of lower lows and lower highs. However, after a strong bearish leg, momentum began to slow, candles started showing long wicks and smaller bodies, signaling that selling pressure might be fading.
If price continues upward, the $61.50 region becomes a crucial zone. A strong rejection from there would confirm that sellers are reloading for another push down.
In short, this is a Fibonacci retracement move within a broader downtrend.
Can WTI’s 8% Rally Hold After Trump-Putin Summit Collapse?WTI just staged its biggest two-day rally since June, as hopes for a Trump-Putin summit were dashed, leading to new US sanctions on Russian oil exports.
Here’s what’s fuelling the move and what traders should watch next:
- US sanctions on Russia’s top oil producers after failed Budapest summit trigger supply fears and spike prices
- Trump escalates rhetoric to maintain leverage as Zelensky signs military deals with Sweden, raising geopolitical stakes
- WTI reclaims key $61 resistance, with daily RSI momentum signalling room to run and a possible cup & handle breakout toward $68
- Supply glitch fears (India, OPEC’s slow reaction) and technicals all support continued upside if the current environment holds
Watch for buy the dip signals, respect $61 support, and target the $65–68 channel top if current drivers persist.
Stay tuned!
This content is not directed to residents of the EU or UK. Any opinions, news, research, analyses, prices or other information contained on this website is provided as general market commentary and does not constitute investment advice. ThinkMarkets will not accept liability for any loss or damage including, without limitation, to any loss of profit which may arise directly or indirectly from use of or reliance on such information.

USOIL: Bears Are Winning! Short!
My dear friends,
Today we will analyse USOIL together☺️
The in-trend continuation seems likely as the current long-term trend appears to be strong, and price is holding below a key level of 61.394 So a bearish continuation seems plausible, targeting the next low. We should enter on confirmation, and place a stop-loss beyond the recent swing level.
❤️Sending you lots of Love and Hugs❤️

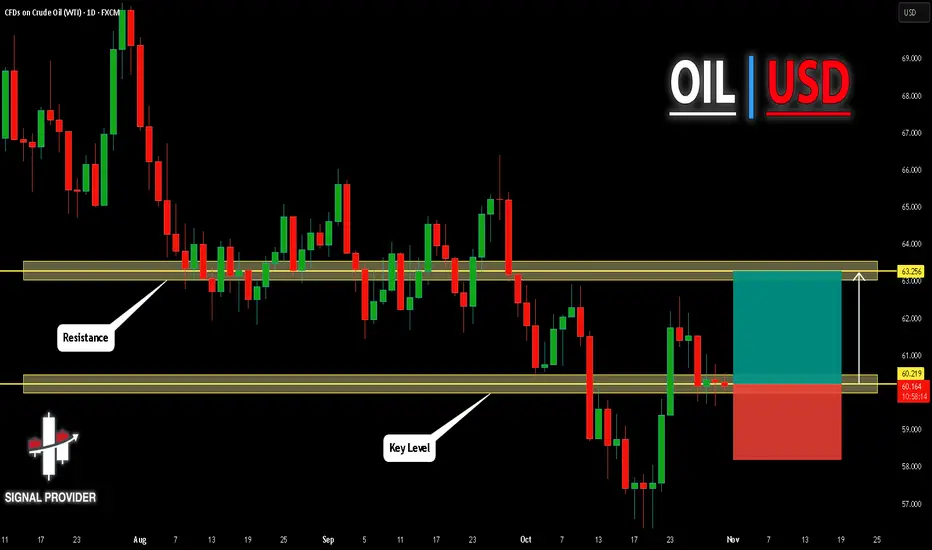
USOIL Is Very Bullish! Long!
Please, check our technical outlook for USOIL.
Time Frame: 1D
Current Trend: Bullish
Sentiment: Oversold (based on 7-period RSI)
Forecast: Bullish
The market is approaching a significant support area 60.219.
The underlined horizontal cluster clearly indicates a highly probable bullish movement with target 63.256 level.
P.S
Please, note that an oversold/overbought condition can last for a long time, and therefore being oversold/overbought doesn't mean a price rally will come soon, or at all.
Like and subscribe and comment my ideas if you enjoy them!
WTI OIL Strong long-term rebound incoming.Over a month ago (September 17, see chart below), we gave a strong Sell Signal on WTI Oil (USOIL) as the price was again rejected on its 1W MA50 (blue trend-line) and was headed towards the inner Higher Lows trend-line, easily hitting our $59.50 Target in the process:
Yet again we consult the more reliable long-term time-frames, now making a bullish call as the price is already rebounding this week on the Higher Lows. Given also the identical 1W RSI pattern with 2023, we expect a bounce towards at least the 0.618 Fibonacci retracement level at $69.50, same as the December 2023 - March 2024 rally.
-------------------------------------------------------------------------------
** Please LIKE 👍, FOLLOW ✅, SHARE 🙌 and COMMENT ✍ if you enjoy this idea! Also share your ideas and charts in the comments section below! This is best way to keep it relevant, support us, keep the content here free and allow the idea to reach as many people as possible. **
-------------------------------------------------------------------------------
💸💸💸💸💸💸
👇 👇 👇 👇 👇 👇

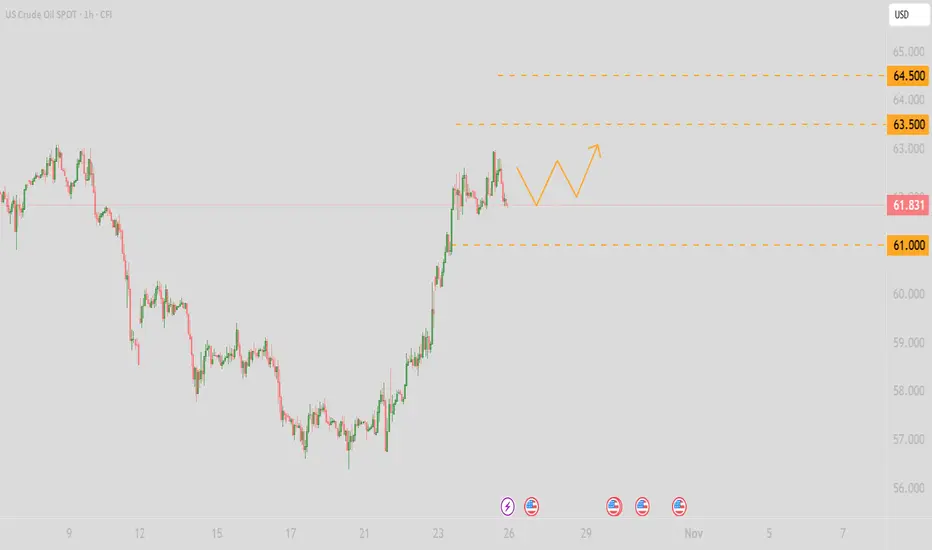
Will oil continue to rise? Yes, definitely.
Hi my Dears
Following recent trade policies, it seems that there is still room for oil to grow and we should see oil prices rise. The first price target we can hope for is $63.
Do you think it could happen?

WTI OIL 1D MA50 rejection. Sell Signal.Last time (October 14, see chart below) we took a look on WTI Oil (USOIL), we gave a Buy Signal right at the bottom of its 3-month Channel Down, which eventually hit our 62.00 Target:
This time we have a Sell Signal as the price and the Channel's Bullish Leg got rejected on its 1D MA50 (blue trend-line). When that happened in September, the market started to decline and reached its lower Support.
As a result, we expect Oil to turn bearish here, targeting $56.00.
-------------------------------------------------------------------------------
** Please LIKE 👍, FOLLOW ✅, SHARE 🙌 and COMMENT ✍ if you enjoy this idea! Also share your ideas and charts in the comments section below! This is best way to keep it relevant, support us, keep the content here free and allow the idea to reach as many people as possible. **
-------------------------------------------------------------------------------
💸💸💸💸💸💸
👇 👇 👇 👇 👇 👇

Today, both bulls and bears have opportunities in crude oil.
Yesterday's public announcement of buying short positions above 62 was a correct bearish strategy. Crude oil fell as expected, as everyone has witnessed! The daily closing price formed a hammer pattern with a long lower shadow. This pattern signals that crude oil has stabilized. Support below is expected to be between $60.8 and $61. Buying above this support is recommended. The current trend reflects crude oil's overall range-bound behavior, with resistance above 62.5 and 63.
As everyone knows, the recent market has been quite volatile. Our recommendations are subject to change based on market conditions and are time-sensitive. Short-term trading, especially for us, requires precise technical analysis and decisive action to make profits easier. If you need to recover significant losses or obtain accurate trading signals, please contact me

Hellena | Oil (4H): SHORT to support area of 54.00.As I continued to watch oil I realized that the structure I built in the last forecast is still in place. I think we should expect a correction in wave “4” to the 59.3 area, then a continuation of the downward movement at least to the 54.00 support area. This will be the completion of the downward impulse.
I do not exclude the probability of lengthening of wave “3” and in this case there will be no correction and the price will immediately reach the target.
Fundamental context
The oil market remains under pressure as supply continues to outpace demand, raising the risk of a surplus. Forecasts for 2025-2026 indicate higher production growth while consumption slows.
Rising inventories and a shift in the futures curve into contango suggest growing storage levels and weaker near-term demand.
Under these conditions, downside pressure persists, keeping the probability of a further decline high.
Manage your capital correctly and competently! Only enter trades based on reliable patterns!

USOIL TRADE IDEAhi all
USOIL has broken through the resistance level at 60.17 on the H4 timeframe. The current decline is likely a pullback. In my view, the 59.3–59.1 range presents a good opportunity to go long on USOIL
good luck all
**My trading strategy is not intended to be a signal. It's a process of learning about market structure and sharpening my trading my skills also for my trade journal**
Thanks a lot for your support
Crude Oil Trading Strategy for TodayFunds continue to accumulate: Although the non-commercial net short position of the CFTC remains negative, it has decreased by 80,000 lots in the past two days. Hedge funds have increased their long positions by 120,000 lots in the range of $59 - $60. The trend of fund rebalancing continues, and there is no withdrawal signal.
Refinery replenishment to stabilize: The 3-2-1 cracking spread in the United States remains at $23 per barrel. The processing profit of refineries has not significantly declined, and the operating rate has stabilized at 88%. Corresponding to the daily purchase volume of crude oil, it has increased by 300,000 barrels compared to the beginning of October, and the demand for active replenishment of inventories supports the price.
Crude Oil Trading Strategy for Today
buy:59.5-60
tp:61-61.5
sl:58.5

Crude Oil Trading Strategy for TodayExcess inventory reduction exceeded expectations, and the resilience of demand was continuously verified
The latest EIA data shows (as of the week ending October 31), U.S. crude oil inventories decreased by 4.5 million barrels on a month-on-month basis (expected - 1.8 million barrels), and inventories have exceeded expectations for two consecutive weeks of reduction; gasoline inventories decreased by 3.2 million barrels (the largest decline in the same period since November, nearly 5-year low), refined oil inventories decreased by 2.8 million barrels, and inventories of the three major oil products were all below the 5-year average by 10%-15%. The inventory in the Cushing region increased by 800,000 barrels, but the overall reduction trend did not change, and the marginal tight balance feature of supply and demand was prominent.
Increased risk of Red Sea transportation, intensified supply chain disruptions
The Houthi armed group has recently intensified attacks on Red Sea merchant ships. Since November, 5 oil tanker ships have been attacked, and some oil tankers were forced to take a detour around the Cape of Good Hope (the voyage increased by 30%, transportation cost increased by 200,000 US dollars per ship). Currently, Red Sea crude oil transportation accounts for 12% of the global total. If the situation worsens, it may add 50-80 thousand barrels per day of supply disruptions.
The expectation for Fed rate cuts has risen again, and the US dollar is under pressure, which benefits oil prices
The U.S. 10-month CPI increased by 3.2% (lower than the expected 3.3%), and the core CPI increased by 2.9% (the lowest since January 2023), and the probability of the Fed cutting interest rates by 25 basis points in December from 55% rose to 78%. The US dollar index fell below the 93 threshold, the cost of purchasing non-US currencies decreased, and China and India's crude oil imports are expected to increase by 5%-8% month-on-month in November.
Crude Oil Trading Strategy for Today
buy:59.5-60
tp:61-61.560
sl:58.5
Hellena | Oil (4H): SHORT to support area of 59.00.Colleagues, the situation is complicated, but I still expect the price to renew the local low of 56.40.
It looks like the price is forming a complex compound correction (WXY) and I think that for now it is worth looking at the 59.00 area as the nearest most likely level.
Ideally, I would like to see the completion of wave “C” in the area of 64.80.
Fundamental context
According to the latest IEA report, the global oil market remains under pressure as supply continues to outpace demand. For 2025, production is expected to rise by around 3 million barrels per day, while demand growth is forecast at only 0.7 million barrels. This imbalance increases the risk of oversupply and inventory buildup across key regions.
Manage your capital correctly and competently! Only enter trades based on reliable patterns!

WTI It's creating an Invers Head and Sholders pattern-At this price It's a very good opportunity to enter with a very good SL and a high profit opportunity.
-Currently It's bullish as the chart show us but It's important to be very carrefull cause petrol It's very volatile and political influenced

Review of USOIL's Performance This Week📝This week, the USOil market exhibited a highly volatile pattern of "first bottoming out and stabilizing, then rebounding driven by geopolitical factors". The competition between supply-demand fundamentals and sudden geopolitical events dominated the market trend throughout the week. Details are as follows:
💡Price Movement: From Approaching Annual Lows to Intraday Surges, Volatility Within Ranges Intensifies
1. Bottoming Out Early in the Week
On Monday, USOil continued its weak oscillation. It opened at $57.32 per barrel, dipped to a low of around $56 per barrel (approaching the 2025 annual low of $55.12), and finally closed at $56.93 per barrel, down $0.61 from the previous trading day.
From Tuesday to Wednesday, as panic eased, prices gradually stabilized and rebounded. It closed at $57.58 per barrel on Tuesday; on Wednesday, boosted by geopolitical expectations, it surged by $3.25 in a single day to close at $61.75 per barrel, with trading volume rising to 711,600 lots.
2. Rebounding and Then Retreating in the Latter Half of the Week
On Thursday, the official release of detailed EU and U.S. sanctions on Russian energy triggered a strong market reaction. USOil opened at $59.94 per barrel and then jumped, peaking at $62.59 per barrel with an intraday gain of nearly 5%, before closing at $61.44 per barrel.
On Friday, after the earlier rebound, prices entered a consolidation phase, fluctuating narrowly around $62. For the whole week, it rebounded by over 10% from the previous week’s low.
💡Core Influencing Factors:
1. Bearish Drivers: Sustained Supply-Demand Easing Suppresses Oil Prices
✔Worsening Supply Glut
✔Weak Demand Weighs on Prices
2. Bullish Disturbances: Geopolitical Sanctions Trigger a Phased Rebo
💡Technicals and Market Sentiment: Recovery After Oversold Conditions, Persistent Long-Short Divisions
1. Divergent Signals from Technical Indicators
2. Intense Battles Around Key Levels
The support at the annual low of $55.12 proved effective, serving as the starting point for the week’s bottoming and rebound. The resistance levels at $58 and $62 were breached one after another, but the resistance from the $63 level and the 70-dollar trend line still posed long-term pressure. A breakthrough would require sustained improvement in fundamental
💡Outlook: Short-Term Oscillations Unlikely to Reverse Long-Term Weak Trend
💎Short-Term Perspective: Geopolitical risk premiums and technical recovery after oversold conditions may support oil prices to fluctuate within the $58-$63 range. If the supply gap caused by sanctions continues to widen, it may test the resistance level of $66.
💎Long-Term Perspective: The IEA predicts that Brent crude oil prices will range between $52-$60 in 2026. Core contradictions such as loose supply-demand, accelerated energy transition, and approaching demand peaks remain unresolved. If the support at $55 is broken, it may fall to the deep correction range of $49 or even $37.
The market should focus on whether OPEC+ will adjust its production increase plan at the November 2 meeting and the impact of global manufacturing PMI data on demand expectations.
USOIL IN DOUBLE BOTTOM, MAYBE TARGETING ABOVE 66Oil may have found temporary bottom with the weekly double bottom.
N.B!
- USOIL price might not follow the drawn lines . Actual price movements may likely differ from the forecast.
- Let emotions and sentiments work for you
- ALWAYS Use Proper Risk Management In Your Trades
#usoil
#ukoil
Potential bullish bounce off?USO/USD is reacting off the support level, which is a pullback support that aligns with the 38.2% Fibonacci retracement and could potentially rise from this level to the take profit.
Entry: 60.51
Why we like it:
There is a pullback support that aligns with the 38.2% Fibonacci retracement.
Stop loss: 58.82
Why we like it:
There is a pullback support that aligns with the 61.8% Fibonacci retracement.
Take profit: 62.83
Why we like it:
There is a multi-swing high resistance.
Enjoying your TradingView experience? Review us!
Please be advised that the information presented on TradingView is provided to Vantage (‘Vantage Global Limited’, ‘we’) by a third-party provider (‘Everest Fortune Group’). Please be reminded that you are solely responsible for the trading decisions on your account. There is a very high degree of risk involved in trading. Any information and/or content is intended entirely for research, educational and informational purposes only and does not constitute investment or consultation advice or investment strategy. The information is not tailored to the investment needs of any specific person and therefore does not involve a consideration of any of the investment objectives, financial situation or needs of any viewer that may receive it. Kindly also note that past performance is not a reliable indicator of future results. Actual results may differ materially from those anticipated in forward-looking or past performance statements. We assume no liability as to the accuracy or completeness of any of the information and/or content provided herein and the Company cannot be held responsible for any omission, mistake nor for any loss or damage including without limitation to any loss of profit which may arise from reliance on any information supplied by Everest Fortune Group.

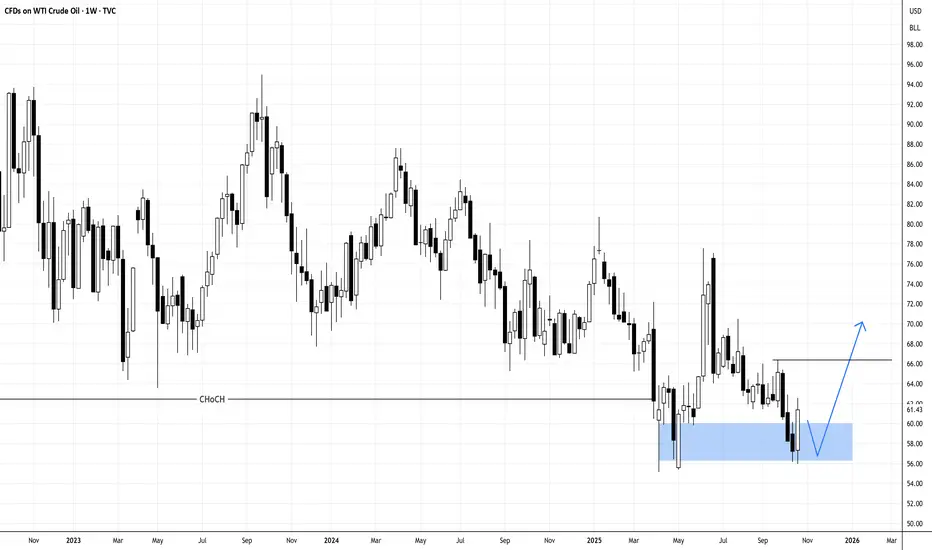
USOIL WEEKLY🧩 1. Chart Overview
• Instrument: WTI Crude Oil (TVC: USOIL)
• Timeframe: Weekly (W1)
• Current Price: Around $60.34
• Main Idea: Price is completing a large correction and preparing for a major long-term uptrend.
⸻
⚙ 2. Elliott Wave Structure Breakdown
🔹 Wave Count
• The major Wave (A) peaked near $130–$140 (the 2022 top).
• Since then, oil has been moving in a complex correction labeled as (W)-(X)-(Y) — a typical double zigzag structure.
• You’ve marked the last part as Wave (2) nearing completion — meaning the next leg is expected to be Wave (3) to the upside (a powerful impulsive rally).
⸻
🧠 3. Wyckoff Accumulation Phase
The right side of the chart shows a Wyckoff-style pattern, indicating accumulation after a large markdown.
Key Wyckoff Labels:
• AR (Automatic Rally): The first strong bounce after the selloff, forming the upper boundary of the trading range.
• ST (Secondary Test): Retest of the lower support area.
• Spring: Final shakeout below support — trapping late sellers.
• Test / (2): The end of the correction, confirming accumulation is complete.
✅ Once the spring is confirmed, a strong markup phase (uptrend) usually begins — aligning perfectly with Elliott Wave (3).
⸻
🧭 4. BOS & CHoCH (Smart Money Concepts)
These two terms on the left side represent structure shifts:
• BOS (Break of Structure): Indicates the end of a bearish phase and start of a new bullish leg.
• CHoCH (Change of Character): Early signal of trend reversal — used by institutional traders to identify accumulation/distribution shifts.
So the previous bullish leg (2020–2022) already showed BOS and CHoCH, meaning the market structure turned bullish.
Now, we are in the re-accumulation stage before the next big push.
📈 6. Expected Path (Your Projection)
1. Current Phase: Completing the last leg of correction (Wave (2)) — forming a Wyckoff spring.
2. Next: Bounce and consolidation above $70–80 to confirm accumulation.
3. Then: Major breakout — Wave (3) — targeting $110–$140, possibly over several months into 2026–2027.
Simple Interpretation
WTI Crude Oil is finishing its large corrective phase near $60.
The structure shows a Wyckoff spring + Wave (2) bottom, meaning big accumulation is happening.
Once price breaks above $80, a strong multi-year uptrend could begin, aiming for $120–$140.

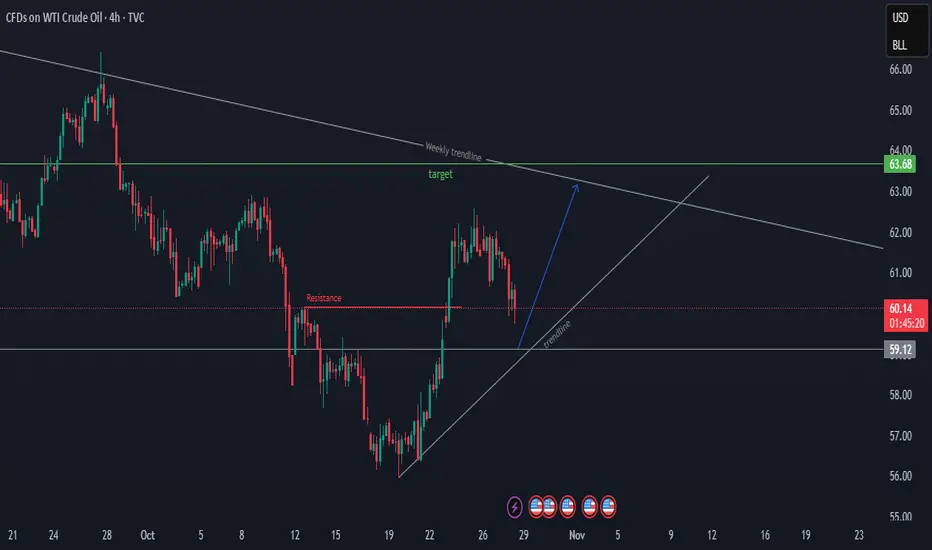
WTI OIL OIL DEFENDED 56$-55$ ZONE ,THE NEXT TECHNICAL BUY POSITION WILL BE 60.79$-61$ ,IF THE LAYER IS RESPECTED I WILL HOLD BUY TILL WE BREAKOUT OF 62.188$ PER BARREL hoping to challenge the long term descending trendline holding price as supply roof and dynamic resistance to upswing.
buy target could exceed 66.219-65.567$
WTI (West Texas Intermediate) crude oil is a major benchmark for oil prices, representing light, sweet crude oil primarily produced in the U.S. It is widely used globally to price various grades of crude oil.
As of late October 2025, WTI crude oil prices have been trading around $61.745 per barrel. The recent price movement reflects several fundamental factors:
Supply Constraints: Ongoing production cuts by OPEC+ members and U.S. sanctions on key oil-producing countries are tightening supply, supporting prices.
Demand Dynamics: Global economic concerns, including slowing growth in major economies, have weighed on demand outlook, causing price volatility.
Inventory Levels: U.S. crude inventory data and storage capacity utilization have affected market sentiment with fluctuating stockpile levels.
Geopolitical Risks: Tensions in the Middle East and trade uncertainties continue to keep risk premium in prices.
Energy Transition Policies: Shifts toward renewable energy and emission reduction targets are influencing longer-term demand forecasts.
In summary, WTI prices near $61-62$ are driven by a mix of supply discipline, cautious demand outlook, and geopolitical uncertainties, creating a balanced but volatile oil market environment
This fundamental backdrop suggests that price action in WTI will remain sensitive to OPEC+ decisions, U.S. economic data, and geopolitical developments.
#USOIL #WTI #OIL #UKOIL

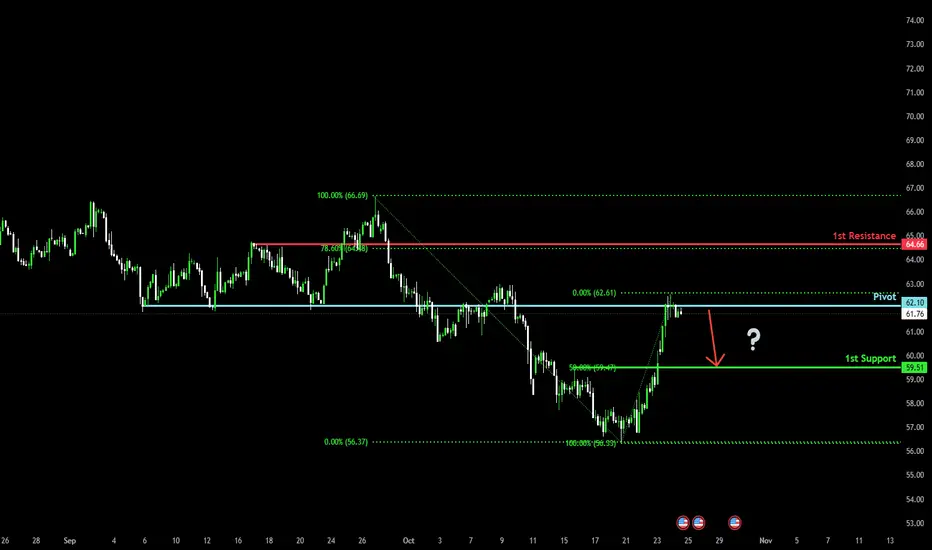
Bearish reversal off overlap resistance?WTI Oil (XTI/USD) is reacting off the pivot whic acts as an overlap resistance and could drop to the 50% Fibonacci support.
Pivot: 62.10
1st Support: 59.51
1st Resistance: 64.66
Disclaimer:
The above opinions given constitute general market commentary, and do not constitute the opinion or advice of IC Markets or any form of personal or investment advice.
Any opinions, news, research, analyses, prices, other information, or links to third-party sites contained on this website are provided on an "as-is" basis, are intended only to be informative, is not an advice nor a recommendation, nor research, or a record of our trading prices, or an offer of, or solicitation for a transaction in any financial instrument and thus should not be treated as such. The information provided does not involve any specific investment objectives, financial situation and needs of any specific person who may receive it. Please be aware, that past performance is not a reliable indicator of future performance and/or results. Past Performance or Forward-looking scenarios based upon the reasonable beliefs of the third-party provider are not a guarantee of future performance. Actual results may differ materially from those anticipated in forward-looking or past performance statements. IC Markets makes no representation or warranty and assumes no liability as to the accuracy or completeness of the information provided, nor any loss arising from any investment based on a recommendation, forecast or any information supplied by any third-party.
Bearish reversal off major resistance?WTI Oil (XTI/USD) is rising towards the pivot, which is an overlap resistance and could reverse to the 1st support.
Pivot: 62.10
1st Support: 58.37
1st Resistance: 64.66
Disclaimer:
The above opinions given constitute general market commentary, and do not constitute the opinion or advice of IC Markets or any form of personal or investment advice.
Any opinions, news, research, analyses, prices, other information, or links to third-party sites contained on this website are provided on an "as-is" basis, are intended only to be informative, is not an advice nor a recommendation, nor research, or a record of our trading prices, or an offer of, or solicitation for a transaction in any financial instrument and thus should not be treated as such. The information provided does not involve any specific investment objectives, financial situation and needs of any specific person who may receive it. Please be aware, that past performance is not a reliable indicator of future performance and/or results. Past Performance or Forward-looking scenarios based upon the reasonable beliefs of the third-party provider are not a guarantee of future performance. Actual results may differ materially from those anticipated in forward-looking or past performance statements. IC Markets makes no representation or warranty and assumes no liability as to the accuracy or completeness of the information provided, nor any loss arising from any investment based on a recommendation, forecast or any information supplied by any third-party.
