USOILSPOT trade ideas

Usoil-trading range
Recently, oil has been fluctuating in the range of 80-83.1, so we will treat it as a range fluctuation for the time being and wait for the trend to come out.
In range fluctuations, you can wait for the upper edge of the range to sell, or you can wait for the lower edge of the range to buy, and control your position. If the range is exceeded, strictly SL
Join me, I will share my thoughts every day, follow my strategies and your success rate will be greatly improved

Israel strikes Iranian consulate, what does WTI chart tells us?Hi, 1PERCENT here.
Today I am sharing a chart that I drew a few years ago.
Contrary to crypto where we have fast movements of 30% intraday,
Bonds, commodities, inflation rates, etc. are "slow movers"... but only in peaceful times.
So patience is required for investors who focus on the forest. You were correct, but 10 years early. Now is your time to shine.
#PeterSchiff #MikeMaloney
WTI crude oil price that bounced from the $68-74 support zone .
This support zone held well even last year when mass media and the EIA (US government's puppy) kept screaming that we have an oversupply of oil & gas.
Remember what happened back in 2022 when oil went to $128? Especially those in Europe & Asia?
Pay attention & Be prepared for the changes occurring in our societies.
Stay safe.
1PERCENT

Trail you SL or close Already running 100 pips profit in one day
Crude oil looking more bullish ...
Already shared entry hope you guys used it , if this make correction down take another entry buy

USOIL Is Bearish! Sell!
Take a look at our analysis for USOIL.
Time Frame: 1D
Current Trend: Bearish
Sentiment: Overbought (based on 7-period RSI)
Forecast: Bearish
The market is approaching a significant resistance area 84.99.
Due to the fact that we see a positive bearish reaction from the underlined area, I strongly believe that sellers will manage to push the price all the way down to 81.43 level.
P.S
We determine oversold/overbought condition with RSI indicator.
When it drops below 30 - the market is considered to be oversold.
When it bounces above 70 - the market is considered to be overbought.
Like and subscribe and comment my ideas if you enjoy them!

WTI Bullish Flag BreakoutBullish Flag has broken the resistance.
Inverse Head Head and Shoulder's NKLN also broke out
Change your color Theme to "Dark" if you cannot see the lines and text on the chart


USOILBased on my analysis of the USOIL market, it seems that the trend is still strong and there is a consistent demand for buying. In order to avoid losing your money, I would recommend focusing on buying deals only. You should wait for the price to return to the support level, and even if it reverses, you should still consider buying. Remember to always follow the trend and good luck with your investments.

my crude oil trajectoryi believe oil is done with the ABC correction now should start anticipating a bearish continuation from here

Oil correction is a buying opportunity
The news is likely to boost oil prices. Geopolitical factors have affected oil reserve inventories. Oil inventories this week will be significantly lower than expected. leading to increased market demand
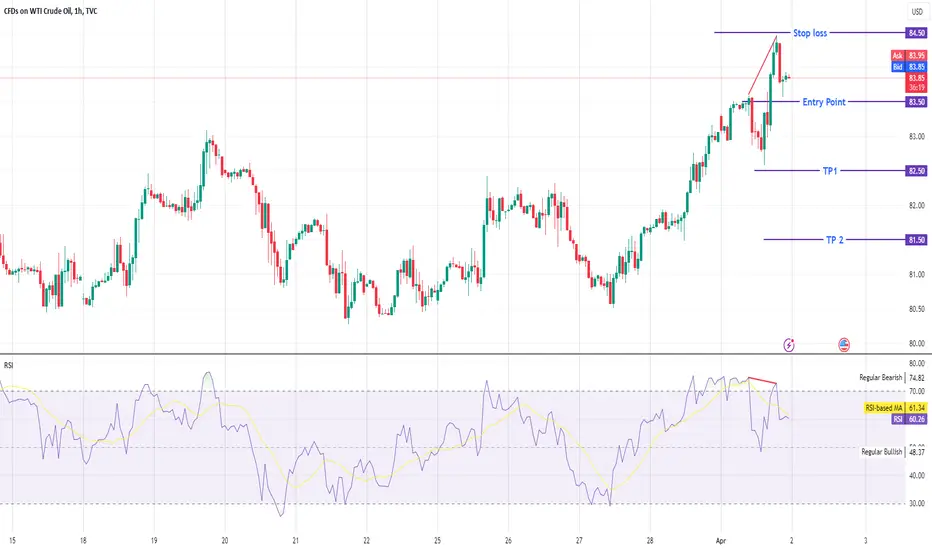
In terms of trend, there is a certain degree of over-rising behavior in the market, but the trend is still a bullish trend. If the price falls back to the low price within the day, you can still buy. Focus on the buying position in the range of 3.9-83.5.
This week’s focus will be on the release of API and EAI data.
Related Products: MATBAROFEX:WTI1! BLACKBULL:USOIL.F FX:USOILSPOT NYMEX:WTI1!

Crude Oil (WTI) may rise to 85.00 - 85.50Pivot
83.60
Our preference
Long positions above 83.60 with targets at 85.00 & 85.50 in extension.
Alternative scenario
Below 83.60 look for further downside with 83.00 & 82.60 as targets.
Comment
The RSI shows upside momentum.
Supports and resistances
86.00
85.50
85.00
84.37 Last
83.60
83.00
82.60
Number of asterisks represents the strength of support and resistance levels.

OIL STILL BULLISH As we spoke previously regarding oil, after hitting the selling targets at the bottom in the green box between 69.92/65.93, which extended from point B at the top, reaching these areas, it is necessary to return to the healthy correction levels in the blue belt at levels between 84.60/79.89.
But as we see, as a trader in the SK system, I find here something positive of the KKI type, which is one of the strongest types of secs in the sk system, as it does not stop in the target areas (C) and does not exceed them usually, achieving higher levels, and confirms this secs that support the record, which does not exist, by rising after a shift. Area B to area Now we are looking to collect the levels of the health level and then we are looking for another entry point from the (BC) area, which is the reversal point after the correction so that the price will always bounce from it to the top to resume the rise. Failure
note :
B = base
BC = base correction
WCL = whole correction level
KKI = correction correction Impulse

Buy continues scalping Take long positions scalp every 50 pips Is best way to gain capital .
Holders trail your SL

USOIL BULLISH FORECAST AND ANALYSISUSOIL BULLISH FORECAST AND ANALYSIS The price of Oil looking to get some more achievements in bullish trend near 185. 19 so know keep it your mind and keep following me for more updates related with oil.

Bullish momentum to extend?WTI oil (XTI/USD) could continue its bullish climb towards an overlap resistance at 86.67 which has been identified as a pivot point. Could price potentially stall around this level and pull back slightly before resuming the uptrend?
Pivot: 86.67
Support: 83.52
Resistance: 89.25
Risk Warning:
Trading Forex and CFDs carries a high level of risk to your capital and you should only trade with money you can afford to lose. Trading Forex and CFDs may not be suitable for all investors, so please ensure that you fully understand the risks involved and seek independent advice if necessary.
Disclaimer:
The above opinions given constitute general market commentary, and do not constitute the opinion or advice of IC Markets or any form of personal or investment advice.
Any opinions, news, research, analyses, prices, other information, or links to third-party sites contained on this website are provided on an "as-is" basis, are intended only to be informative, is not an advice nor a recommendation, nor research, or a record of our trading prices, or an offer of, or solicitation for a transaction in any financial instrument and thus should not be treated as such. The information provided does not involve any specific investment objectives, financial situation and needs of any specific person who may receive it. Please be aware, that past performance is not a reliable indicator of future performance and/or results. Past Performance or Forward-looking scenarios based upon the reasonable beliefs of the third-party provider are not a guarantee of future performance. Actual results may differ materially from those anticipated in forward-looking or past performance statements. IC Markets makes no representation or warranty and assumes no liability as to the accuracy or completeness of the information provided, nor any loss arising from any investment based on a recommendation, forecast or any information supplied by any third-party.

USOIL (H4) The price will raise to acquire the 84.25$ and higherUSOIL (H4) The price will raise to acquire the 84.25$ and higher
The price of the Oil is looking to get some uptrend targets now after recent declines for the downtrend. For the third day in a row, West Texas Intermediate (WTI) US crude oil prices are still trading close to the weekly low, in the $80.30 range, during the Asian session.
A truce in Gaza and the release of captives are being discussed, according to US Secretary of State Antony Blinken, allaying fears that the Middle East's supply chain may be disrupted. Crude oil prices, along with other USD-denominated commodities, are being pressured downward by these causes as well as some subsequent purchasing of the US Dollar (USD), which is supported by the positive US economic outlook. Yet concerns about a tighter global supply seem to have mitigated some of the negative.
Russia may produce less gasoline as a result of Ukrainian drone attacks on its oil plants. Together with the International Energy Agency's revised estimate of the rise in oil demand in 2024, OPEC+ members decided to prolong their production curbs of 2.2 million barrels per day through the second quarter. More reason to anticipate fewer supply comes from a stronger US economy and possible Chinese resurgence. The price of crude oil may benefit from this, therefore bearish traders should exercise care.
NOTE: KEEP FOLLOWING ME FOR MORE ANALYSIS AND MORE INFORMATION ABOUT DIFFERENT PAIRS OF THE MARKET LIKE FOREX, CRYPTOCURRENCIES AND MUCH MORE.

Oil buy 2nd aprilWTI oil buy off H4 ob ,
just holding and lets see where this gets
first post on tradingview for years lol
oil up bby

US OIL shows Divergence on 1 hour chartThe one-hour chart for US OIL shows divergence, suggesting a forthcoming bearish trend.
US OIL (WTI) MARKET ANALYSE. (READ CAPTION)Technical Analysis:
Incorporate key trading indicators such as the double line resistance breakout, pullback support, and demand zone analysis to assess price movements in the US Oil market. Identify channels and trendlines to spot potential breakout or breakdown points, confirming with volume and momentum indicators like relative strength index (RSI) and moving average convergence divergence (MACD). Additionally, monitor the US Dollar Index (DXY) for its impact on oil prices, considering its inverse correlation. Stay vigilant for opportunities at support and demand zones, utilizing these levels for entry and exit points in your trading strategy.
If you like this idea please support with boost comment and follow thanks for with us.

Will usoil rebound after opening high?
During the three days of market closure, Russia further cut production and the geopolitical situation escalated again, which led to today's crude oil opening rising and reaching new highs.
Crude oil consolidated on the K-line last week, and was gathering momentum to consolidate at a high level. The space recovered, but the short-term long and short kinetic energy was insufficient. The daily retracement space was not large, and the sustainability was not strong. While it was gaining momentum, it just lacked a little unilateral momentum. Yesterday, it stabilized slightly near the middle track of Bollinger Band. The middle track and the upward trend line 80.0-80.50 are still the key support points. The low and long thinking can be maintained before falling. In the 4-hour chart, it dipped for the second time and stabilized near 80.50. It had also formed support here at the beginning of the week and fluctuated upward. It is currently continuing to gather momentum around the low point, but the unilateral momentum is insufficient and it has entered a see-saw consolidation. The top short-term focus is on the resistance of 84.5-85.0, and the bottom is focused on the first-line support of 82.0-81.5
oil:sell84.5-85
tp:84-83.5
sl:85.5

OIL May 85 oil test in the coming weeksOIL May 85 oil test in the coming weeks
Technical Analysis:
The price of oil broke out of a strong bullish channel.
The price reached 80.80 on 01-Mar-2024 and during all these days it created the second bullish channel pattern which lasted for 11 days.
The breakout from the pattern turned out to be solid, increasing the chances of oil testing 85$ per barrel in the coming weeks.
This is also related to an increase in the demand for oil in the market that OPEC is already speculating.
You may find more details in the chart!
Thank you and Good Luck!

OILAnyone else thinks oil is about to pop off?
Strong let level with a push to the upside followed by a retracement. Now waiting for the buyers to take control here and drive price up.
