USOILSPOT trade ideas

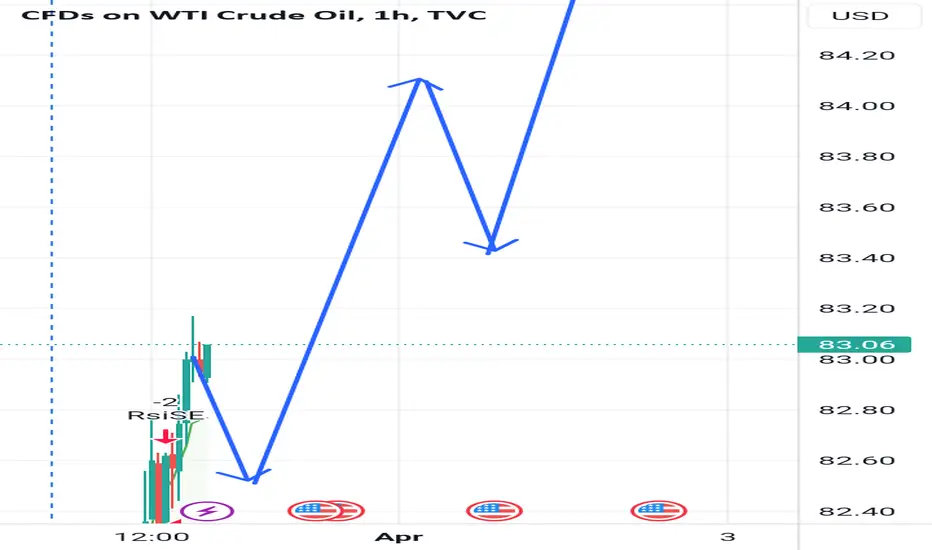
Usoil now at $8263.7 per unitConsider purchasing Usoil now at $8263.7 per unit, with an entry price set at this level. Target profits are set at $8310.5, $8380.6, and $8421.6respectively. To mitigate potential losses, set a stop loss at $8125. This trade has been confirmed as promising, so it's advisable not to overlook it. Remember to implement proper risk management techniques to safeguard your investment."

Buy the dipWe are in strong bullish wave which will end at 93 so buy the dip from 82.4 and target 88-90-93
Education chart - SIMPLE ZIGZAGS in WXY DOUBLE ZIGZAGI started to assemble own ibrary of ElliottWave patterns and rules.
Here simple zigzags occured in: wave W and wave Y of WXY double zigzag
Zigzag 1 - wave W
Wave A - leading diagonal
Wave B - double zigzag
Wave C - ending expanding diagonal ending at the top line of the parrallel channel
Zigzag 2 - wave Y
Wave A - impulse
Wave B - double zigzag
Wave C - ending expanding diagonal ending at the middle of the parrallel channel
-----------------------------------------
## Rules for Simple ZigZag
- Subdivide into three waves.
- Wave A is always an impulse or leading diagonal (expanding or contracting)
- Wave C is always an impulse or ending diagonal (expanding or contracting).
- Wave B is any corrective pattern.
- Wave B never moves beyond Wave A start
- Wave B always ends in Wave A territory
- Wave A and C cannot be both diagonals of the same type (contracting/contracting or expanding/expanding), other combinations are possible
## Norms
- Waves A and C are frequently impulse waves but even more often they alternate between impulse and diagonal modes. Waves A and C may occasionally alternate between contracting and expanding diagonals
- Waves A and C cannot be diagonals of the same type
- Wave C must travel past Wave A's top. In Elliott Wave Theory, failure to do so is referred to as truncation
- Wave C should not go below 90% of Wave A
## Guidelines
- Wave C is typically equal to 0.618 (occasionally 1.618 or 2.618) of wave A
- Wave B typically retraces 38-79% of Wave A
- in case B is a triangle it retraces **38-50%** of Wave A
- in case B is a running triangle, the retracement can be **10-40%**
- in case B is zigzag, the expected retracement is **50-79%**
- The parallel channel that connects Wave A's start and Wave B's finish may provide a hint of where Wave C might conclude by extrapolating the other line from Wave A's end
- If waves A and C are both strong, wave C will reverse at the channel's top line
- If wave C appears weaker than wave A, it may reverse at the channel's middle
- If Wave C performs stronger than A, a double channel will be used as a target of the reversal point.
## Occurs in
Wave 2
Wave 4 (unless happened in wave 2)
Wave W, Y of WXY double zigzag
Wave W or Y of a combination
Wave B of ABC flat
Waves 1, 2, 3, 4, 5 in contracting diagonal
Wave B of ABC zigzag
Wave X of WXY double zigzag

Usoil weekly Target Crude oil is one of the most in-demand commodities, with the two most popularly traded grades of oil being Brent Crude and West Texas Intermediate (WTI). Crude oil prices reflect the market's volatile and liquid nature, as well as oil being a benchmark for global economic activity. The oil price charts offer live data and comprehensive price action on WTI Crude and Brent Crude patterns. Get information on key pivot points, support and resistance and crude oil news today.
Usoil up 83
Target 87
Resistance 80

USOIL: Expecting Bearish Movement! Here is Why:
The charts are full of distraction, disturbance and are a graveyard of fear and greed which shall not cloud our judgement on the current state of affairs in the USOIL pair price action which suggests a high likelihood of a coming move down.
❤️ Please, support our work with like & comment! ❤️

USOIL bullish on Monthly / Weekly Candle but cautious for bears.
A few indications of bullish Oil,
1) A break out of $80 from the sideways action over the last few months from 70-80
2) Support area around 80.5, 81.5 from bounces. However one thing to note, bears seem to be missing. The bearish moves previously was violent like on 23rd feb, 4th March, 7th march, 8th march.. were $2-3 moves. After that it was 10days bulls before a pull back that did not manage to test $80.
3) 80.5 support looks to hold, forming a W pattern.. It looks like a double bottom on the 4hr chart
4) May generally tends to be a bullish month if you look at previous years.
blog.stonexone.com
My thoughts are that Oil will continue to rise and it will test the major trendline from the Ukirane War top, around 83.6 - $86. Warning is that Bears have not showed up but if they do it can drop pretty fast, so I would be cautious longing from here onward. If there is a pull back, I would look at 80.5-80 for a buy opportunity but would also pair it with momentum indicators and confirmation of a turn around.

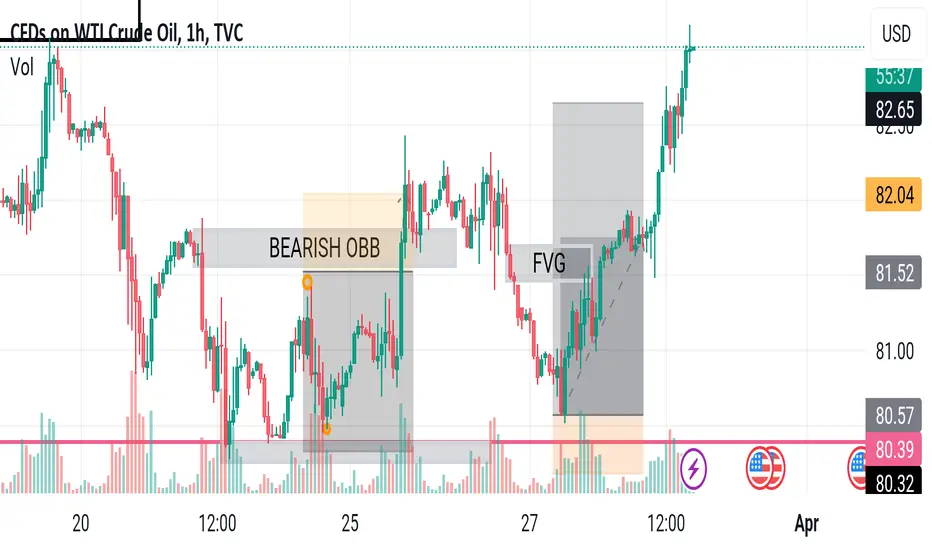
USOIL - Interesting buying area!Hello everyone!
Here is my opinion on USOIL:
We have liquidity before the zone.
We have an interesting non-mitigated zone.
We have an optimal fibo zone.
We're in line with the trend.
That's why I'd like to see USOIL bounce off the zone and go up!

🛢 CL OIL, H4 🛢 29 March 2024🛢 CL OIL, H4 🛢 29 March 2024
Crude oil prices are on a continuous ascent and are currently testing the resistance level at $83. The optimistic outlook for oil prices persists due to the announced production cuts by OPEC+ and the resulting tighter oil supply expectations. Additionally, the decline in the oil and gas rig count in the U.S. during the last week of March has contributed to the bullish sentiment surrounding oil prices.
Oil prices continue to climb after a rebound from their liquidity zone and are currently testing the resistance level at $83. Suggests a fresh bullish momentum is forming.
Resistance level: 82.85, 85.45📉
Support level: 80.20, 78.00📈

USOIL in in Bullish TrendUSOIL is trending Bullish trend in the IH time frame and printing higher high and higher low

U.S. oil prices will continue to rise on March 14th.
As the four major inventories continue to decrease. U.S. oil continues to rise. WTI quotation as of closing: 79.153
U.S. API crude oil inventories for the week to March 8 (10,000 barrels)
(-5.221 million barrels)
U.S. EIA Cushing, Oklahoma crude oil inventories for the week to March 8 (-1.536 million barrels)
EIA crude oil inventories in the United States for the week to March 8 (-220,000 barrels)
EIA Cushing, Oklahoma crude oil inventories in the United States for the week to March 8 (596,000 barrels)
BLACKBULL:WTI FPMARKETS:WTI BLACKBULL:WTI NYMEX:WTI1! MATBAROFEX:WTI1!
There are good motivations for the rise in oil prices. At the beginning of the Asian market, oil was stable above 79. Judging from short-term trends, market demand continues to increase due to the spread of geopolitics. It is expected to continue to rise above 80. At the same time, OPEC countries have also decided to reduce production. If there is no physical fall below 79 in the short term, you can directly buy. If the body falls sharply and falls below 79. We can buy near 78.6 in the second position
personal suggestion:
79.-79.3 buy. sl78.TP80.6
The transaction price is based on the real-time price of TradingView. When you are not a member and follow the above operations, remember to control risks.

Usoil strategy analysis next week
Overall, WTI crude oil futures prices have found resistance over the past few trading days, hovering around the 50.0% Fibonacci level of 81.50. But the formation of a triangle pattern in this area could mean a possible price breakout in the coming sessions. Under the dual influence of the OPEC+ meeting and geopolitical factors, there are still many uncertainties in the oil market
The crude oil market has shown a roller coaster-like oscillation this week, with prices fluctuating up and down the 82 line. During the European session, crude oil prices retreated to the 81.5 line, and then rebounded again, breaking through this week's high of 82.5 and heading towards the 83 mark. Bulls performed strongly and the market was in line with expectations.
From the perspective of short-term trends, crude oil prices fluctuate frequently, with sharp rises and falls; while the medium-term trend is to fluctuate and gradually rise. Yesterday, the white market resisted the decline and failed to test the short-term bullish expected point, indicating that the market still has certain buying support. The current test channel is on track, with short-term support moving to 81.7 and band support moving to 80.7. The market is generally bullish. The resistance is at the 83 line. If it truly breaks through and stands firm, it is expected to challenge 84 and higher levels. Next week's operation suggestions are mainly to buy at the lower position, and secondarily to sell at the high level. Pay attention to the 84.5-85.0 line at the top, and the 82.0-81.5 line support at the bottom.

Market Analysis: Crude Oil Price Gain Bullish Momentum Market Analysis: Crude Oil Price Gain Bullish Momentum
Crude oil prices are gaining bullish momentum and might rise toward $85.00.
Important Takeaways for Oil Prices Analysis Today
Crude oil prices rallied above the $81.60 and $82.00 resistance levels.
There is a key bullish trend line forming with support at $82.30 on the hourly chart of XTI/USD at FXOpen.
Oil Price Technical Analysis
On the hourly chart of WTI Crude Oil at FXOpen, the price started a major rally against the US Dollar. The price gained bullish momentum after it broke the $80.00 resistance.
There was a sustained upward move above the $81.60 and $82.00 resistance levels. The bulls pushed the price toward $82.80. The current price action is positive above the 50-hour simple moving average and RSI is stable above 60.
The price is holding gains above the 23.6% Fib retracement level of the upward move from the $80.30 swing low to the $82.87 high.
If the price climbs higher again, it could face resistance near $82.90. The next major resistance is near the $83.50 level. Any more gains might send the price toward the $85.00 level.
Conversely, the price might correct gains and test $82.30. There is also a key bullish trend line forming with support at $82.30. The next major support on the WTI crude oil chart is near the $81.60 zone and the 50% Fib retracement level of the upward move from the $80.30 swing low to the $82.87 high.
If there is a downside break, the price might decline toward $80.30. Any more losses may perhaps open the doors for a move toward the $78.80 support zone.
This article represents the opinion of the Companies operating under the FXOpen brand only. It is not to be construed as an offer, solicitation, or recommendation with respect to products and services provided by the Companies operating under the FXOpen brand, nor is it to be considered financial advice.


USOIL Short on 15 TF : Bearish HammerA bearish hammer is formed at the 15 min time frame of the usoil. This hammer is formed at the HH of the chart so a small pull back is expected form here. A small trade of short can be taken from here.

Usoil already target achieved Hey there on 1htF the USOIL has already made our target on yesterday we have make our next target but today they completely done and now also moved upside 86$
We will soon see more rise upside