Crude OilU.S Oil
- Completed " 13245 " Impulsive Waves
- Break of Structure
- RSI - Divergence
- Order Block
- Bearish Channel as an corrective pattern in Short Time Frame
Market insights

USOIL H1 | Bullish Bounce Off Pullback SupportMomentum: Bullish
The price is falling towards the buy entry which is slightly below the 61.8% Fibonacci retracement which adds a significant strength to this level.
Buy entry: 58.22
Pullback support
Slightly below the 61.8% Fibonacci retracement
Stop loss: 57.75
Pullback support
Aligns with the 78.6% Fibonacci retracement
Take profit: 59.48
Overlap resistance
High Risk Investment Warning
Stratos Markets Limited (tradu.com ), Stratos Europe Ltd (tradu.com ):
CFDs are complex instruments and come with a high risk of losing money rapidly due to leverage. 70% of retail investor accounts lose money when trading CFDs with this provider. You should consider whether you understand how CFDs work and whether you can afford to take the high risk of losing your money.
Stratos Global LLC (tradu.com ): Losses can exceed deposits.
Please be advised that the information presented on TradingView is provided to Tradu (‘Company’, ‘we’) by a third-party provider (‘TFA Global Pte Ltd’). Please be reminded that you are solely responsible for the trading decisions on your account. Any information and/or content is intended entirely for research, educational and informational purposes only and does not constitute investment or consultation advice or investment strategy. The information is not tailored to the investment needs of any specific person and therefore does not involve a consideration of any of the investment objectives, financial situation or needs of any viewer that may receive it. Past performance is not a reliable indicator of future results. Actual results may differ materially from those anticipated in forward-looking or past performance statements. We assume no liability as to the accuracy or completeness of any of the information and/or content provided herein and the Company cannot be held responsible for any omission, mistake nor for any loss or damage including without limitation to any loss of profit which may arise from reliance on any information supplied by TFA Global Pte Ltd.

USOIL UPDATE📊 USOIL UPDATE — Key Levels in Focus! 🔥
Price is testing an important zone, and traders are closely watching for the next move. Momentum around these levels could indicate short-term strength or weakness in the market.
🔓 Entry Level: 57.48
❌ Stop Loss: 56.91
🎯 Target: 58.03
Keep an eye on how price reacts here — structured levels like these help spot potential opportunities while managing risk effectively.
💬 What’s your outlook on USOIL?
Bullish or bearish? Share your thoughts below and join the discussion! ⬇️
Your engagement helps this post reach more traders and boosts visibility on feeds 👍
Disclaimer: This post is for educational and informational purposes only. It reflects personal chart observation and is not financial advice. Please do your own research before trading.

Crude oil rebound imminentBullish Marginal Support: Short-term weak support factors
Key support level approaching: The price is approaching the psychological level of $56 and the previous low of $55.99. Some bargain-hunting funds may enter the market to bet on a technical rebound. Historical data shows that this range has triggered short-term recovery rallies.
Divergent inventory structure: US commercial crude oil inventories decreased by 1.8 million barrels week-on-week. Although downstream refined product inventories increased, the reduction in crude oil inventories provides weak support for bulls.
Expectation of policy intervention: Current oil prices are relatively low, and the market expects that a continued decline may trigger verbal or actual intervention from OPEC+, creating a
potential bullish expectation.
Crude oil trading strategies
buy:56-56.5
tp:57-57.5

WTI - crude oil weekly entry for long termWTI - crude oil weekly entry for long term
waiting to buy crude oil for good entry
NFA

USOIL🎙 Market Update – U.S. Oil
U.S. Oil continues to move under bearish pressure, and in the current outlook, we’re targeting the $56 support level.
This expectation remains valid as long as price stays below the $60 zone.
Stay focused, follow the levels, and manage your risk wisely.
US Crude Oil (WTI) is moving lower to complete the 5th waveBroke out of the corrective channel formation to the downside. We continue to make lower lows and lower highs, highlighting downward momentum.
The next substantial target/support level is at $57.74.
This would be the completion of a bearish Elliott Wave count (five waves).
Resistance is located at $58.88. The liquidity zone is seen at $59.66 to $59.80
Conclusion: I can see no technical reason for an immediate change in the bearish trend

USOIL / CRUDE OIL ON MAJOR SUPPORT.Dear traders.
Crude oil is on major support. Price actions is on BULLISH side. Just keep eyes on 55.00 $.
Hope for 60.00 $. We Can aim for good reward. ALL THE BEST

USOIL Trading Idea Key Levels Tested No Fly Zone Defined For the past several weeks USOIL has been compressing around a critical structure level creating a slow tightening range that now sits at the center of a major decision point. Price has repeatedly tested 58.47 to 58.74 which has acted as the battlefield between buyers and sellers. This zone is highlighted in red on the chart the No Fly Zone because any setup taken inside it lacks clear directional advantage. We have been waiting for clean price action outside this zone before committing to either bias.
Bullish Key Levels Upside Scenario
A break and daily close above the upper boundary of the No Fly Zone 58.74 would open the path toward the next key levels
61.55 first major reaction zone previously rejected price with force
67.45 structural target where prior rallies topped out
69.13 full extension bullish target and the top of the measured move
These levels form the broader upside structure we have mapped for weeks. If bulls reclaim 5874 convincingly the momentum window toward 61.55 becomes extremely attractive with higher targets following if energy markets continue stabilizing.
No Fly Zone Indecision Structure
58.47 to 58.74
This is where price has consolidated for weeks. Trading inside this zone means no momentum edge no clear liquidity exit and unreliable follow through. This is the zone where traders get trapped on both sides which is why we intentionally avoided taking new positions until price committed.
Bearish Levels Downside Scenario
If price rejects the No Fly Zone from above and closes below 5847 bearish continuation becomes highly probable. Our next downside structural level is
49.57 major demand zone and the full downside extension of the current structure
The green area on the chart illustrates the asymmetric opportunity on a break beneath 58.47 targeting the deeper liquidity pool around 49.57.
This setup becomes especially compelling because repeated rejections at the red zone show that sellers have been defending this level aggressively.
Trade Summary
Bull Bias Above 58.74 Targets 61.55 then 67.45 then 69.13
Bear Bias Below 58.47 Target 49.57
No Trades Inside 58.47 to 58.74 the No Fly Zone
This framework has allowed us to remain patient while price compresses. Now as USOIL tests the lower boundary again we are watching closely for either a decisive breakdown or a sharp reversal back into bullish structure.
The next daily close should reveal the true direction.

WTI: The "Double Bottom" Reversal or Just a Dead Cat Bounce?BLACKBULL:WTI Crude Oil
Timeframe: 4-Hour
Outlook: Bullish Reversal
Looking at the daily and 4-hour charts, WTI has been locked in a grueling downtrend throughout the second half of 2025. However, we are finally seeing signs that the bears are exhausted.
The Daily Floor (Chart 1): The price has returned to the critical $55.00 – $56.00 support zone. This is a multi-month low and a major psychological level. We are seeing a potential Double Bottom formation here, which often serves as the foundation for a trend reversal.
Descending Wedge Breakout (Chart 2): On the 4-hour timeframe, WTI has been carving out a clear Descending Wedge. Historically, this is a bullish continuation/reversal pattern. My white arrow prediction anticipates a breakout above the upper trendline, a successful retest of the broken resistance (now support), and a rally toward the $62.00 handle.
🌍 Fundamental Context (Dec 17, 2025)
The technicals are aligning with a shifting fundamental narrative:
Inventory Data: Traders are eyeing today’s EIA Crude Oil Inventories report. A larger-than-expected draw could be the spark needed to ignite this technical breakout.
Geopolitical Floor: While peace talk optimism (Russia/Ukraine) has pressured prices recently, the $55 level is a zone where US shale production becomes less profitable, often creating a "natural floor" for the market.

WTI Oil: Key levels for long-term buyingThis analysis is based on the Initiative Analysis (IA) method.
Hello traders and investors!
I reviewed the higher timeframes for oil, and the 2-month chart shows an interesting structure. Price is moving within a very wide sideways range, roughly from $11 to $147.
The lower boundary of this range has already been defended by buyers in the past — in 2016 and again in 2020-2021.
At the moment, seller initiative dominates within this range, with a potential target around 48.52.
The 48.52 level represents the upper boundary of a buyer zone that has not yet been tested. This zone was formed by a high-volume candle, which adds to its significance. The base of that candle — the 47.071–48.52 range — is an area where it makes sense to look for long-term buying patterns.
The 42.206 level is even more attractive for identifying long-term buying opportunities.
The first target for long-term long positions, if this scenario plays out, is 95.501, which corresponds to a test of the seller zone.
Wishing you profitable trades!

CRUDE OIL Free Signal! Buy!
Hello,Traders!
CRUDE OIL has delivered a clean sell-side liquidity sweep into a well-defined horizontal demand area, followed by a strong bullish reaction. This displacement suggests smart money mitigation and absorption, favoring a corrective push higher toward the next liquidity pool.Time Frame 5H.
--------------------
Stop Loss: 56.98$
Take Profit: 58.07$
Entry: 57.47$
Time Frame: 3H
--------------------
Buy!
Comment and subscribe to help us grow!
Check out other forecasts below too!
Disclosure: I am part of Trade Nation's Influencer program and receive a monthly fee for using their TradingView charts in my analysis.

Watching, for break or continuation of channelHad a bad week considering that the original break from channel was a dud.
Redrawing the trendlines, 1hr, channel is down obviously, but there seems to be a minor support at 57. Will have to wait next week to see where this is going... whether it continues down to break 57 or to move out of this channel.

USOIL: 15/12 daily analysisMiddle Eastern oil markets have weakened in recent weeks as rising regional and global supply has increasingly outpaced demand, reinforcing a broader narrative of oversupply. Producers in the region have added barrels at the same time as output continues to grow in the Americas, leaving Asian refiners with abundant alternatives and reducing pricing power for Middle Eastern grades. This has pushed key regional price differentials lower, leading Saudi Aramco to cut prices for its main Asian-bound crude to the lowest level in five years. Forecasts indicate that the imbalance will persist, with global supply growth expected to significantly exceed demand next year and production likely to remain above consumption through 2026. Faster unwinding of OPEC+ supply cuts, combined with rising inventories, is expected to keep pressure on prices and the forward curve in the months ahead.
On the technical side, the crude oil price has been in a bearish trend for the past couple of months, and it's currently testing the support of the lower boundary of the Bollinger Bands. The Stochastic oscillator is in extreme oversold levels, suggesting a potential bullish correction in the upcoming sessions, while the Bollinger Bands are sufficiently expanded, indicating that there is volatility to support any short-term sharp moves. The moving averages are also validating the overall bearish trend; however, there may be some bullish action for this week. If the bullish correction plays out, the first area of potential resistance may be seen around $60, which is both a psychological resistance level and the 38.2% Fibonacci retracement level of the weekly range.
Disclaimer: The opinions in this article are personal to the writer and do not reflect those of Exness

The downtrend in crude oil is unlikely to change.Multi - Dimensional Core Analysis
Supply - Demand Pattern: Oversupply Pressure Dominates, Insufficient Policy Support
The loose situation on the supply side persists. The International Energy Agency (IEA) has clearly indicated that global crude oil production will continue to outpace demand in the next two years, and the expectation of oversupply is suppressing the oil price trend. The existing production reduction scale of OPEC+ is unable to offset the output increment from non - OPEC+ countries. U.S. crude oil production remains at a high level steadily, and the substantial surplus of terminal fuel oil inventories further confirms the imbalance between supply and demand. On the demand side, dragged down by the weak global economy, the recovery momentum is sluggish and fails to form effective support for oil prices.
Geopolitics: Risk Premium Fades, Détente Expectations Exert Pressure
The peace talks between Russia and Ukraine have achieved a breakthrough, and the risk of conflict escalation has decreased, leading to a continuous decline in the geopolitical risk premium that previously boosted oil prices. The situation in the Middle East remains relatively stable, and there have been no disruptions to transportation through the Strait of Hormuz. In the short term, geopolitical factors may only trigger minor technical fluctuations in oil prices and are unlikely to reverse the downward trend.
U.S. Dollar Trend: Strong Momentum Unchanged, Sustained Suppressive Effect
The U.S. dollar index maintains a strong posture, which continuously suppresses crude oil priced in U.S. dollars. Uncertainties surrounding the Federal Reserve's policies linger, and expectations of interest rate cuts have not been clearly realized. The strength of the U.S. dollar has increased the procurement costs of non - U.S. dollar countries, further curbing the global demand for crude oil.
Technical Side: Clear Short - term Trend, Key Support Under Pressure
WTI crude oil shows a distinct downward trend on the daily chart, with the moving average system forming a short position arrangement. Short - term moving averages such as MA5 and MA10 all act as resistance levels. The RSI indicator hovers on the verge of an oversold zone without any sign of a reversal. The MACD indicator remains in a bearish state. The key support range around $57 is facing a severe test; once this level is broken, it will open up room for further decline in oil prices.
Next week's crude oil trading strategy
sell:58.2-57.7
tp:57-56.5
sl:59

OIL analysisOIL has formed a butter fly harmonic pattern and it reacted and made positive reversal if it played well i think the target is 60$
Technical research and market hypotheses shared here are for educational purposes only. This content does not constitute financial advisory or a solicitation to trade. ⚖️

US OIL | Breakdown Below $56 – Lower Wedge Support in FocusCrude remains under pressure as growth concerns and supply uncertainty keep rallies capped. The broader trend still favours caution.
Price has now broken below the $56 area, a level that had been acting as near-term support. Structurally, US Oil continues to trade within a falling wedge, with price pressing toward the lower boundary.
Scenarios:
If $56 stays capped: downside pressure could persist, with scope for a move into the $49–50 region, aligning with the lower bound of the falling wedge.
If price reclaims $56: this would signal a potential false breakdown, opening the door for mean reversion back toward the mid-wedge area.
The $56 level is now the key inflection point — acceptance below it keeps focus on the $49–50 support zone tied to the wedge structure.

Crude Oil Falls to Its Lowest Level in 8 Months!Oil prices rebounded by more than 1% after declining and touching their lowest levels since April 7, 2025, supported by political escalation from the United States against Venezuela. This came after U.S. President Donald Trump announced a full blockade on sanctioned oil tankers entering or leaving Venezuela, along with designating the government of President Nicolás Maduro as a foreign terrorist organization.
This decision renewed concerns over supply disruptions, pushing WTI crude to rise near $56 per barrel, while Brent crude climbed above $59, ending a four-session losing streak.
Venezuela currently exports around 590,000 barrels per day, most of which goes to China.
Although these volumes are relatively small compared to global demand, any prolonged disruption could force buyers to seek higher-cost alternatives. Estimates suggest that around 30% of Venezuelan shipments could be at risk if sanctions are further tightened.
Nevertheless, the market reaction remained relatively limited, amid expectations of a continued global supply surplus due to increased production from the OPEC+ alliance, weak demand, and the possibility of easing sanctions on Russian oil should a peace agreement be reached in Ukraine.
In short, the current rise in oil prices is driven by short-term geopolitical factors, while fundamental pressures related to oversupply and weak demand continue to cap any sustainable gains. Stronger catalysts are needed to change the overall trend, most notably a recovery from China, the world’s second-largest oil consumer, which could partially lift global demand.
Technical Outlook for Crude Oil Prices
Crude oil prices are trading within a general downtrend, forming lower highs and lower lows. All geopolitical tensions and fundamental events remain limited in impact, and the only factor capable of reversing the overall trend would be a significant increase in global demand and a decline in supply.
As long as prices remain below 56.934, the bearish scenario stays intact. The current corrective move may end after testing the 56.535 level, followed by a renewed decline targeting the 55 level once again.
On the other hand, a positive technical signal in the short to medium term would require prices to rise above 56.934 and form a higher high above this level on the 4-hour timeframe, which could push prices to rise temporarily.

Oil Slides as Demand Weakness Dominates – $45 Support in FocusOil prices remain under pressure after breaking the key psychological USD 60 level, a move that has clearly shifted sentiment to the downside. The market is now struggling around the USD 56 zone, which is acting as near-term support. Failure to hold this area could open the door to a deeper sell-off.
Fundamentally, demand concerns continue to dominate. Economic data from major consumers points to slowing growth, with weak manufacturing activity and softer transport demand weighing on crude consumption. Even a weaker U.S. dollar has failed to provide support, underlining how fragile demand expectations currently are.
Additional pressure comes from the supply side. High U.S. production levels and resilient shale output are keeping the market well supplied, while inventories have remained elevated. OPEC+ discipline is being questioned by traders, especially as some members continue to exceed production quotas. At the same time, reduced geopolitical risk premiums are removing another layer of support that previously held prices higher.
From a technical perspective, momentum remains bearish after the break below USD 60. If the market fails to stabilize above USD 56, the next major support does not appear until the USD 45 zone. Unless demand expectations improve meaningfully or supply tightens, oil prices may remain under pressure in the near term.
Major next levels, where the market might turn bullish again can be seen in the boxes in the chart. Prices might eventually slide down towards the USD 15 level, as the market has not traded around that zones for a long time.

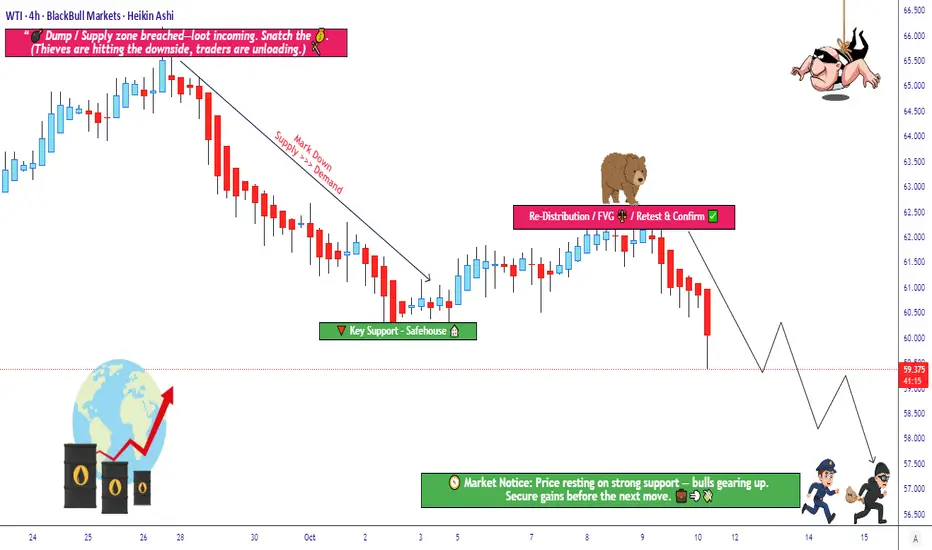
Is Crude Oil Setting Up for a Major Bearish Reversal?🛢️ XTI/USD “WTI” – Bearish Redistribution Zone Incoming (Thief Strategy Inside)
📉 Setup Overview
Market: XTI/USD (WTI crude oil)
Bias: Bearish confirmed — we’re looking for re-distribution / supply pressure to take control
Trade Type: Swing / Day Trade hybrid
🎯 Entry Plan (Thief-Layer Strategy)
I use a layering / multiple limit order approach (aka “Thief Strategy”). You may use any price level as entry, but here’s my preferred ladder:
Sell Limit @ 61.500
Sell Limit @ 61.000
Sell Limit @ 60.500
Sell Limit @ 60.000
Sell Limit @ 59.500
(You may extend more layers if you like)
You don’t need to hit all layers — just get partial fills, ride the move downward.
🚫 Stop Loss
Thief’s SL: 62.500
⚠️ Note to Thief OG’s: I’m not forcing you to follow my SL. You choose what works. Make money, take money — at your own risk.
🎯 Target
We see police barricade as a strong support zone + oversold trap possibility.
So primary target: 57.000
⚠️ Note to Thief OG’s: Don’t blindly hold to my TP. If price gives you your gains early, escape with your money — don’t wait for perfection.
🔍 Related Pairs & Correlations
AMEX:USO or USOIL (oil ETFs / indices) – real-world crude correlation
$BRENT/USD – watch for strength or weakness divergence
AMEX:XOP / AMEX:OIH (oil & gas sector indices) – sentiment in energy names
Key point: if Brent weakens while WTI breaks down, it reinforces the bias.
📌 Key Technical Notes
We’re waiting for ** redistribution / supply zone** to hold — a retest or failure bounce is ideal setup.
Oversold conditions + a “trap” candle (fake breakout) strengthen the move.
Use layering to average in, not “all-in” at once.
Be ready for whipsaws around support zones; partial exits can help.
✨ “If you find value in my analysis, a 👍 and 🚀 boost is much appreciated — it helps me share more setups with the community!”
Disclaimer: This is Thief-style trading strategy just for fun. I am not giving financial advice. Trade at your own decision and risk.
#WTI #CrudeOil #XTIUSD #EnergyTrading #OilStrategy #Layering #SwingTrade #DayTrade #BearishBias #ThiefStrategy
Crude Oil short...GM gents, hope you're doing alright.
It seems Crude Oil was not cheap enough, technicals indicate it can crater from here for the next 2 months give or take...
Implications on macro are bullish risk assets, with some lag after the effect of cheaper energy materializes on earnings. For now the 70% spike in Nat Gas needs to be dealt with, although it seems that market topped already.
Signal is invalidated above the red dashed line.
Best of luck!
Cheers,
Ivan Labrie.

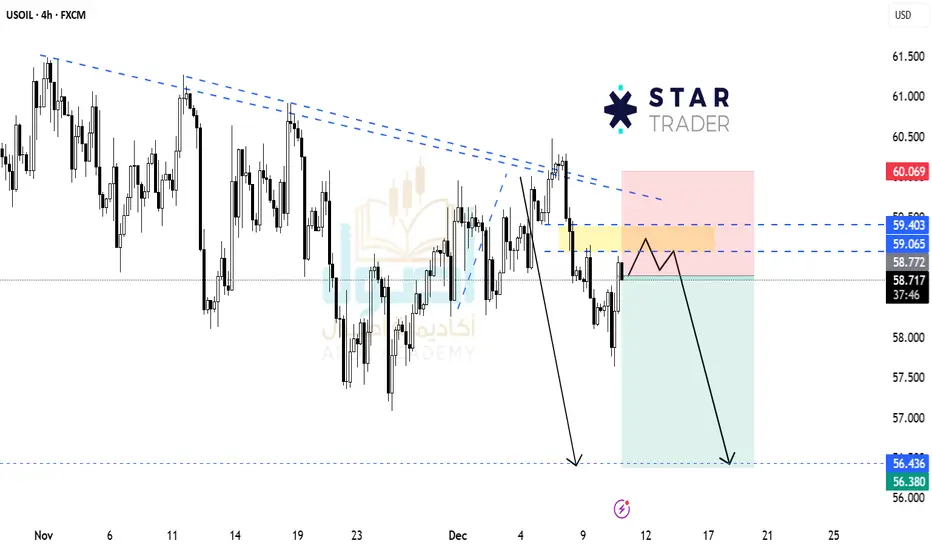
WTI Crude “total and complete blockade” of sanctioned oilThe WTI Crude continues to display a bearish outlook, in line with the prevailing downward trend. Recent price action suggests a corrective pullback, potentially setting up for another move lower if resistance holds.
Key Level: 5830
This zone, previously a consolidation area, now acts as a significant resistance level.
Bearish Scenario (rejection at 5830):
A failed test and rejection at 5830 would likely resume the bearish momentum.
Downside targets include:
5500 – Initial support
5400 – Intermediate support
5290 – Longer-term support level
Bullish Scenario (breakout above 5830):
A confirmed breakout and daily close above 5830 would invalidate the bearish setup.
In that case, potential upside resistance levels are:
5900 – First resistance
5960 – Further upside target
Conclusion
WTI Crude remains under bearish pressure, with the 5830 level acting as a key inflection point. As long as price remains below this level, the bias favours further downside. Traders should watch for price confirmation around that level to assess the next move.
This communication is for informational purposes only and should not be viewed as any form of recommendation as to a particular course of action or as investment advice. It is not intended as an offer or solicitation for the purchase or sale of any financial instrument or as an official confirmation of any transaction. Opinions, estimates and assumptions expressed herein are made as of the date of this communication and are subject to change without notice. This communication has been prepared based upon information, including market prices, data and other information, believed to be reliable; however, Trade Nation does not warrant its completeness or accuracy. All market prices and market data contained in or attached to this communication are indicative and subject to change without notice.

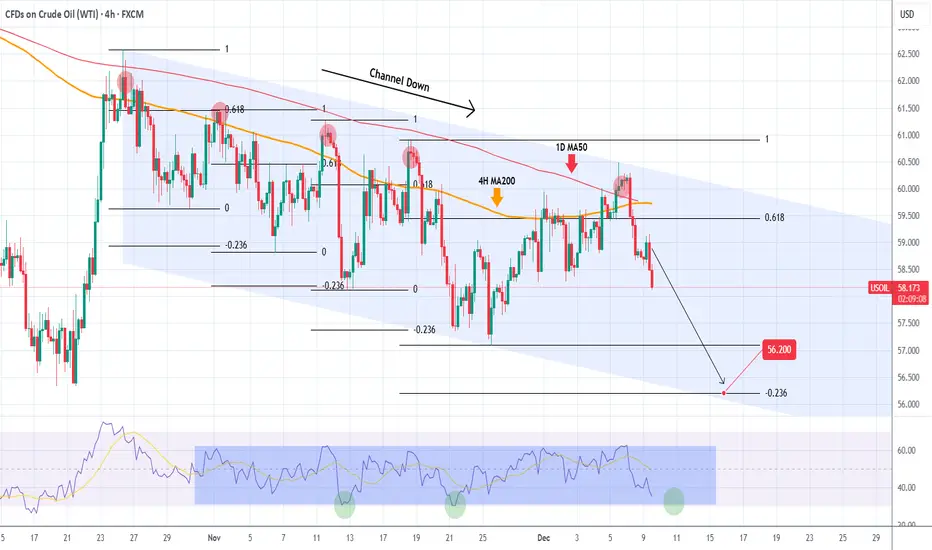
WTI OIL 1.5 month Channel Down started new Bearish Leg.WTI Oil (USOIL) has been trading within a 1.5-month Channel Down (since the October 4 High), that priced last Friday its latest Lower High, this time above the 1D MA50 (red trend-line).
That initiated the new Bearish Leg (also confirmed by the 4H RSI rejection at the top of its range). All 4 previous Bearish Legs bottomed just when the hit the -0.236 Fibonacci extension.
Based on that, we are expecting WTI to make a new Lower Low at 56.200.
---
** Please LIKE 👍, FOLLOW ✅, SHARE 🙌 and COMMENT ✍ if you enjoy this idea! Also share your ideas and charts in the comments section below! This is best way to keep it relevant, support us, keep the content here free and allow the idea to reach as many people as possible. **
---
💸💸💸💸💸💸
👇 👇 👇 👇 👇 👇