USOIL Trading IdeaBased on Simple Technical Analysis ( Trendline + Support & Resistance )
Risk Disclaimer:
Please be advised that I am not telling anyone how to spend or invest their money. Take all of my analysis as my own opinion, as entertainment, and at your own risk. I assume no responsibility or liability for any errors or omissions in the content of this page, and they are for educational purposes only. Any action you take on the information in this analysis is strictly at your own risk. There is a very high degree of risk involved in trading. Past results are not indicative of future returns. Good luck :-)
Trade ideas
USOIL – Downtrend Still IntactUSOIL remains fundamentally weak with technical confirmation of a prevailing downtrend. Short-term pullbacks are likely corrective and may provide better short-entry setups.
Resistance levels:
59.14
60.36
61.91 (Ultimate)
Support levels:
54.81
53.13
51.95 (Ultimate)

WTI Oil: $66 Back on the Cards as Sanctions BiteWTI crude extends its rally this morning after fresh U.S. sanctions on Rosneft and Lukoil sparked renewed supply concerns. The EU’s latest package added to the bullish momentum, sending prices sharply off the $56–57 demand zone.
Technically, the point of control (POC) from the recent volume profile aligns perfectly with the $65.50–66.00 resistance, suggesting this is where price may stall or consolidate before deciding the next leg.
Momentum remains strong, volume is rising, and bulls are clearly in control. As long as WTI holds above $60, a push into $66 looks likely — but expect sellers to reappear at that POC zone.cards — especially as the market reprices geopolitical risk and short-term supply tightness.
Key Levels:
Support: $57.00 / $60.00
Resistance: $62.50 / $65.50–66.00
Next target: $66.00


The US-Oil will jump from the historic Support LevelHello Traders
In This Chart US-OIL HOURLY Forex Forecast By FOREX PLANET
today US-OIL analysis 👆
🟢This Chart includes_ (US-OIL market update)
🟢What is The Next Opportunity on US-OIL Market
🟢how to Enter to the Valid Entry With Assurance Profit
This CHART is For Trader's that Want to Improve Their Technical Analysis Skills and Their Trading By Understanding How To Analyze The Market Using Multiple Timeframes and Understanding The Bigger Picture on the Charts
USOIL - Bullish ReversalUSOIL has formed falling wedge and double bottom and currently testing the neckline. Entry above last lower high.
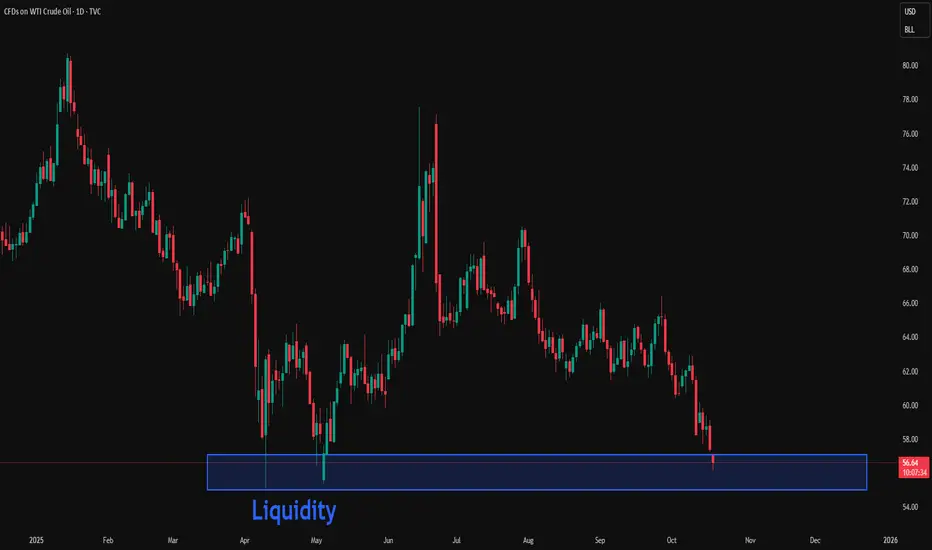
USOIL: Waiting for a liquidity sweep on the Daily timeframeIn my previous analyses on USOIL, including the fundamental outlook, price has been trending lower within a narrow channel between $70 and $50.
I’m looking for a buy opportunity on higher timeframes after a large liquidity sweep.
Weekly Outlook:
* Trend: assessed using at least three trend indicators, with market structure as the primary guide.
** Weak or Reversal Signals: Assessed based on one of our criteria for trend reversal signals.
*** Support/Resistance: Selected from multiple factors – static (Swing High, Swing Low, etc.), dynamic (EMA, MA, etc.), psychological (Fibonacci, RSI, etc.) – and determined based on the trader’s discretion.
**** Our advice takes into account all factors, including both fundamental and technical analysis. It is not intended as a profit target. We hope it can serve as a reference to help you trade more effectively. This advice is for informational purposes only and we assume no responsibility for any trading results based on it.
George Vann @ ZuperView

Crude Oil Outlook: Pressure Mounts as 2025 Lows Come Into ViewCrude oil prices are tracing another plunge back to yearly lows amid mounting oversupply, weak demand, and tariff concerns. New 2025 lows may be reached in the short-term horizon, aligning with the lower boundaries of a 3-year down trending channel
From a weekly time frame perspective, crude oil is facing the lower border of a three-year descending channel extending from the 2022 highs. The $55 support currently holds as the 2025 low, but a clean break below it could extend losses toward the $49 zone, aligning with the channel’s bottom boundary — a potential area of support. If this level fails, a deeper selloff could extend toward the $37 region.
On the upside, should prices recover above the $58 mark, a bullish rebound may extend toward $60, $63, and $66, respectively. However, for a sustainable bullish outlook on crude, a breakout above both the three-year downtrend and the $70 resistance is required.
Looking closely at the daily RSI, it is nearing oversold levels last seen in April 2025, suggesting that downside momentum could be approaching exhaustion.
In line with the recent movements of U.S. indices, will we see another dip-and-rebound scenario on crude oil — not identical, but perhaps reminiscent of April 2025?
- Written by Razan Hilal, CMT

Today's crude oil strategy, hoping to be helpful to you.Although the current broader context of the international crude oil market is "excess supply and weak demand", from the perspective of short-term and potential opportunities, there are three key points that support us to attempt a long position. We should not be deterred by the broader "weak market" trend:
Potential "Flashpoints" in Geopolitical Conflicts
Ukraine has not stopped using drones to attack Russia's oil facilities, and Russia's oil refining volume has now hit its lowest level in over two years. If key pipelines are attacked next, or if conflicts between Israel and Qatar in the Middle East escalate further, affecting crude oil transportation, the market will definitely rush to buy oil out of panic. In this case, oil prices will most likely surge suddenly. For example, back in June, when Israel launched an air strike on Iran's nuclear facilities, oil prices rose by 6.9% in a single day. We must seize such opportunities.
Possible "Hitches" in OPEC+ Production Increase
Although OPEC+ plans to increase supply by an additional 137,000 barrels per month in October and November, many oil-producing countries actually have little extra oil to produce. As early as May, the actual production increase was more than half lower than the planned amount. If OPEC+ announces "no more production increases" in subsequent meetings, or even resumes production cuts, the pressure from excess supply will be reduced significantly, and oil prices will naturally be able to hold steady or even rise.
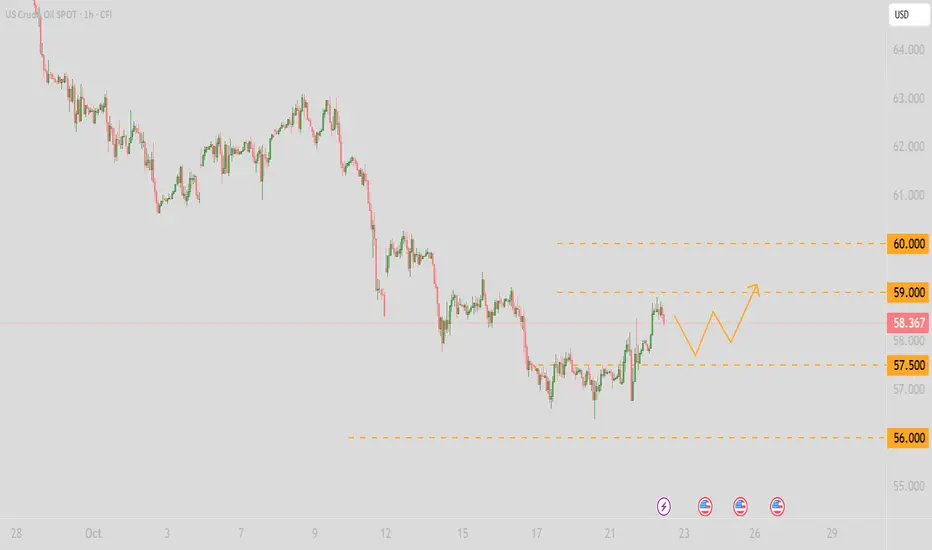
Crude Oil Trading Strategy for Today
usoil @buy 57.50-58.00
pt:58.50-59
sl:57

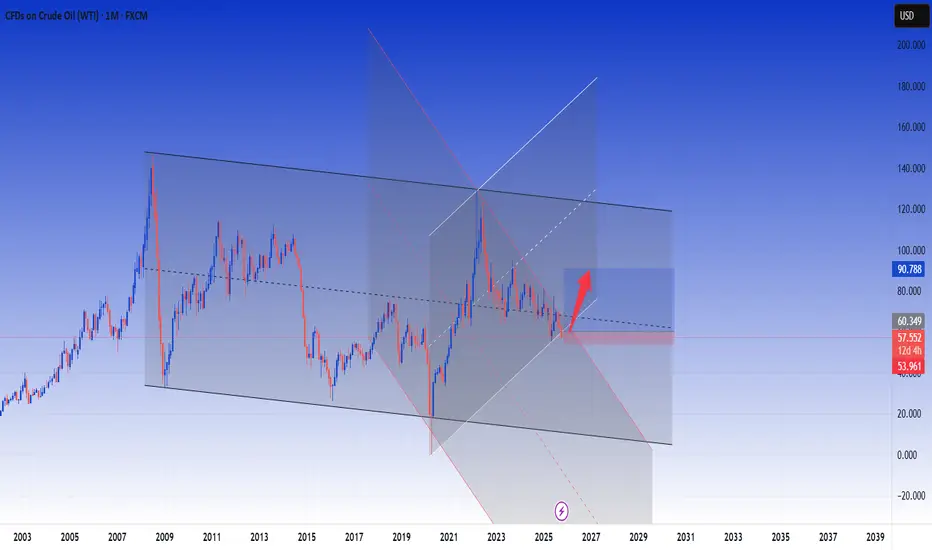
Crude Oil Approaches End of Elliott Wave PatternAbove, is the video review for Crude Oil.
Taking a look at the longer perspective, a multi-year ending diagonal pattern is nearing its end.
The weekly chart for TVC:USOIL suggests the decline is wave 5 of a 5-wave diagonal. The 61% Fibonacci retracement level sits near $49. We're anticipating a bullish reversal between current prices and $49 to carry up to new all-time highs over the coming years.
Looking at a clusters of wave relationships and market geometry, I'd like to see Crude Oil reach the yellow box and punch new lows, but it doesn't have to.
If prices fall further, then the 61% Fib level at $49 may provide support.

USOIL fluctuates higher💡The situation for USOIL today is relatively optimistic, showing a fluctuating and moderately strong trend. Here is the detailed analysis:
📈Price Trend: As of midday in the Asian session on October 22, WTI crude oil prices have edged higher in the short term, trading around $58.1, up from the previous day's closing price. WTI crude closed 1.14% higher at $57.962 the previous day.
♦Influencing Factors:
Supply Side: The U.S. Department of Energy announced a tender to purchase 1 million barrels of crude oil to replenish the Strategic Petroleum Reserve. This news boosted sentiment in the energy sector and provided support for oil prices.
♦Demand Side:
API data showed a decline in U.S. inventory levels last week, which improved market sentiment toward demand and also supported higher oil prices.
♦Macroeconomy: Expectations of a Federal Reserve rate cut continue to rise, with a 98.9% probability of a 25-basis-point rate cut in October. Capital has been flowing back into risk assets, providing some impetus to crude oil prices.
♦Geopolitics:
Europe and Ukraine have drafted a 12-point ceasefire plan. Expectations of eased geopolitical tensions temporarily weakened safe-haven demand, indirectly supporting a stronger U.S. dollar and thus exerting some pressure on oil prices. However, factors such as the U.S. oil purchase news and the drop in API crude inventories have provided more significant support for oil prices.
♦Technical Analysis:
Short-term moving averages show signs of flattening, indicating that the crude oil price trend may be stabilizing. Oil prices are inclined to fluctuate with moderate strength in the short term today. The short-term resistance level above is around 59.0-60.0, while the short-term support level below is around 56.0-55.0.
💎Trading Strategy:
Sell 58.00 SL 58.60 TP 57.00
Buy 57.5 SL 56.8 TP 58.5
Daily-updated accurate signals are at your disposal. If you run into any problems while trading, these signals serve as a reliable reference—don’t hesitate to use them! I truly hope they bring you significant assistance
USOIL BULLS ARE STRONG HERE|LONG
USOIL SIGNAL
Trade Direction: short
Entry Level: 57.23
Target Level: 59.72
Stop Loss: 55.57
RISK PROFILE
Risk level: medium
Suggested risk: 1%
Timeframe: 12h
Disclosure: I am part of Trade Nation's Influencer program and receive a monthly fee for using their TradingView charts in my analysis.
✅LIKE AND COMMENT MY IDEAS✅

USOIL WTIthe current price of WTI crude oil (USOIL) stands around $62.050 to $62.31 per barrel, reflecting a recent rise of about 4.97% compared to previous days. The market has experienced volatility driven by geopolitical tensions and US sanctions on major Russian oil companies, which impact global supply dynamics.
Key Factors Affecting USOIL and Oil Trade Policies
Geopolitical Influences and Sanctions:
US sanctions on Russian oil firms such as Rosneft and Lukoil continue to tighten global supply access, especially affecting supply to large importers like China and India. These sanctions heighten supply-side risks and contribute to price volatility.
US Oil Production and Domestic Policies:
The US remains one of the top global oil producers, with policies encouraging increased output (“drill, baby, drill” style) to ensure energy security and moderate prices domestically while using energy exports as geopolitical leverage.
Trade Agreements and Tariffs:
Trade discussions, such as US-India negotiations, aim to reduce tariffs and expand energy trade, influencing crude demand and pricing. Tariffs and trade restrictions remain important policy tools that may alter trade flows and market access.
OPEC and IEA Production Forecasts:
Global supply forecasts have been revised upward, with expectations of growth to 106-108 million barrels per day by 2026. OPEC production strategies continue to influence market balance and price direction.
Market Volatility and Demand Outlook:
Economic uncertainties, inflation concerns, and shifts toward renewable energy impact demand projections. Demand growth for 2025-2026 has seen downward revisions amid these mixed signals.
Overall, USOIL prices and global oil trade in 2025 are shaped by a complex interplay of geopolitical sanctions, domestic production policies, trade agreements, and evolving market demand, creating significant price volatility and trade flow shifts.
#OIL #WTI #CRUDEOIL #GAS

Review of USOIL's Performance This Week📝This week, the USOil market exhibited a highly volatile pattern of "first bottoming out and stabilizing, then rebounding driven by geopolitical factors". The competition between supply-demand fundamentals and sudden geopolitical events dominated the market trend throughout the week. Details are as follows:
💡Price Movement: From Approaching Annual Lows to Intraday Surges, Volatility Within Ranges Intensifies
1. Bottoming Out Early in the Week
On Monday, USOil continued its weak oscillation. It opened at $57.32 per barrel, dipped to a low of around $56 per barrel (approaching the 2025 annual low of $55.12), and finally closed at $56.93 per barrel, down $0.61 from the previous trading day.
From Tuesday to Wednesday, as panic eased, prices gradually stabilized and rebounded. It closed at $57.58 per barrel on Tuesday; on Wednesday, boosted by geopolitical expectations, it surged by $3.25 in a single day to close at $61.75 per barrel, with trading volume rising to 711,600 lots.
2. Rebounding and Then Retreating in the Latter Half of the Week
On Thursday, the official release of detailed EU and U.S. sanctions on Russian energy triggered a strong market reaction. USOil opened at $59.94 per barrel and then jumped, peaking at $62.59 per barrel with an intraday gain of nearly 5%, before closing at $61.44 per barrel.
On Friday, after the earlier rebound, prices entered a consolidation phase, fluctuating narrowly around $62. For the whole week, it rebounded by over 10% from the previous week’s low.
💡Core Influencing Factors:
1. Bearish Drivers: Sustained Supply-Demand Easing Suppresses Oil Prices
✔Worsening Supply Glut
✔Weak Demand Weighs on Prices
2. Bullish Disturbances: Geopolitical Sanctions Trigger a Phased Rebo
💡Technicals and Market Sentiment: Recovery After Oversold Conditions, Persistent Long-Short Divisions
1. Divergent Signals from Technical Indicators
2. Intense Battles Around Key Levels
The support at the annual low of $55.12 proved effective, serving as the starting point for the week’s bottoming and rebound. The resistance levels at $58 and $62 were breached one after another, but the resistance from the $63 level and the 70-dollar trend line still posed long-term pressure. A breakthrough would require sustained improvement in fundamental
💡Outlook: Short-Term Oscillations Unlikely to Reverse Long-Term Weak Trend
💎Short-Term Perspective: Geopolitical risk premiums and technical recovery after oversold conditions may support oil prices to fluctuate within the $58-$63 range. If the supply gap caused by sanctions continues to widen, it may test the resistance level of $66.
💎Long-Term Perspective: The IEA predicts that Brent crude oil prices will range between $52-$60 in 2026. Core contradictions such as loose supply-demand, accelerated energy transition, and approaching demand peaks remain unresolved. If the support at $55 is broken, it may fall to the deep correction range of $49 or even $37.
The market should focus on whether OPEC+ will adjust its production increase plan at the November 2 meeting and the impact of global manufacturing PMI data on demand expectations.
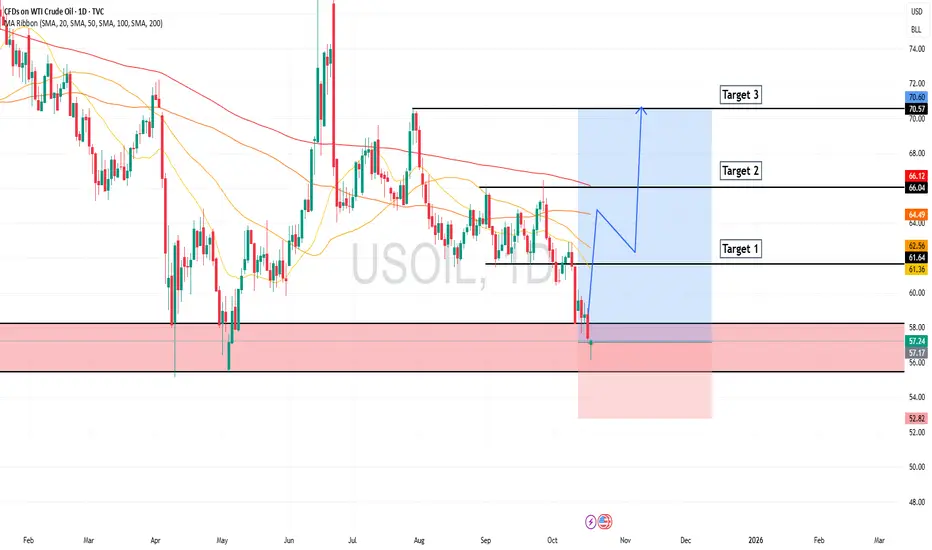
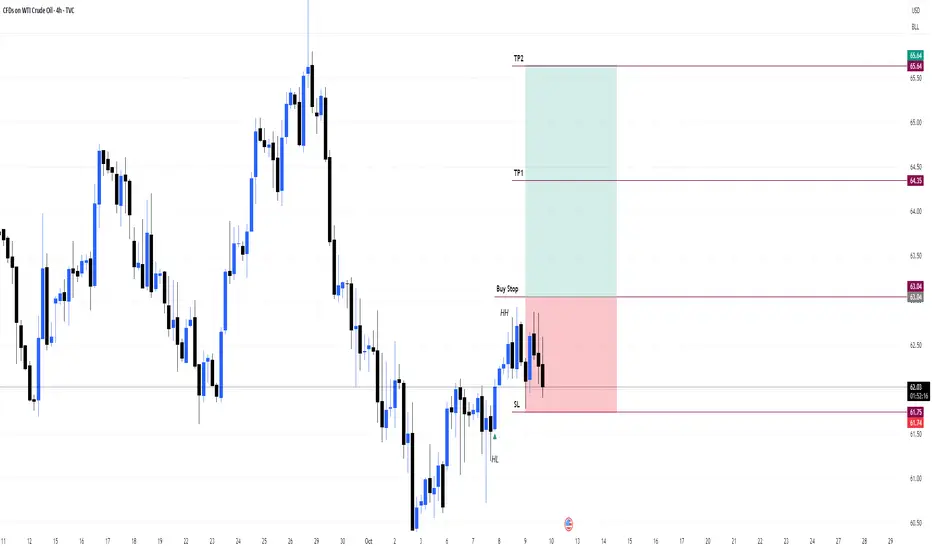
USOILPrice recently formed a Higher High, confirming bullish momentum.
Currently, price is pulling back and forming a Higher Low, maintaining the uptrend structure.
📈 Buy Stop placed above the previous Higher High, anticipating a breakout continuation.
🛑 Stop Loss set just below the Higher Low, where price previously reversed.
🎯 Risk to Reward: 1:2, aiming for a favorable reward relative to the risk.
Structure: Bullish (HH + HL)
Entry Type: Breakout Entry
Confirmation: Structure + Buy Stop Strategy
SL: Below HL | TP: 2x Risk
USOIL: Buy setups during higher-timeframe correctionOIL PRICE WEEKLY OUTLOOK
(Week of Oct 20-24, 2025)
Key Drivers & Risks
Updates in Supply, Demand, and Geopolitical News
EIA (week ending Oct 10): Crude inventories +3.5 million bbl; distillates −4.5 million bbl.
IEA OMR (Oct 2025): Upgraded global supply forecast: +3.0 mb/d in 2025 and +2.4 mb/d in 2026, while demand grows only ~0.7 mb/d per year ⇒ signaling a large surplus risk and downward pressure on prices.
OPEC (Oct 2025): Maintains demand growth outlook of +1.3 mb/d for 2025, but acknowledges a smaller deficit in 2026 as OPEC+ output rises; September production increased by ~630 kb/d.
Maritime risk in the Red Sea / Gulf of Aden: Over the weekend, a gas carrier reportedly caught fire following a possible attack off Yemen’s coast, leading to higher shipping risk premiums, though no major disruption to trade flows has been reported yet.
Watchlist for the Week Ahead
EIA Weekly Report (Oct 22): Focus on crude and distillate inventories, and any signs of policy or flow adjustments.
Maritime security updates in the Red Sea / Gulf of Aden / Strait of Hormuz — monitor frequency and severity of incidents.
China data: imports, refinery runs, and inventories — potential signals of stockpiling at lower price levels.
Any notable demand-side surprises (if any emerge).
Overall View
Oil prices are expected to gradually decline within a relatively narrow range of $70–$50 through mid-2026.
Short-term rebounds may occur due to low price levels and heightened transport risk headlines.
China’s potential restocking activity could provide limited demand-side support.
* Trend: assessed using at least three trend indicators, with market structure as the primary guide.
** Weak or Reversal Signals: Assessed based on one of our criteria for trend reversal signals.
*** Support/Resistance: Selected from multiple factors – static (Swing High, Swing Low, etc.), dynamic (EMA, MA, etc.), psychological (Fibonacci, RSI, etc.) – and determined based on the trader’s discretion.
**** Our advice takes into account all factors, including both fundamental and technical analysis. It is not intended as a profit target. We hope it can serve as a reference to help you trade more effectively. This advice is for informational purposes only and we assume no responsibility for any trading results based on it.
George Vann @ ZuperView
USOIL: Bears Are Winning! Short!
My dear friends,
Today we will analyse USOIL together☺️
The in-trend continuation seems likely as the current long-term trend appears to be strong, and price is holding below a key level of 61.394 So a bearish continuation seems plausible, targeting the next low. We should enter on confirmation, and place a stop-loss beyond the recent swing level.
❤️Sending you lots of Love and Hugs❤️

USOILIF OIL bull can break and close 65$ level than oil could rise into 70-75k from the projection.
#usoil #wti

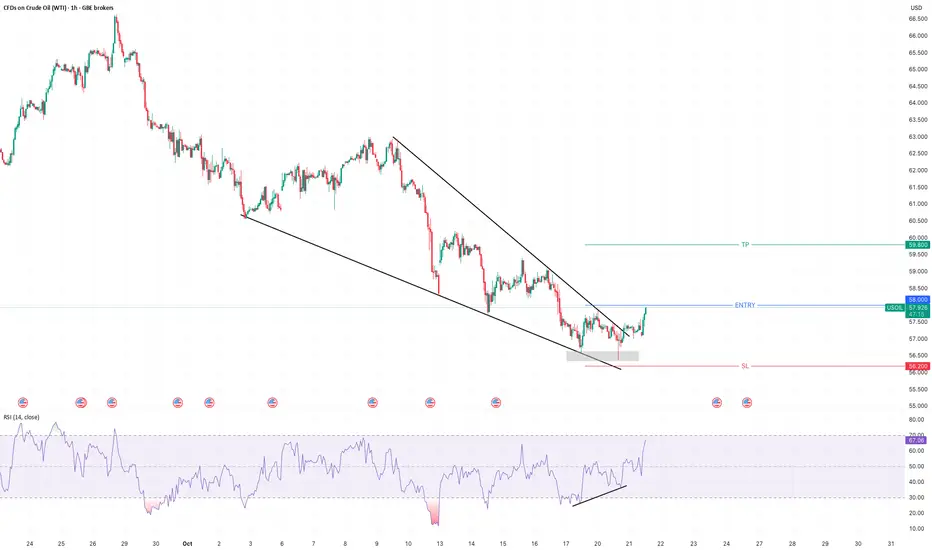
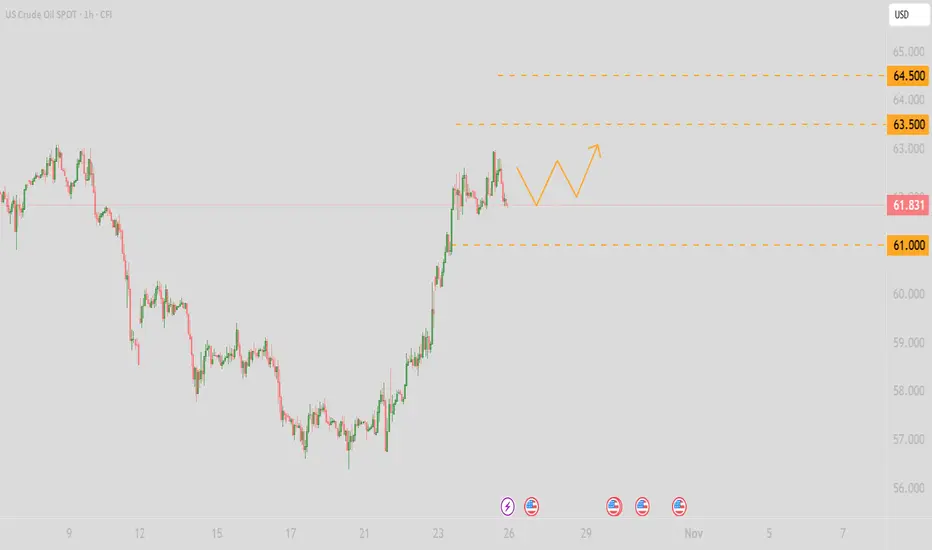
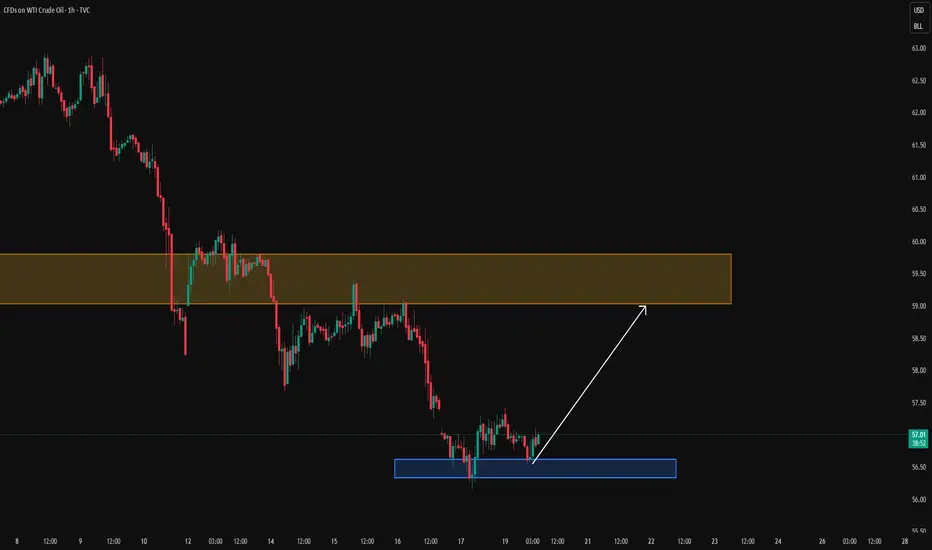
OilPrice is trying to break out of a downtrend channel after forming a base around $56.5–$57.
Resistance: $58 (short-term), $59.8, and $63 (major).
Support: $56.5–$57 zone.
Volume shows buying interest near the lows — early sign of accumulation.
If price holds above $58, it could aim for $59.8–$63.
If it fails, a pullback toward $56.2–$55.5 is likely.
➡️ Bias: Mildly bullish if $57.8–$58 holds; otherwise, range-bound to bearish continuation.

Hellena | Oil (4H): SHORT to support area of 56-57.Colleagues, price is actively moving in a downward direction and I believe the move is not yet complete.
Earlier I saw this move as a big correction, but now the structure is more of an impulsive one. This means that the price is moving in the wave “3” of the higher order (Red), which should be completed soon.
For this to happen, the price needs to complete the correction in the wave “4” of medium order and then update the low, reaching the support area of 56-57.
The extension of wave “3” is possible - then the price will reach the target without correction.
Fundamental context
Global oil inventories are forecast to rise through 2025, putting downward pressure on prices despite efforts by some producers to restrain output.
OPEC+ has been increasing production again, which adds to the supply burden.
Meanwhile, demand forecasts have been trimmed amid softer economic growth indicators in key consuming regions.
Major banks have lowered long-term price expectations for crude — the balance is tilting toward a more bearish outlook.
Manage your capital correctly and competently! Only enter trades based on reliable patterns!

WTI crude oil Wave Analysis – 17 October 2025
- WTI crude oil reversed from strong support level 56.00
- Likely to rise to resistance level 58.00
WTI crude oil recently reversed from the support area between the strong support level 56.00 (which reversed the price in April and May, as can be seen below) and the lower daily Bollinger Band.
This support area was further strengthened by the support trendline of the daily down channel from August.
Given the strength of the support level 56.00 and the oversold daily Stochastic, WTI crude oil can be expected to rise to the next resistance level 58.00.

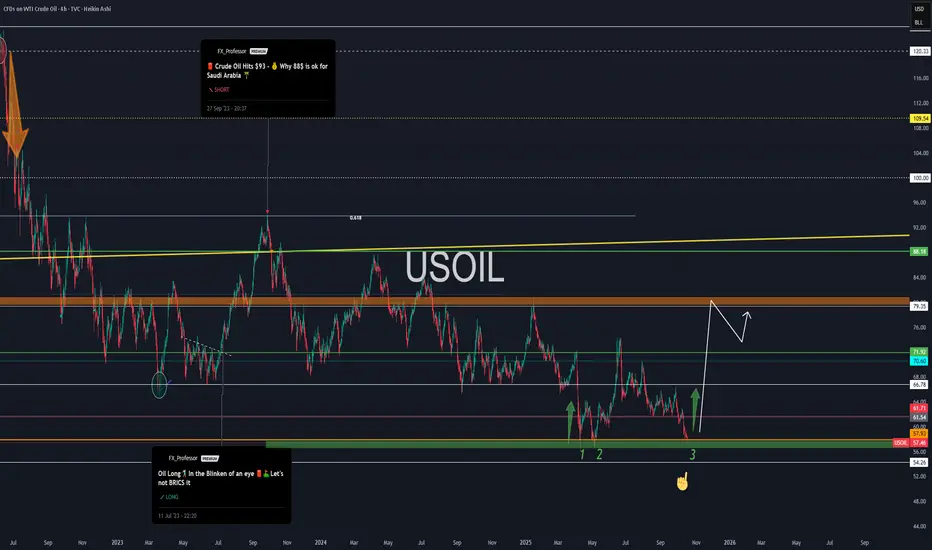
Time to Fill Up Those Tanks — WTI Reversal in PlayTime to Fill Up Those Tanks — USOIL Reversal in Play 🛢️📈
Everyone’s watching tech, AI, Bitcoin, and gold.
But let’s be real: none of that moves without oil.
We all need black energy — whether you call it crude, petroleum, or the global bloodstream of industry. And today, we’re looking at a setup that says:
“It might be time to fill those tanks — literally and financially.”
🔄 From Short to Long — Here's Why
🧠 Back in Sept 2023, I was publicly SHORT from $93 — “Why 88 is OK for Saudi Arabia” . Clean fade.
But now? We’ve hit my 3-touch support zone at ~$57 — and the structure screams reversal.
📌 1… 2… and now 3.
• Triple bottom territory
• RSI divergence
• Crude sentiment at peak despair
• Geopolitical fog + supply cut whispers
This is the part of the cycle where crude likes to rip when nobody’s looking.
🔍 Technical Breakdown
• 🟩 Demand base: $56–57 zone (strong 3-touch support)**
• 🎯 Target: $79.35 (next major resistance zone)**
• 🛑 Invalidation below $54.26 = abort the trade idea
If the reversal starts here, I expect a rally into Q1 2026 — possibly exaggerated by global supply dynamics.
🌍 Macro Lens
• OPEC still tight
• U.S. SPR not refilled
• Geopolitics = foggy at best
• Seasonal energy demand rising
• Biden vs Trump = policy shake-up incoming
Forget narratives — crude is telling its own story.
💡 Thought of the Day 💡
Everything we build, move, ship, and mine — starts with oil.
It’s not going away. It’s just waiting to be priced correctly again.
You may love AI, but it still runs on diesel in the real world.
One Love,
The FXPROFESSOR 💙