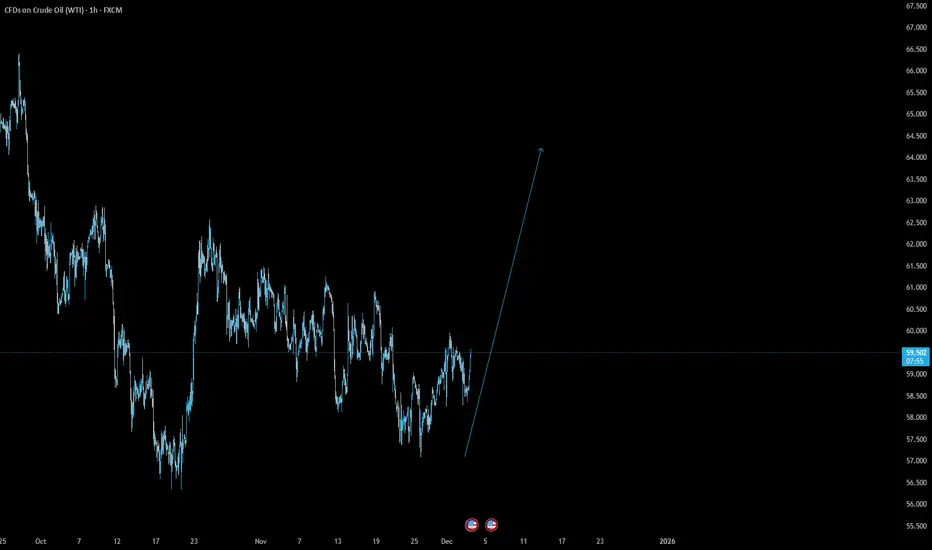
Next UP OIL, i think its time to change direction nowwe are gonna be buying oil again very soon, i dont think it will go much high as it used to be while Trump is in charge but we are likely to see good profit on this,
targets are 65-69 for short term 78 for mid-long term and after that we will see how is everything shaping up.
Trade ideas

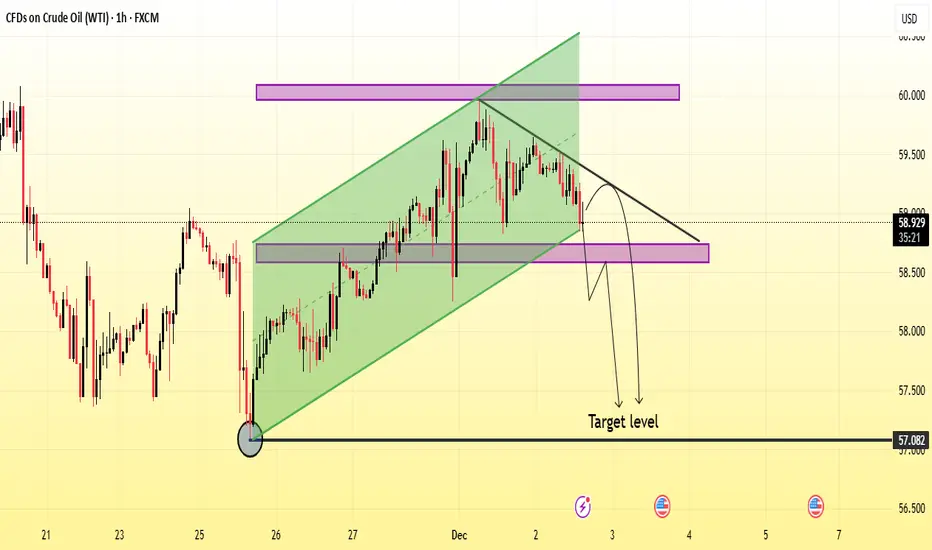
Usoil Next Selling Move Analysis Read the DescrpitionUSOIL with technical analysis drawn on it. A green rising channel highlights a previous uptrend, which has been broken downward. Pink horizontal zones mark resistance and support areas. A downward arrow points toward a labeled “Target level,” suggesting a bearish expectation after price breaks below the support zone.
❤️ please Kindly support with Boost and Comment i need your feedback ❤️
OIL: The Bearish Movement Could Resume AgainOIL: The Bearish Movement Could Resume Again
OIL tested a strong resistance zone near 60. This area corresponds also with a strong structure zone and also a psychological price that pushed the price down several times.
OPEC continues to increase the OIL production so the odds are to go down again
Key targets:
58.5
57.80
57.20
You may find more details in the chart!
Thank you and Good Luck!
❤️PS: Please support with a like or comment if you find this analysis useful for your trading day❤️

XTIUSD possible bullish scenario. Long XTIUSD has formed a descending triangle and price may break the resistance and go up . Let us see how it plays out .

WTI OIL targeting at least $56.00 on the short-term.WTI Oil (USOIL) continues to expand its 4-month Channel Down and has repeatedly been rejected on its 1D MA50 (blue trend-line) in the past 40 days.
As mentioned before, this is similar to September's price action, which eventually tested the previous Support before breaking it and move to a new Lower Low on the 1.5 Fibonacci extension.
As a result, we are still expecting to see $56.00 on the short-term.
---
** Please LIKE 👍, FOLLOW ✅, SHARE 🙌 and COMMENT ✍ if you enjoy this idea! Also share your ideas and charts in the comments section below! This is best way to keep it relevant, support us, keep the content here free and allow the idea to reach as many people as possible. **
---
💸💸💸💸💸💸
👇 👇 👇 👇 👇 👇

USOIL Will Go Lower! Short!
Here is our detailed technical review for USOIL.
Time Frame: 1h
Current Trend: Bearish
Sentiment: Overbought (based on 7-period RSI)
Forecast: Bearish
The market is trading around a solid horizontal structure 59.542.
The above observations make me that the market will inevitably achieve 58.960 level.
P.S
Please, note that an oversold/overbought condition can last for a long time, and therefore being oversold/overbought doesn't mean a price rally will come soon, or at all.
Like and subscribe and comment my ideas if you enjoy them!

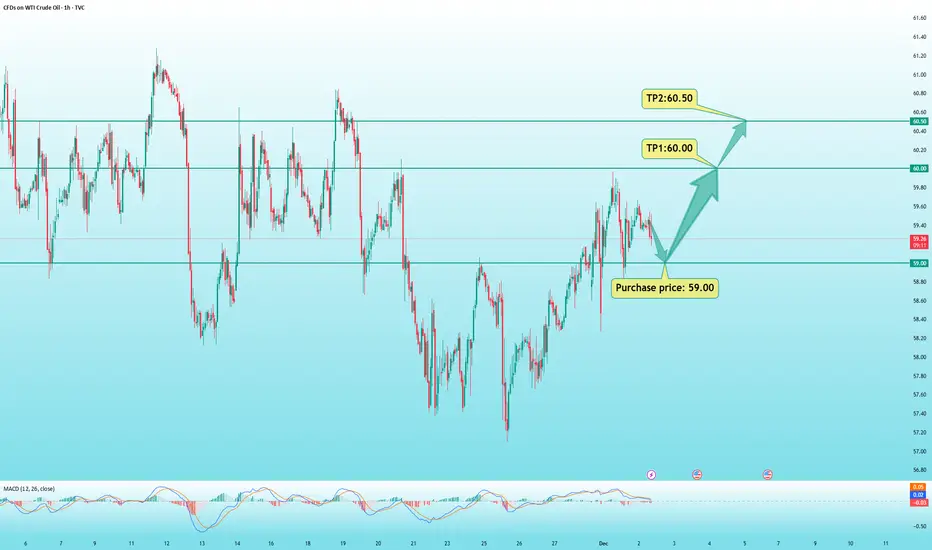
USOIL: Wait for a pullback to $59 to buy.During Monday’s Asian trading session, NYMEX West Texas Intermediate (WTI) crude oil futures rose 1.7%, trading around $59.30 per barrel. Oil prices opened strongly as OPEC+ agreed to halt production increases starting from Q1 2026, providing solid buying support at the open.
On the 1-hour chart, crude oil is showing high-level consolidation, with prices repeatedly oscillating around the moving average system, indicating a short-term neutral, range-bound objective trend.
However, from a subjective trend perspective, the bias remains to the upside. The MACD fast and slow lines have pulled back toward the zero axis and are about to form a bullish crossover, suggesting that bullish momentum is building.
There is a high probability that crude oil will break to new intraday highs today.
Intraday Trading Plan:
Buy near: $59.00
Take Profit 1: $60.00
Take Profit 2: $60.50
Stop-loss: Adjust based on individual risk tolerance
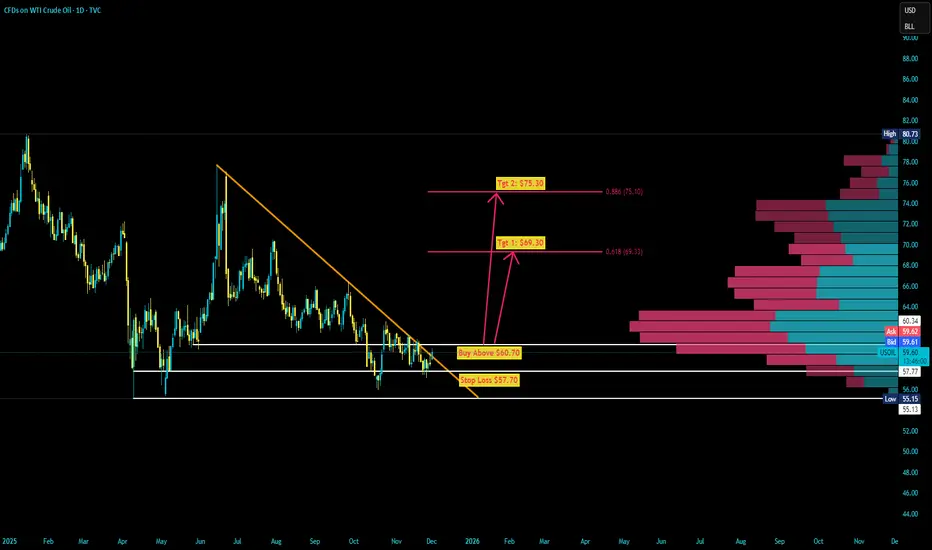
WTI/USD: Bullish Rally to 62.45?CFI:WTI is gearing up for a bullish rally on the 4-hour chart , with price rebounding from a key support zone near cumulative long liquidation levels, setting up a strong entry opportunity if buyers maintain control and push toward resistance amid recent consolidation. Entry from current levels could also be favorable with proper risk management.
Entry zone between 57.5-58.3 for a buy position. Target at 62.45 near resistance.🎯 Set a stop loss at 56.335 , offering a risk-reward ratio greater than 1:2 . 📊 Watch for confirmation with a bullish close above entry and rising volume, capitalizing on oil's volatility.🌟
Fundamentally , WTI crude has fallen to around $58.13 per barrel as of November 21, 2025, amid supply outpacing demand, but recent breakouts above $60.7 signal near-term positivity despite forecasts of further drops to $53.50-$45.00 due to OPEC+ hikes and record US output. 💡
📝 Trade Setup
🎯 Entry Zone (Long): 57.5 – 58.3
🎯 Target (TP1): 62.45
❌ Stop Loss: 56.335
⚖️ Risk-to-Reward: Greater than 1:2, offering a clean upside swing with defined invalidation.
What's your take on this setup? Drop your thoughts below! 👇

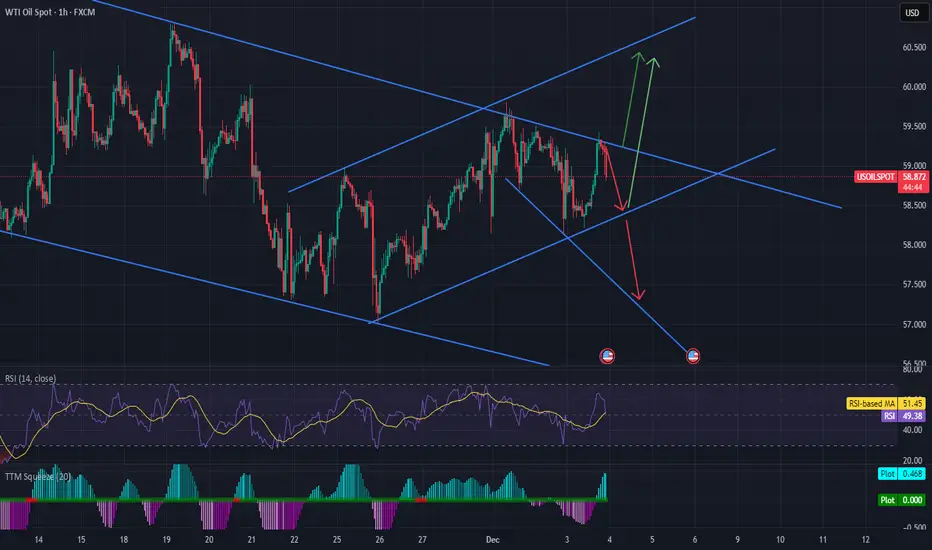
Watching PA to hit trendlines. Down if not bounce up.Again still tough to determine direction but at least the trendline channels are clearer now. Would be looking for a possible bounce and if it breaks to the upside. If not it might travel further down (which is what most others are saying)
WTI Crude – Macro Cycle OutlookWTI continues to track a dominant long-term cycle rhythm that has consistently produced major swing highs and lows across the past decade. The current positioning suggests we’re nearing the late stage of a down-cycle, which historically leads to accumulation, volatility compression, and eventual expansion.
The shorter oscillation (blue cycle) has been driving tradable swings roughly every 72 weeks, while the broader composite cycle (purple) points to a larger structural trough forming into the 2025–2026 window. If that timing holds, the coming quarters may represent a transitional regime.
CCI remains depressed but not capitulated, consistent with the “late descending phase” where momentum exhaustion precedes reversal but price can still grind lower.
CYCLE TAKEAWAY:
1. Late in down-cycle
2. Transitional phase likely
3. Potential for major cycle low into 2025–2026
4. Upside expansion historically follows these troughs
As always, cycles provide timing context, not trade signals – confirmation comes from price and momentum turning, not dates on a chart.
Not financial advice – sharing my cycle work for research and discussion.

Oil, Numbers, and Energy Flows: Decoding December’s Symbolic PulThe 3 December 2025 candle closed at 59.10, which from a numerology perspective can be interpreted as 5 + 9 = 14, and 1 + 4 = 5, symbolising volatility and rapid shifts. The decimals — 10 = 1 + 0 = 1 — represent initiation and new beginnings.
From this, we can conclude that 4 December may bring significant volatility. Perhaps developments involving the USA and Venezuela could emerge — just a thought we wanted to share for educational purposes.
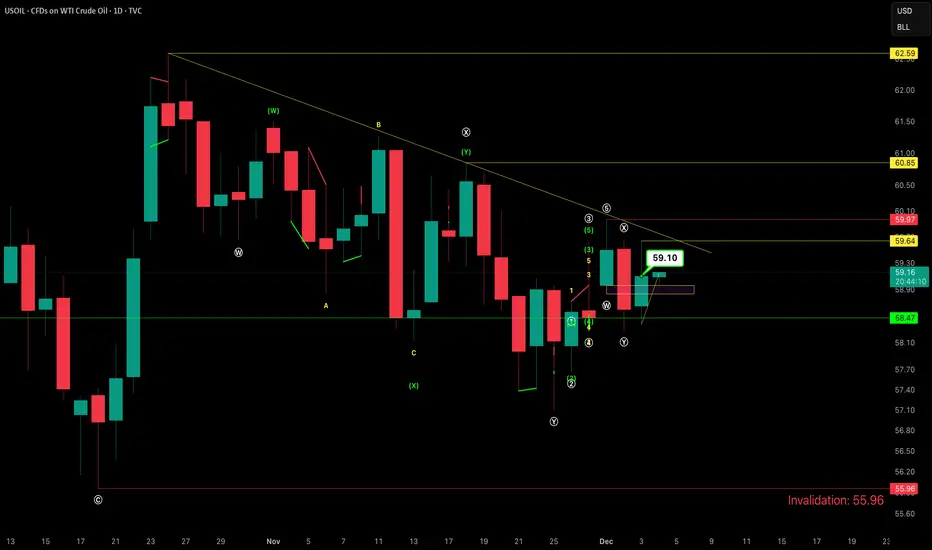
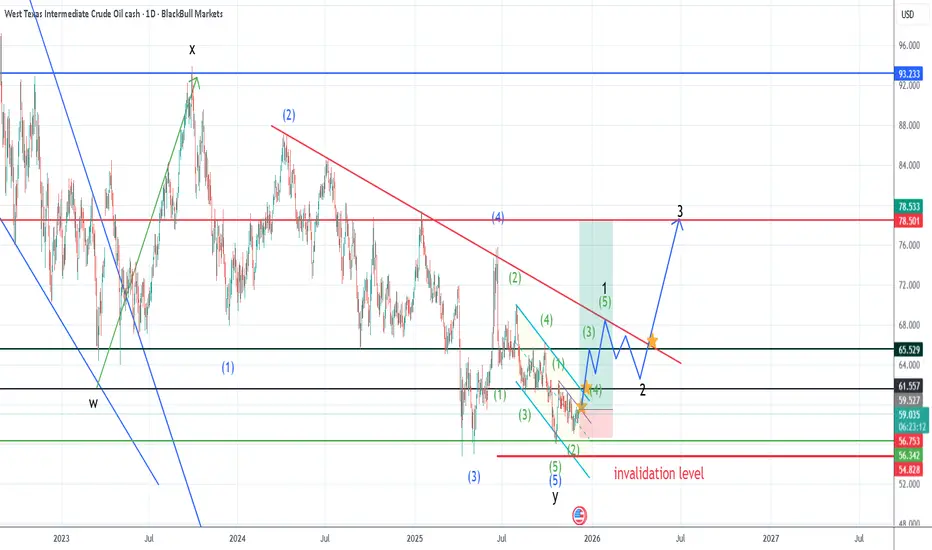
OIL IS (SOON) GOING TO 60ish.. 61, 62, 63, ....I am bullish on CrudeOil..
It has perfect wave counting 5 waves of C- correction.
And it stopped perfectly at the 78.6 Fibo levels with a strong bull candle.
Don't miss this chance.. Very good R:R from this level..
CHEEERRRSSSS...!!!!

CRUDE OIL (WTI): Bearish Movement After Trap
There is a high probability that Crude Oil will drop
after a false violation of an intraday resistance.
A double top pattern above that and a return
of the price below the underlined structure after
a neckline breakout give a strong signal.
I anticipate a bearish movement to 58.68
❤️Please, support my work with like, thank you!❤️

USOIL Set To Grow! BUY!
My dear friends,
Please, find my technical outlook for USOIL below:
The instrument tests an important psychological level 58.48
Bias - Bullish
Technical Indicators: Supper Trend gives a precise Bullish signal, while Pivot Point HL predicts price changes and potential reversals in the market.
Target - 58.94
Recommended Stop Loss - 58.19
About Used Indicators:
Super-trend indicator is more useful in trending markets where there are clear uptrends and downtrends in price.
Disclosure: I am part of Trade Nation's Influencer program and receive a monthly fee for using their TradingView charts in my analysis.
———————————
WISH YOU ALL LUCK

USoil: In all the cases, this looks upFor USoil, in all the cases this looks up. Any time we see a buy we will take it.
USOIL Is Bearish! Sell!
Here is our detailed technical review for USOIL.
Time Frame: 4h
Current Trend: Bearish
Sentiment: Overbought (based on 7-period RSI)
Forecast: Bearish
The price is testing a key resistance 59.116.
Taking into consideration the current market trend & overbought RSI, chances will be high to see a bearish movement to the downside at least to 58.630 level.
P.S
Overbought describes a period of time where there has been a significant and consistent upward move in price over a period of time without much pullback.
Like and subscribe and comment my ideas if you enjoy them!

Bullish on USOILPrice broke consolidation, and retested marked arear now I'm in the buys back to supply, risk management at play (always) Lets see if this plays out
NB: Documenting my trades and learning in the process, this is not financial advise just another trader making her way to profitability

USOIL BEARS WILL DOMINATE THE MARKET|SHORT
Hello, Friends!
USOIL pair is in the uptrend because previous week’s candle is green, while the price is obviously rising on the 4H timeframe. And after the retest of the resistance line above I believe we will see a move down towards the target below at 58.36 because the pair overbought due to its proximity to the upper BB band and a bearish correction is likely.
Disclosure: I am part of Trade Nation's Influencer program and receive a monthly fee for using their TradingView charts in my analysis.
✅LIKE AND COMMENT MY IDEAS✅

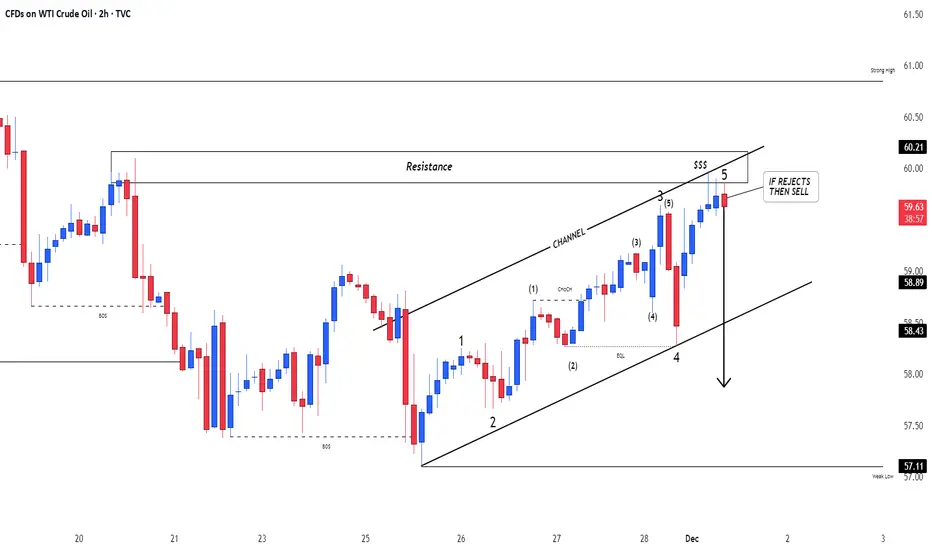
Crude OilU.S Oil
- Bullish Channel as an corrective pattern in Short Time Frame
- Resistance Level
- Change of Characteristics
- Completed " 12345 " Impulsive Waves
- Order Block
Heading into key resistance?WTI Oil (XTI/USD) is rising towards the pivot, which acts as an overlap resitance and could reverse to the 1st support.
Pivot: 62.24
1st Support: 56.51
1st Resistance: 65.75
Disclaimer:
The opinions given above constitute general market commentary and do not constitute the opinion or advice of IC Markets or any form of personal or investment advice.
Any opinions, news, research, analyses, prices, other information, or links to third-party sites contained on this website are provided on an "as-is" basis, are intended to be informative only, and are not advice, a recommendation, research, a record of our trading prices, an offer of, or solicitation for, a transaction in any financial instrument and thus should not be treated as such. The information provided does not involve any specific investment objectives, financial situation, or needs of any specific person who may receive it. Please be aware that past performance is not a reliable indicator of future performance and/or results. Past performance or forward-looking scenarios based upon the reasonable beliefs of the third-party provider are not a guarantee of future performance. Actual results may differ materially from those anticipated in forward-looking or past performance statements. IC Markets makes no representation or warranty and assumes no liability as to the accuracy or completeness of the information provided, nor any loss arising from any investment based on a recommendation, forecast, or any information supplied by any third party.

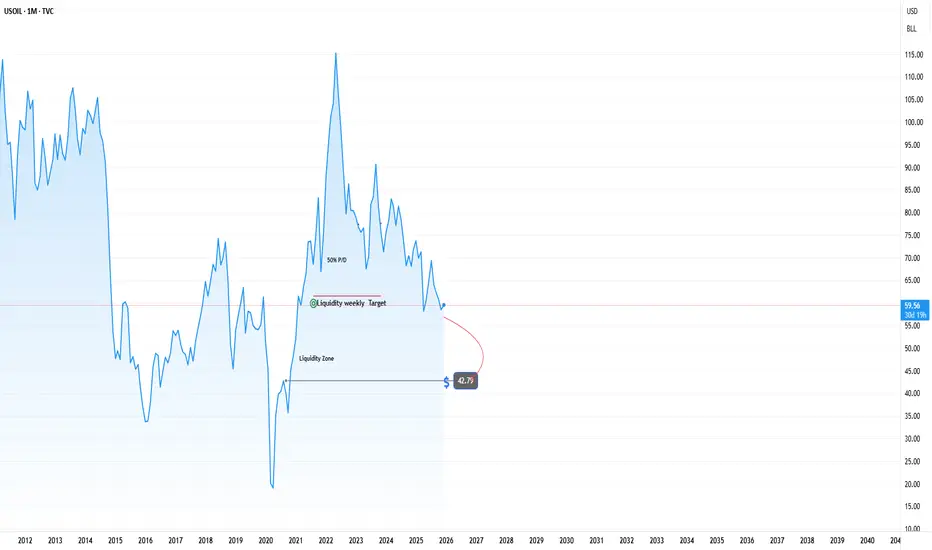
UPDATE WTI FORECASTING For the next year we will probably have the lowest pice to 42,79 per barrel, Investors have to see this behaive and price and get new strategies