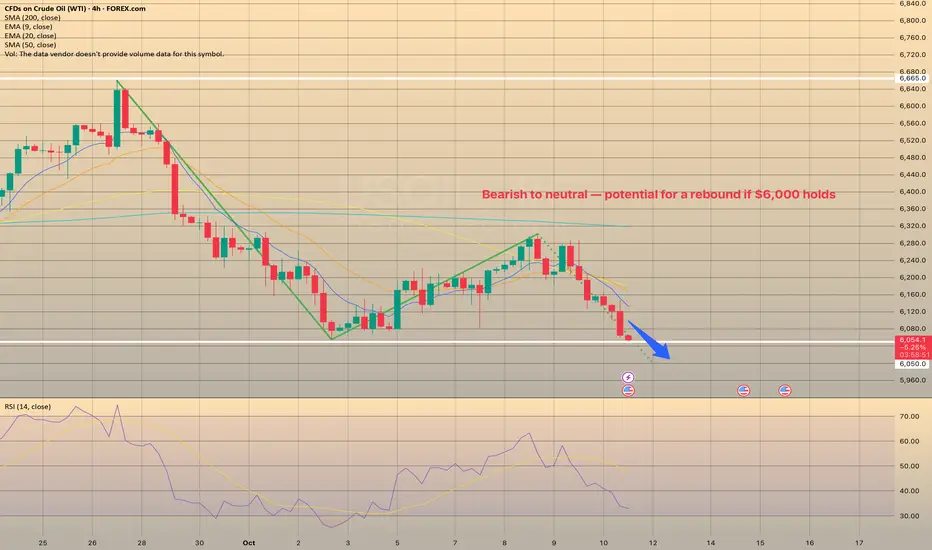
Oil Market: Bearish to neutral — potential for a rebound if $6,0Oil Market: Bearish to neutral — potential for a rebound if $6,000 holds
Crude and gasoline prices fell on Oct. 9 as market sentiment shifted amid rising supply expectations.
OPEC+ agreed to raise output by 137,000 bpd starting November, well below expectations of a 500,000 bpd hike. The group continues to unwind earlier cuts, aiming to restore 1.66 million bpd of production by year-end. OPEC’s September output rose 400,000 bpd to 29.05 million bpd, a 2.5-year high.
On Oct. 10 supply concerns eased after Israel accepted a U.S.-brokered cease-fire deal in Gaza, reducing geopolitical risk premiums. Still, new U.S. sanctions on Iran—targeting over 50 entities linked to oil and LPG trade—helped limit further losses.
Russian supply disruptions remain a supportive factor after drone attacks forced shutdowns at key refineries, while floating storage volumes fell 7% week-on-week to 82.8 million barrels, signaling tighter near-term supply.
Meanwhile, Iraq’s plan to resume Kurdish exports (up to 500,000 bpd) could weigh on prices, offsetting some of the geopolitical support.
EIA data showed U.S. crude inventories 4.5% below the 5-year average, with production up 0.9% w/w to 13.63 million bpd, near record highs. Active U.S. oil rigs slipped by two to 422, just above the four-year low.
Outlook:
Crude oil continues to display a bearish short-term structure, extending its recent downtrend after failing to sustain above the $6,300–$6,350 resistance zone. The price has now revisited the local support area around $6,050–$6,000, which has acted as a key pivot level in recent sessions.
ANZ Research expects near-term downside risks amid higher OPEC+ supply and weaker refinery demand, though low stockpiles outside China may cushion prices into 2026.
A clean rebound from $6,000 could trigger a short-covering move toward $6,200–$6,300.
Trade ideas
USOIL: Price breaks out of sideways – sell on pullbackTo better understand my current outlook on USOIL, please refer to my previous higher-timeframe and fundamental analyses.
This could be a position trade in anticipation of a larger downtrend on the daily timeframe, but there's risk involved due to the upcoming Non-Farm Payrolls (NFP) report this Friday.
* Trend: assessed using at least three trend indicators, with market structure as the primary guide.
** Weak or Reversal Signals: Assessed based on one of our criteria for trend reversal signals.
*** Support/Resistance: Selected from multiple factors – static (Swing High, Swing Low, etc.), dynamic (EMA, MA, etc.), psychological (Fibonacci, RSI, etc.) – and determined based on the trader’s discretion.
**** Our advice takes into account all factors, including both fundamental and technical analysis. It is not intended as a profit target. We hope it can serve as a reference to help you trade more effectively. This advice is for informational purposes only and we assume no responsibility for any trading results based on it.
Please like and comment below to support our traders. Your reactions will motivate us to do more analysis in the future 🙏✨
George Vann @ ZuperView
CRUDE OIL REBOUND AHEAD|LONG|
✅WTI OIL has tapped into the demand level after a sharp decline, showing signs of accumulation. A reaction from this discount area could drive price higher toward 61.10$, where liquidity above minor highs is resting. Time Frame 2H.
LONG🚀
✅Like and subscribe to never miss a new idea!✅

BUY USOILOur trade today on USOIL is bullish, you can buy following the same levles as mine.
We bought after that the market did a liquidity sweep and gave us a reversal.
Follow for more!
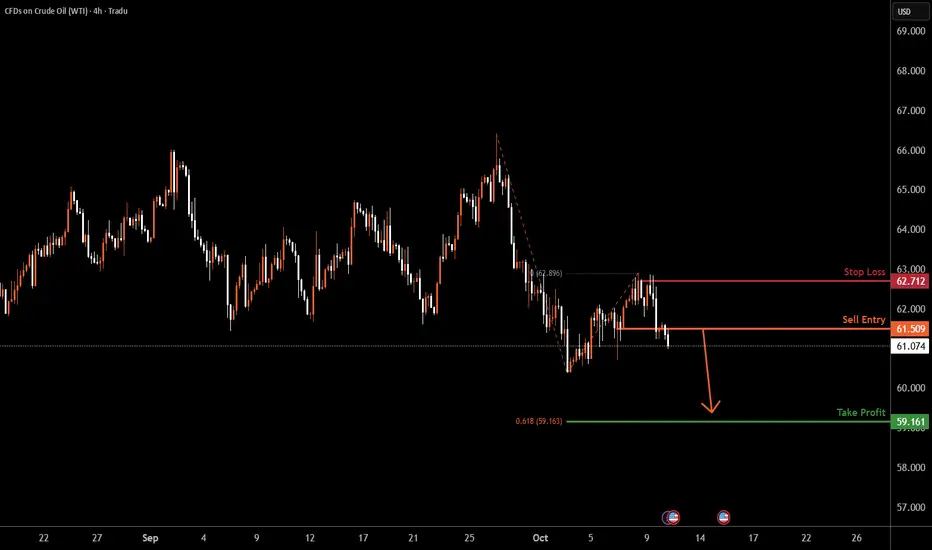
USOIL H4 | Bearish Drop OffUSOIL is reacting off the sell entry, which is a pullback resistance and could drop from this level to the downside.
Sell entry is at 61.50, which is a pullback resistance.
Stop loss is at 62.71, which is a pullback resistance.
Take profit is at 59.16, which lines up with the 161.8% Fibonacci extension.
High Risk Investment Warning
Trading Forex/CFDs on margin carries a high level of risk and may not be suitable for all investors. Leverage can work against you.
Stratos Markets Limited (tradu.com ):
CFDs are complex instruments and come with a high risk of losing money rapidly due to leverage. 65% of retail investor accounts lose money when trading CFDs with this provider. You should consider whether you understand how CFDs work and whether you can afford to take the high risk of losing your money.
Stratos Europe Ltd (tradu.com ):
CFDs are complex instruments and come with a high risk of losing money rapidly due to leverage. 66% of retail investor accounts lose money when trading CFDs with this provider. You should consider whether you understand how CFDs work and whether you can afford to take the high risk of losing your money.
Stratos Global LLC (tradu.com ):
Losses can exceed deposits.
Please be advised that the information presented on TradingView is provided to Tradu (‘Company’, ‘we’) by a third-party provider (‘TFA Global Pte Ltd’). Please be reminded that you are solely responsible for the trading decisions on your account. There is a very high degree of risk involved in trading. Any information and/or content is intended entirely for research, educational and informational purposes only and does not constitute investment or consultation advice or investment strategy. The information is not tailored to the investment needs of any specific person and therefore does not involve a consideration of any of the investment objectives, financial situation or needs of any viewer that may receive it. Kindly also note that past performance is not a reliable indicator of future results. Actual results may differ materially from those anticipated in forward-looking or past performance statements. We assume no liability as to the accuracy or completeness of any of the information and/or content provided herein and the Company cannot be held responsible for any omission, mistake nor for any loss or damage including without limitation to any loss of profit which may arise from reliance on any information supplied by TFA Global Pte Ltd.
The speaker(s) is neither an employee, agent nor representative of Tradu and is therefore acting independently. The opinions given are their own, constitute general market commentary, and do not constitute the opinion or advice of Tradu or any form of personal or investment advice. Tradu neither endorses nor guarantees offerings of third-party speakers, nor is Tradu responsible for the content, veracity or opinions of third-party speakers, presenters or participants.
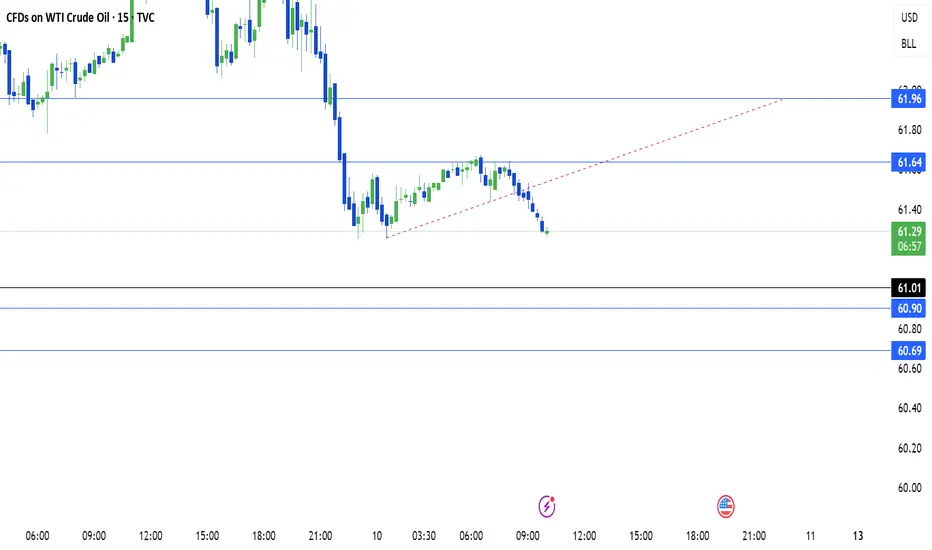
US OIL SUPPORT, RESISTANCE & TRENDLINE ANALYSISGo "SHORT" and likely to touch 61.01 / 60.90 and 60.69
Go "LONG" if it breaks the marked trendline and above 61.64 with immediate short-term target 61.96.
NOTE: My personal view is Bearish for the time being.
US OIL HI GUYS,
correction on technical analysis
update on us oil, the market has shifted to H1, H2 STRUCTURE, this means we close or trail our profits. anyway we cant hold for the incoming HS H1, H2.
TOMORROW IS FRIDAY , ITS MID NIGHT SHIT TODAY IS FRIDAY.
Anyway the picture above shows a new trend, will be waiting for London session for buy entries around 6 am, to 11,am.
structure has not changed just a shift in time frame. so yes we always expect anything as we move.


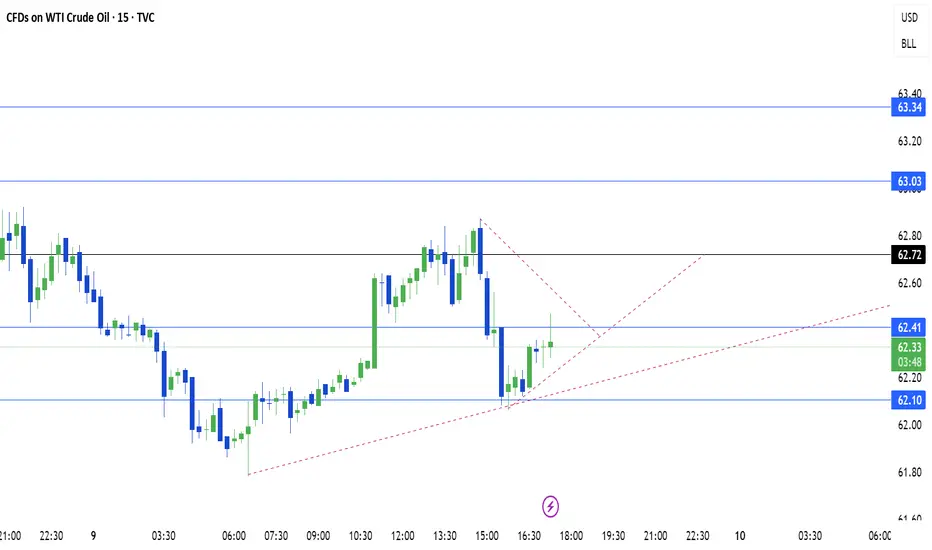
US OIL SUPPORT, RESISTANCE & TRENDLINE ANALYSISAs posted on 6th October US Oil moved upside when it broke the mentioned levels.
We have quiet a room for "LONG" position. Go for LONG only if it breaks 62.72 and might touch 63.03 and if it breaks this as well it might go further up till 63.34.
For "SHORT" positions plan only if it breaks 62.10 and it might lead to 61.72 and 61.26.
Breaking the trendline should also indicate and upward movement.
USOIL USOIL is seeing a two day buy rally but i dont like the position of oil ,i trade liquidity volatility and that's the direction of profit.
oil should either update the floor or the roof for clear directional bias. For now caution is needed until OPEC DATA REPORT IS CLEAR.
US STRATEGIC OIL RESERVE REPORT IS NEEDED TO TRADE USOIL .
I WILL COMMUNICATE OIL DIRECTION SOON.
#USOIL #OIL #DOLLAR

USOIL – Buy SetupTimeframe: H1
Current price: 62.40 USD/barrel
Trade idea:
Buy USOIL 62.30–62.40
🎯 Target: 63.90
🛑 Stop loss: 61.74
📈 R:R ≈ 1:3
Technical basis:
Price retested the breakout trendline and held above SMA89 (bullish confirmation).
Strong rebound from Fib 0.236 zone (62.28).
Momentum building toward 63.9 resistance area.
Comment:
Short-term rebound expected after correction. Maintain buy bias while price >61.8.

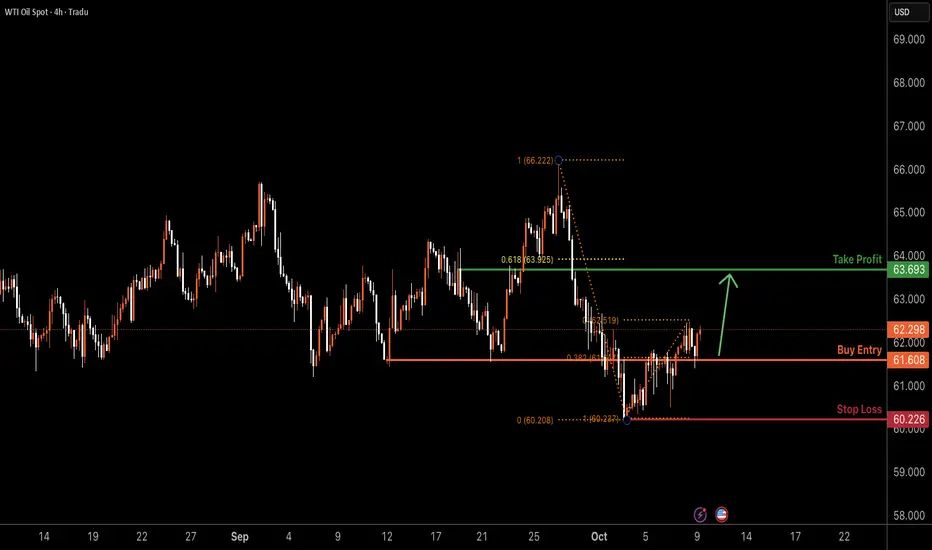
USOIL H4 | Bullish Reversal at Key SupportBased on the H4 chart analysis, we can see that the price has bounced off the buy entry, which is an overlap support that aligns with the 38.2% Fibonacci retracement and could rise from this level to the upside.
Buy entry is at 61.60, which is an overlap support that aligns with the 38.2% Fibonacci retracement.
Stop loss is at 60.22, whic is a swing low support.
Take profit is at 63.69, which is a pullback resistance that is slightly below the 61.8% Fibonacci retracement.
High Risk Investment Warning
Trading Forex/CFDs on margin carries a high level of risk and may not be suitable for all investors. Leverage can work against you.
Stratos Markets Limited (tradu.com ):
CFDs are complex instruments and come with a high risk of losing money rapidly due to leverage. 65% of retail investor accounts lose money when trading CFDs with this provider. You should consider whether you understand how CFDs work and whether you can afford to take the high risk of losing your money.
Stratos Europe Ltd (tradu.com ):
CFDs are complex instruments and come with a high risk of losing money rapidly due to leverage. 66% of retail investor accounts lose money when trading CFDs with this provider. You should consider whether you understand how CFDs work and whether you can afford to take the high risk of losing your money.
Stratos Global LLC (tradu.com ):
Losses can exceed deposits.
Please be advised that the information presented on TradingView is provided to Tradu (‘Company’, ‘we’) by a third-party provider (‘TFA Global Pte Ltd’). Please be reminded that you are solely responsible for the trading decisions on your account. There is a very high degree of risk involved in trading. Any information and/or content is intended entirely for research, educational and informational purposes only and does not constitute investment or consultation advice or investment strategy. The information is not tailored to the investment needs of any specific person and therefore does not involve a consideration of any of the investment objectives, financial situation or needs of any viewer that may receive it. Kindly also note that past performance is not a reliable indicator of future results. Actual results may differ materially from those anticipated in forward-looking or past performance statements. We assume no liability as to the accuracy or completeness of any of the information and/or content provided herein and the Company cannot be held responsible for any omission, mistake nor for any loss or damage including without limitation to any loss of profit which may arise from reliance on any information supplied by TFA Global Pte Ltd.
The speaker(s) is neither an employee, agent nor representative of Tradu and is therefore acting independently. The opinions given are their own, constitute general market commentary, and do not constitute the opinion or advice of Tradu or any form of personal or investment advice. Tradu neither endorses nor guarantees offerings of third-party speakers, nor is Tradu responsible for the content, veracity or opinions of third-party speakers, presenters or participants.
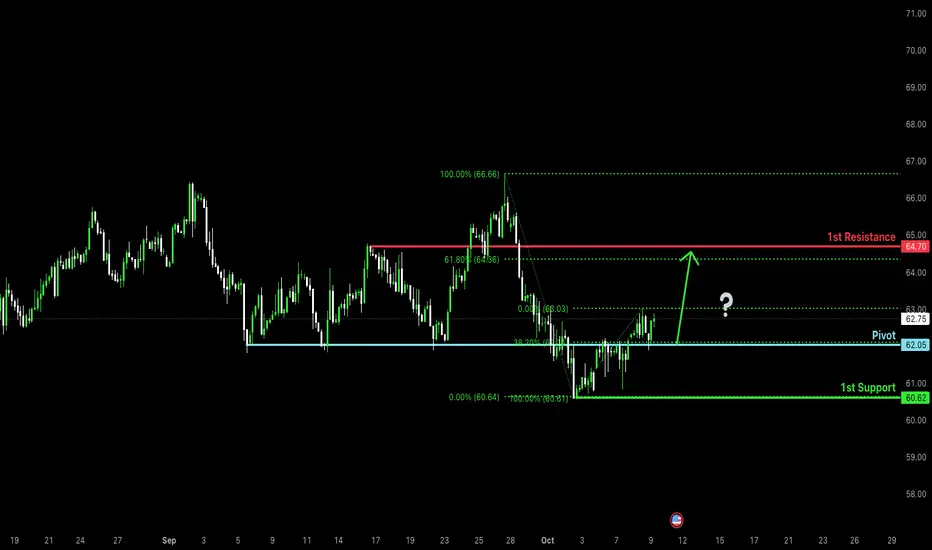
Bullish rebound at major support level?WTI Oil (XTI/USD) has bounced off the pivot, which has been identified as an overlap support that lines up with the 38.2% Fibonacci retracement and could rise to the 1st resistance.
Pivot: 62.05
1st Support: 60.62
1st Resistance: 64.70
Disclaimer:
The above opinions given constitute general market commentary, and do not constitute the opinion or advice of IC Markets or any form of personal or investment advice.
Any opinions, news, research, analyses, prices, other information, or links to third-party sites contained on this website are provided on an "as-is" basis, are intended only to be informative, is not an advice nor a recommendation, nor research, or a record of our trading prices, or an offer of, or solicitation for a transaction in any financial instrument and thus should not be treated as such. The information provided does not involve any specific investment objectives, financial situation and needs of any specific person who may receive it. Please be aware, that past performance is not a reliable indicator of future performance and/or results. Past Performance or Forward-looking scenarios based upon the reasonable beliefs of the third-party provider are not a guarantee of future performance. Actual results may differ materially from those anticipated in forward-looking or past performance statements. IC Markets makes no representation or warranty and assumes no liability as to the accuracy or completeness of the information provided, nor any loss arising from any investment based on a recommendation, forecast or any information supplied by any third-party.
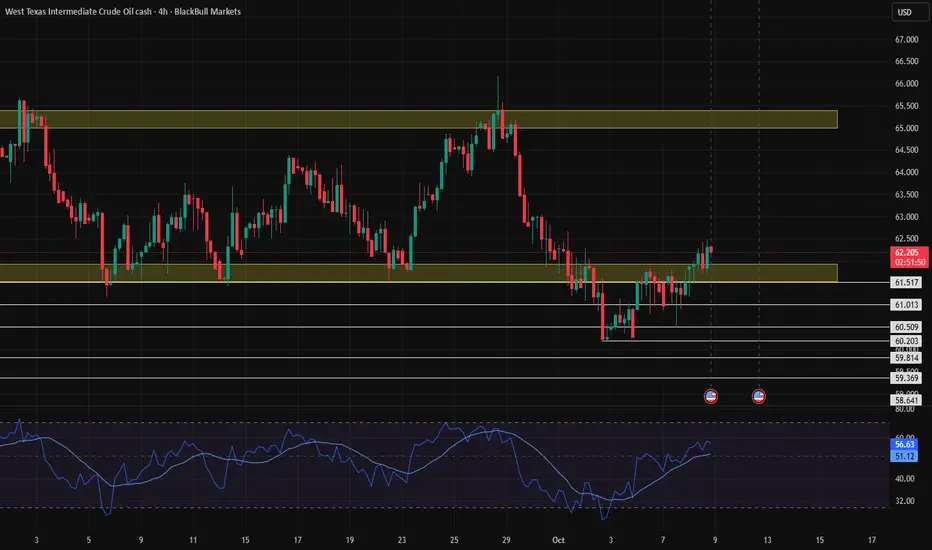
Bullish bounce off major support?USO/USD has bounced off the support level, which is an overlap support that aligns with the 38.2% Fibonacci retracement and could bounce from this level to our take profit.
Entry: 61.99
Why we like it:
There is an overlap support level that aligns with the 38.2% Fibonacci retracement.
Stop loss: 60.58
Why we like it:
There is a swing low support level.
Take profit: 64.07
Why we like it:
There is a pullback resistance level that is slightly below the 61.8% Fibonacci retracement.
Enjoying your TradingView experience? Review us!
Please be advised that the information presented on TradingView is provided to Vantage (‘Vantage Global Limited’, ‘we’) by a third-party provider (‘Everest Fortune Group’). Please be reminded that you are solely responsible for the trading decisions on your account. There is a very high degree of risk involved in trading. Any information and/or content is intended entirely for research, educational and informational purposes only and does not constitute investment or consultation advice or investment strategy. The information is not tailored to the investment needs of any specific person and therefore does not involve a consideration of any of the investment objectives, financial situation or needs of any viewer that may receive it. Kindly also note that past performance is not a reliable indicator of future results. Actual results may differ materially from those anticipated in forward-looking or past performance statements. We assume no liability as to the accuracy or completeness of any of the information and/or content provided herein and the Company cannot be held responsible for any omission, mistake nor for any loss or damage including without limitation to any loss of profit which may arise from reliance on any information supplied by Everest Fortune Group.

USOIL made Bullish Harami Pattern LongUSOIL made bullish Harami pattern and price likely will go this type of pattern is sign of reverse signal . Let us see ow it plays out.

us oilHI GUYS,
NOTE. we are still selling as the market is trying to catch up on the the RT DAILY STRUCTURE. This i posted earlier last month, lets trade with a vision of the future to ease or smoother any trade of interest be it buy or sell we are aware of market direction

us oilHI GUYS,
we are bearish on us .oil
Area of interest will be a test around fib -level 0.236
we shall witness a massive continuation sell in NEW YORK, LONDON session. ryt now am in a scalp buy entry early morning sweep.

US OILHI GUYS,
US.OIL has given us an entry in new york session ,
we expect an HS h1, h2 around fib level 1.414.
we are bullish

Oil AnalysisAs we mentioned in our previous analysis, we expected the price to return inside the range — and that’s exactly what happened. Now, our current expectation is for the price to continue rising toward **$65 per barrel**.
WTI crude oil Wave Analysis – 8 October 2025
- WTI crude oil reversed from round support level 60.00
- Likely to rise to resistance level 64.00
WTI crude oil recently reversed up from the support zone surrounding the round support level 60.00 (which has been reversing the price from the middle of May).
The upward reversal from the support level 60.00 created the daily Japanese candlesticks reversal pattern Hammer.
Given the strength of the nearby support level 60.00 and the oversold daily Stochastic, WTI crude oil can be expected to rise to the next resistance level 64.00.

WTI Crude oversold bounce back capped at 6430 The WTI Crude Oil is currently trading with a bearish bias, aligned with the broader downward trend. Recent price action shows a retest of the resistance, suggesting a further selling pressure within the downtrend.
Key resistance is located at 6430, a prior consolidation zone. This level will be critical in determining the next directional move.
A bearish rejection from 6430 could confirm the resumption of the downtrend, targeting the next support levels at 6200, followed by 6070 and 6000 over a longer timeframe.
Conversely, a decisive breakout and daily close above 6540 would invalidate the current bearish setup, shifting sentiment to bullish and potentially triggering a move towards 6650, then 6830.
Conclusion:
The short-term outlook remains bearish unless WTI Crude breaks and holds above 6430. Traders should watch for price action signals around this key level to confirm direction. A rejection favours fresh downside continuation, while a breakout signals a potential trend reversal or deeper correction.
This communication is for informational purposes only and should not be viewed as any form of recommendation as to a particular course of action or as investment advice. It is not intended as an offer or solicitation for the purchase or sale of any financial instrument or as an official confirmation of any transaction. Opinions, estimates and assumptions expressed herein are made as of the date of this communication and are subject to change without notice. This communication has been prepared based upon information, including market prices, data and other information, believed to be reliable; however, Trade Nation does not warrant its completeness or accuracy. All market prices and market data contained in or attached to this communication are indicative and subject to change without notice.

USOIL SENDS CLEAR BEARISH SIGNALS|SHORT
USOIL SIGNAL
Trade Direction: short
Entry Level: 62.52
Target Level: 60.15
Stop Loss: 64.10
RISK PROFILE
Risk level: medium
Suggested risk: 1%
Timeframe: 7h
Disclosure: I am part of Trade Nation's Influencer program and receive a monthly fee for using their TradingView charts in my analysis.
✅LIKE AND COMMENT MY IDEAS✅

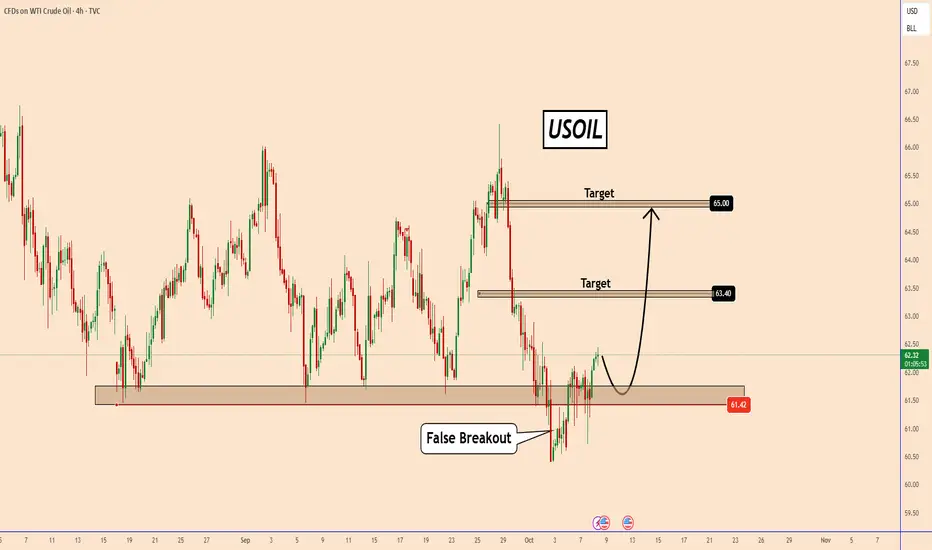
USOIL: False Breakout and Potential ReversalUSOIL: False Breakout and Potential Reversal
USOIL recently made a false breakout below the support area near 61.40, which suggests that sellers failed to push the price lower.
This false breakout often signals a possible bullish reversal if buyers maintain control.
Currently, the price is trading just above the support zone and seems to be building momentum for a potential rebound.
If the bullish scenario continues, the next targets to watch are:
63.40
65.00
As long as the price remains above 61.40, the bullish outlook stays valid.
You may find more details in the chart!
Thank you and Good Luck!
❤️PS: Please support with a like or comment if you find this analysis useful for your trading day❤️