Possible Retest for WTI Crude Oil.WTI Crude Oil has been in a consolidation Phase since the beginning of the month. After breaking out of it recently, I expect the price to go up the decision Point Zone and to then drop.
Lets see if this trade works out.
TVC:USOIL
USOUSD trade ideas

CRUDE OIL Will Fall! Sell!
Hello,Traders!
CRUDE OIL is going up
Now and it looks like
It is set to retest
The horizontal resistance
Of 76.86$ from where
We will be expecting
A pullback and a
Move down
Sell!
Like, comment and subscribe to help us grow!
Check out other forecasts below too!

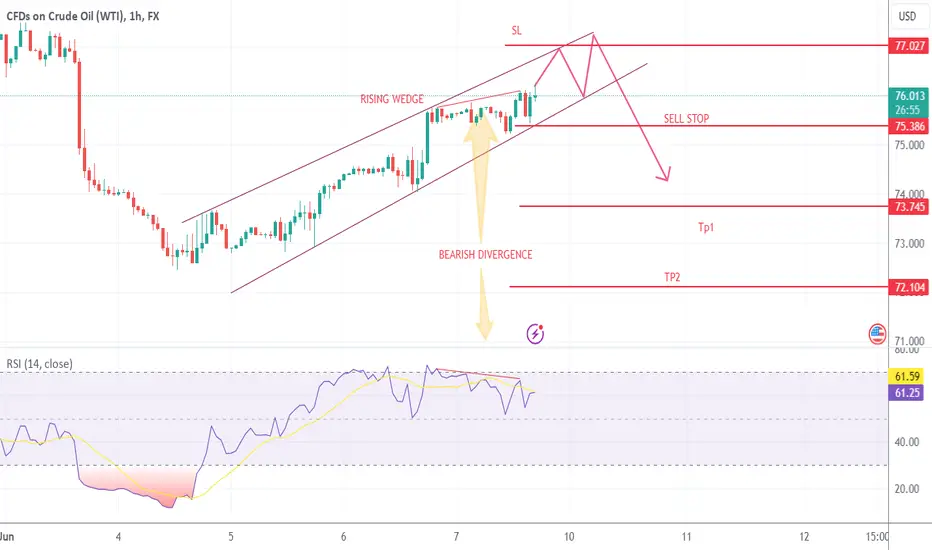
USOIL printing bearish reversalUSOIL WTI printing Rising WEDGE (bearish reversal) and Bearish Divergence
SELL STOP below the last HL, SL above the expected HH
TP 1 & TP2 with R:R 1:1 & 1:2 respectively
US-Oil will further push upside After Testing TrendlineHello Traders
In This Chart XTIUSD HOURLY Forex Forecast By FOREX PLANET
today XTIUSD analysis 👆
🟢This Chart includes_ (XTIUSD market update)
🟢What is The Next Opportunity on XTIUSD Market
🟢how to Enter to the Valid Entry With Assurance Profit
This CHART is For Trader's that Want to Improve Their Technical Analysis Skills and Their Trading By Understanding How To Analyze The Market Using Multiple Timeframes and Understanding The Bigger Picture on the Charts

OiL: $110 | Open Short | Stop at $116 this coould be a good SHORT when the cartel is about to go head on with Kremlin
price war and alliances shall be tested and POWER is the basic need for every nation to survive

OIL: Day 3 breakout trades long in the market, NFP week!Hi everyone and welcome to my channel, please don’t forget to support all my work subscribing and liking my post, and for any question leave me a comment, I will be more than happy to help you!
“Trade setups, not movements”
1. DAY OF THE WEEK (Failed Breakout, False Break, Range Expansion)
Monday DAY 1 Opening Range
Tuesday DAY 2 Initial Balance
Wednesday DAY 3 (reset DAY 1) Mid Point Week
Thursday DAY 2
Friday DAY 3 Closing Range ✅ no daily cycle
2. SIGNAL DAY
First Red Day
First Green Day
3 Days Long Breakout ✅
3 Days Short Breakout
Inside Day
3. WEEKLY TEMPLATE
Pump&Dump
Dump&Pump ✅
Frontside
Backside ✅
4. THESIS:
Long: primary, day 3 long in the market, OIL looks like coiling for an explosive move. After NFP I will looking for a buy low dump and pump back either the HOW, or the breakout NY session of monday (see the green line)
Short: secondary, not really interested in short this market, unless a scalp third hour NY session HOD to LOD
Please note that the purpose of my analysis is to help me and you hunting the best trade setup for the day, none of my technical aspects are a way to forecast any directional market movement.
Gianni

Crude oil continues to bearish pressureTechnical analysis of crude oil
Daily resistance 74.2, support below 72.7
Four-hour resistance 73.7-74.2, support below 72-71
Crude oil operation suggestions: Crude oil continued the recent extremely weak short-term unilateral downward rhythm yesterday, with the Asian and European sessions showing a downward trend, and the US session suppressed and fluctuated below the 73.5 mark.
The overall price continued the recent unilateral short-term downward rhythm. Today's upper resistance is around 73.7-74.2. Today's rebound relies on this position to continue the main short-term bearish trend. The short-term oil price short-term weak dividing line focuses on the 74.2 mark. Any rebound before the daily level breaks through and stands on this position is a short-selling opportunity, and keep trading with the trend.
SELL:74.2 near SL:74.50
SELL:73.7 near SL:74.20
Technical analysis only provides trading direction!

Crude Oil (WTI) may rise to 76.60 - 77.30Pivot
74.75
Our preference
Long positions above 74.75 with targets at 76.60 & 77.30 in extension.
Alternative scenario
Below 74.75 look for further downside with 74.15 & 73.65 as targets.
Comment
The break above 74.75 is a positive signal that has opened a path to 76.60.
Supports and resistances
78.00
77.30
76.60
75.48 Last
74.75
74.15
73.65
Number of asterisks represents the strength of support and resistance levels

another chance at oil bullish runthe h4 candle close shows a liquidity grab and h1 candle is a piercing candle close, stops go below and targetting 77 level

US OilKey Observations:
1. Moving Averages (200 MA and 50 MA):
• 200 MA (Blue Line): The price is below the 200 MA, indicating a bearish long-term trend.
• 50 MA (Yellow Line): The price is currently above the 50 MA, suggesting a short-term bullish sentiment.
2. Relative Strength Index (RSI):
• The RSI is around 50, indicating neutral conditions. This suggests the market could move in either direction from this point.
3. MACD (Moving Average Convergence Divergence):
• The MACD line is above the signal line, but the histogram is showing decreasing positive values, indicating a potential weakening of bullish momentum.
4. Bollinger Bands:
• The price is near the upper Bollinger Band, indicating it might be overbought in the short term. This often suggests a potential pullback to the middle band (20 MA) or lower band.
5. Fibonacci Retracement Levels:
• 0.236 (75.45), 0.382 (75.19), 0.5 (74.98), 0.618 (74.78), 0.786 (74.40)
• The price is near the 0.236 Fibonacci level (75.45), which could act as minor resistance. The other levels serve as potential support if the price retraces.
6. ATR (Average True Range):
• The ATR indicates moderate volatility. This suggests that while there might be significant price movements, they are not extreme.
Comprehensive Technical Analysis:
1. Current Trend:
• The short-term trend is bullish as indicated by the price being above the 50 MA. However, the overall trend remains bearish with the price below the 200 MA.
2. Neutral Momentum:
• The RSI around 50 and the MACD showing weakening bullish momentum suggest a cautious outlook.
3. Key Support and Resistance Levels:
• Resistance: 0.236 Fibonacci level (75.45) and potentially the upper Bollinger Band.
• Support: 0.382 Fibonacci level (75.19), 0.5 Fibonacci level (74.98), and 0.618 Fibonacci level (74.78).
4. Momentum Analysis:
• The MACD indicates bullish momentum, but the decreasing histogram suggests a potential slowing. This requires monitoring for signs of a bearish crossover.
Potential Buy and Sell Levels:
Buy Levels:
1. Support at 0.382 Fibonacci Level (75.19):
• If the price finds support around this level and shows bullish reversal signals, consider entering a buy position.
• Buy Level: 75.19
• Stop Loss: Below 75.00 (just below the support level to avoid false breaks)
• Take Profit: First target at 75.45 (0.236 Fibonacci level) and second target at 75.88 (recent high)
2. Lower Bollinger Band Area:
• Consider buying near the lower Bollinger Band for a short-term rebound.
• Buy Level: Around 74.78 (if the lower Bollinger Band is around this level)
• Stop Loss: Below 74.60 (to account for potential volatility)
• Take Profit: Middle Bollinger Band (approximately 75.45)
Sell Levels:
1. Resistance at 0.236 Fibonacci Level (75.45):
• If the price rebounds to this level and faces resistance, consider entering a sell position.
• Sell Level: 75.45
• Stop Loss: Above 75.60 (just above the resistance level)
• Take Profit: First target at 75.19 (0.382 Fibonacci level) and second target at 74.98 (0.5 Fibonacci level)
2. Middle Bollinger Band Area:
• If the price fails to sustain above the middle Bollinger Band, consider entering a sell position.
• Sell Level: Around 75.40 (if the middle Bollinger Band is around this level)
• Stop Loss: Above 75.60 (just above the middle Bollinger Band)
• Take Profit: First target at 75.00 (lower Bollinger Band) and second target at 74.78 (0.618 Fibonacci level)
Summary:
• Buy Levels:
• 75.19 (with stop loss below 75.00 and take profit at 75.45 and 75.88)
• Around 74.78 (with stop loss below 74.60 and take profit at 75.45)
• Sell Levels:
• 75.45 (with stop loss above 75.60 and take profit at 75.19 and 74.98)
• Around 75.40 (with stop loss above 75.60 and take profit at 75.00 and 74.78)

USOILUSOIL is in strong bearish trend.
As the market is consistently printing new LLs and LHs.
currently the market is retracing a bit after last LL, which is 50% Fib retracement level and local support as well. if the market successfully sustain this selling confluence the next leg lower could go for new LL.
What you guys think of this idea?

CRUDE OIL (WTI): Time to Sell?!
WTI Crude Oil is testing a recently broken horizontal support.
After a violation, it turned into a potentially strong resistance.
Approaching the underlined area, the price formed a head and shoulders pattern
on an hourly time frame.
A breakout of its horizontal neckline is a strong intraday bearish confirmation for us.
We can expect a bearish continuation now.
Goals 74.9 / 74.3
❤️Please, support my work with like, thank you!❤️

3105 USOIL could reach 73 in the near coming ?Hello traders,
USOIL is making a smiling curve on weekly chart, check the left one. This means in a long term view, OIL will rise again.
But right now on 6H right chart, in the middle term view, it could reach 73 first to finish a five-wave downtrend to reach the support level or buying zone.
The triangle with the mouth open is an oscillating pattern. When the price touches the suppression line above the triangle, it is time to go short. Fibo ext 1.618 is where it will possible reach as the end of 5th wave.
GOOD LUCK!
LESS IS MORE!

OIL: First green day, three days cycleHi everyone and welcome to my channel, please don’t forget to support all my work subscribing and liking my post, and for any question leave me a comment, I will be more than happy to help you!
“Trade setups, not movements”
1. DAY OF THE WEEK (Failed Breakout, False Break, Range Expansion)
Monday DAY 1 Opening Range
Tuesday DAY 2 Initial Balance
Wednesday DAY 3 (reset DAY 1) Mid Point Week
Thursday DAY 2 ✅ day 3 cycle
Friday DAY 3 Closing Range
2. SIGNAL DAY
First Red Day
First Green Day ✅
3 Days Long Breakout
3 Days Short Breakout
Inside Day
3. WEEKLY TEMPLATE
Pump&Dump
Dump&Pump ✅
Frontside
Backside ✅
4. THESIS:
Long: primary, by tomorrow with the NFP, we can definitely see this great weekly dump and pump scenario completed, second hour NY session I will be looking for a buy low setup, back at least to NY session Monday morning.
Short: I do not exclude price going back lower, retesting the LOW, however I wouldn't be interested today in this scenario.
Please note that the purpose of my analysis is to help me and you hunting the best trade setup for the day, none of my technical aspects are a way to forecast any directional market movement.
Gianni

oil bullish ideabulls strong for the past 2 days, consolidation on h1 and a morning star pattern on h1 with a bullish h4 piercing candle, good risk to reward

Market Analysis: Crude Oil Price RisesMarket Analysis: Crude Oil Price Rises
Crude oil is recovering and might rise toward the $78.40 resistance zone.
Important Takeaways for Oil Prices Analysis Today
- Crude oil is recovering losses and trading above the $74.30 support.
- There was a break above a connecting bearish trend line with resistance near $73.50 on the hourly chart of XTI/USD at FXOpen.
Oil Price Technical Analysis
On the hourly chart of WTI Crude Oil at FXOpen, the price found support near the $72.40 zone against the US Dollar. The price formed a base and started a recovery wave above $73.50 and the 50-hour simple moving average.
The bulls were able to push the price toward the 50% Fib retracement level of the downward move from the $78.42 swing high to the $72.42 swing low. Besides, there was a break above a connecting bearish trend line with resistance near $73.50.
The hourly RSI is near the 65 level, but the price is struggling near $75.50. The next resistance is near the 61.8% Fib retracement level of the downward move from the $78.42 swing high to the $72.42 swing low at $76.15.
A clear move above the $76.15 could send the price toward the $77.50 resistance. Any more gains might send the price toward the $78.40 level. Conversely, the price might start a fresh decline from the $75.50 resistance.
Immediate support sits near the $74.30 level. The next major support on the WTI crude oil chart is $72.40. If there is a downside break, the price might decline toward $72.40. Any more losses may perhaps open the doors for a move toward the $71.20 support zone.
Start trading commodity CFDs with tight spreads. Open your trading account now or learn more about trading commodity CFDs with FXOpen.
This article represents the opinion of the Companies operating under the FXOpen brand only. It is not to be construed as an offer, solicitation, or recommendation with respect to products and services provided by the Companies operating under the FXOpen brand, nor is it to be considered financial advice.

OIL is testing a strong resistance zone. Be careful OIL is testing a strong resistance zone. Be careful of any bearish moves
From the previous analysis, OIL moved down from the megaphone pattern pointing down for a bigger bearish wave.
The price is already testing the base of the pattern indicating the possibility that it could go lower again.
This is just the beginning and should confirm the bearish movement and it is not a mus that it will move down.
You can pay attention to this area as oil may resume the bearish trend again.
You may find more details in the chart!
Thank you and Good Luck!
❤️PS: Please support with a like or comment if you find this analysis useful for your trading day❤️

WTI Oil H4 | Rising into pullback resistanceWTI oil (USOIL) is rising towards a pullback resistance and could potentially reverse off this level to drop lower.
Sell entry is at 76.03 which is a pullback resistance.
Stop loss is at 76.88 which is a level that sits above the 50.0% Fibonacci retracement level and a pullback resistance.
Take profit is at 74.21 which is a pullback support.
High Risk Investment Warning
Trading Forex/CFDs on margin carries a high level of risk and may not be suitable for all investors. Leverage can work against you.
Stratos Markets Limited (www.fxcm.com):
CFDs are complex instruments and come with a high risk of losing money rapidly due to leverage. 68% of retail investor accounts lose money when trading CFDs with this provider. You should consider whether you understand how CFDs work and whether you can afford to take the high risk of losing your money.
Stratos Europe Ltd, previously FXCM EU Ltd (www.fxcm.com):
CFDs are complex instruments and come with a high risk of losing money rapidly due to leverage. 70% of retail investor accounts lose money when trading CFDs with this provider. You should consider whether you understand how CFDs work and whether you can afford to take the high risk of losing your money.
Stratos Trading Pty. Limited (www.fxcm.com):
Trading FX/CFDs carries significant risks. FXCM AU (AFSL 309763), please read the Financial Services Guide, Product Disclosure Statement, Target Market Determination and Terms of Business at www.fxcm.com
Stratos Global LLC (www.fxcm.com):
Losses can exceed deposits.
Please be advised that the information presented on TradingView is provided to FXCM (‘Company’, ‘we’) by a third-party provider (‘TFA Global Pte Ltd’). Please be reminded that you are solely responsible for the trading decisions on your account. There is a very high degree of risk involved in trading. Any information and/or content is intended entirely for research, educational and informational purposes only and does not constitute investment or consultation advice or investment strategy. The information is not tailored to the investment needs of any specific person and therefore does not involve a consideration of any of the investment objectives, financial situation or needs of any viewer that may receive it. Kindly also note that past performance is not a reliable indicator of future results. Actual results may differ materially from those anticipated in forward-looking or past performance statements. We assume no liability as to the accuracy or completeness of any of the information and/or content provided herein and the Company cannot be held responsible for any omission, mistake nor for any loss or damage including without limitation to any loss of profit which may arise from reliance on any information supplied by TFA Global Pte Ltd.
The speaker(s) is neither an employee, agent nor representative of FXCM and is therefore acting independently. The opinions given are their own, constitute general market commentary, and do not constitute the opinion or advice of FXCM or any form of personal or investment advice. FXCM neither endorses nor guarantees offerings of third-party speakers, nor is FXCM responsible for the content, veracity or opinions of third-party speakers, presenters or participants.

World oil prices are in the process of accumulationWorld oil fees extended 2% at the buying and selling consultation on June 6, after the European Central Bank (ECB) determined to reduce hobby fees, elevating hopes that americaA Federal Reserve (Fed) will comparable action.
Meanwhile, ministers from the Organization of the Petroleum Exporting Countries (OPEC) and its allies, called OPEC+, reassured traders that the ultra-modern oil output settlement should alternate relying at the situation. into the marketplace.
At the quit of this consultation, Brent North Sea crude oil charge extended through 1.forty six USD, equal to 1.86%, to 79.87 USD/barrel. The charge of US mild candy oil (WTI) extended through 1.forty eight USD, equal to 2%, to 75.fifty five USD/barrel.
On June 6, the ECB carried out the primary hobby charge reduce on account that 2019, mentioning development in pushing lower back inflation, however caution of inflationary strain withinside the Copper Area. Euro (Eurozone) continues.
Specifically, the ECB diminished hobby fees through 25 foundation points, to 3.75%, after maintaining hobby fees unchanged from October 2023.
Lower gas charges and easing post-pandemic deliver constraints have helped push inflation right all the way down to 2.6% withinside the 20 nations that use the euro, from 10% on the quit of 2022.
Investors are actually much less sure than they had been some weeks in the past that inflation has fallen sufficient for the ECB to adopt a large-scale economic coverage easing cycle. In americaA, economists expect the Fed will reduce hobby fees in September 2024.
The range of Americans submitting preliminary unemployment claims rose closing week and hard work charges rose much less withinside the first area of 2024 than forecast, the Labor Department stated. While this indicates americaA hard work marketplace is cooling, it's miles not going to spark off the Fed to begin slicing hobby fees.
Meanwhile, buying and selling company Trafigura`s leader economist Saad Rahim stated OPEC+'s choice to steadily raise a few manufacturing cuts, blended with sturdy gas supplies, had driven oil fees down. reduced withinside the beyond few sessions.
Saudi Arabia's Energy Minister Prince Abdulaziz bin Salman stated on June 6 that OPEC+ should pause or opposite the growth in manufacturing if it reveals that the marketplace isn't sturdy sufficient./.

USOIL - Heading Lower Looks like that little bounce was a short covering shakeout and now the dominant trend has resumed to the downside 🧐.
Not advice.

Bearish reversal?WTI/USD is rising towards a resistance level which is a pullback resistance that aligns with the 50% Fibonacci retracement and could reverse from this level to our take profit.
Entry: 76.84
Why we like it:
There is a pullback resistance which lines up with the 50% Fibonacci retracement.
Stop loss: 78.90
Why we like it:
There is a pullback resistance that lines up with the 78.6% Fibonacci retracement.
Take profit: 72.79
Why we like it:
There is a pullback support.
Please be advised that the information presented on TradingView is provided to Vantage (‘Vantage Global Limited’, ‘we’) by a third-party provider (‘Everest Fortune Group’). Please be reminded that you are solely responsible for the trading decisions on your account. There is a very high degree of risk involved in trading. Any information and/or content is intended entirely for research, educational and informational purposes only and does not constitute investment or consultation advice or investment strategy. The information is not tailored to the investment needs of any specific person and therefore does not involve a consideration of any of the investment objectives, financial situation or needs of any viewer that may receive it. Kindly also note that past performance is not a reliable indicator of future results. Actual results may differ materially from those anticipated in forward-looking or past performance statements. We assume no liability as to the accuracy or completeness of any of the information and/or content provided herein and the Company cannot be held responsible for any omission, mistake nor for any loss or damage including without limitation to any loss of profit which may arise from reliance on any information supplied by Everest Fortune Group.

CRUDE OIL BEARISH SETUP|SHORT|
✅CRUDE OIL surged again to retest the resistance of 76.77$
But it is a strong key level
So I think that there is a high chance
That we will see a bearish pullback and a move down
SHORT🔥
✅Like and subscribe to never miss a new idea!✅

Crude oil 75 near sell target 72!Yesterday I indicated to buy crude oil near 73 and today it reached a profit near 74.5! Let us make a profit of more than 12 dollars!
The 4-hour pressure of crude oil has reached 75.40, today this position can consider selling crude oil!
Crude oil ----
Sell near 75.30
Target 72.00-70.00
