Bearish movement on usoilPrice has been on a downtrend , price has gone back to retest a structure which was broken …this also marks the 61% of the fib retracement level
USOUSD trade ideas

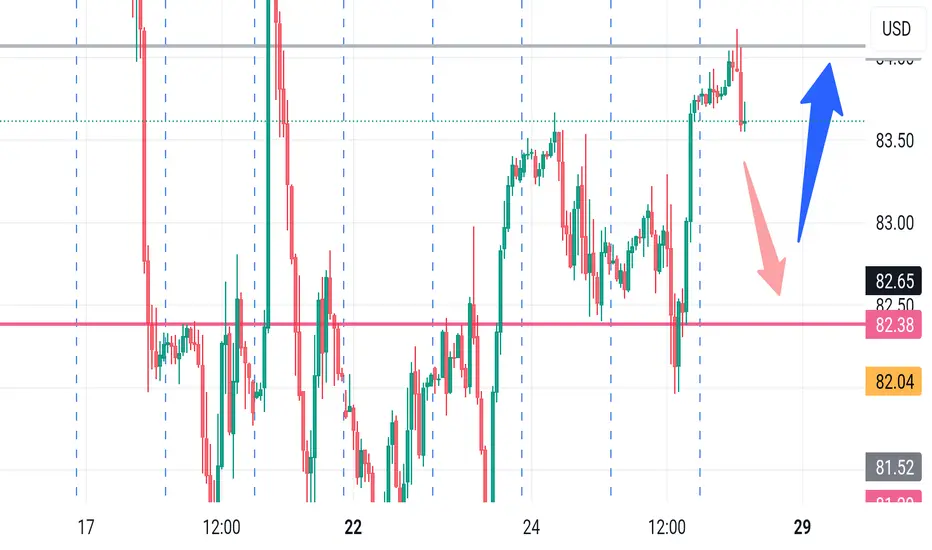
USOIL Potential UpsidesHey Traders, in the coming week we are monitoring USOIL for a buying opportunity around 82.70 zone, USOIL is trading in an uptrend and currently is in a correction phase in which it is approaching the trend at 82.70 support and resistance area.
Trade safe, Joe.


USOUSD Spot Oil Jumps on Geopolitical Escalation LONGSpot Oil on 30-minute chart had a slow rise in the past 24 hours followed by a pause and then a
jump on the Israeli retaliation strikes into Iran. Middle East oil shipping in the Red Sea and
Persian Gulf are at risk and shipping insurance for ongoing shipments is likely to experience
heavy rate increases if shipping does occur. Houthi rebels may resume proxy attacks on the
behalf of Iran. New sanctions contemplated against Iran may include increased action on oil
exports and the Israelis could target oil infrastructure. Overall, spot oil now has a bullish
bias. I see good cause to increase oil based positions at this time. My target for spot oil
based on VWAP lines currently on the chart is 87.5 about 4% upside without leveraging.
The volume indicator shows increased buying volumes relative to selling. The PVT shows a quick
burst of trend momentum while the TTM indictor triggered and has an upgoing histogram.

USOIL What Next? BUY!
My dear friends,
USOIL looks like it will make a good move, and here are the details:
The market is trading on 82.07 pivot level.
Bias - Bullish
Technical Indicators: Supper Trend generates a clear long signal while Pivot Point HL is currently determining the overall Bullish trend of the market.
Goal - 83.70
Recommended Stop Loss - 81.04
About Used Indicators:
Pivot points are a great way to identify areas of support and resistance, but they work best when combined with other kinds of technical analysis
———————————
WISH YOU ALL LUCK

USOIL is struggling to break through 😫 Price target $73TVC:USOIL #Usoil #commodities
USOIL is struggling to break through the resistance 😫
Momentum now seems to favor the bears🐻
If the support line breaks down then price heading towards $73🎯 which is the wedge support line

USOIL is struggling to break through 😫 Price target $73USOIL is struggling to break through the resistance and further rejection could send price back to Fib support price of $79.
If we breakthrough the resistance then upside price target of $89. After that we can go as high as $96.
Momentum now seems to favor the bears🐻
If the support line breaks down then price heading towards $73🎯 which is the wedge support line

🔥🔥🔥USOIL Continue to buy!!!✅✅✅Crude oil has emphasized that it will continue to rise, and falling is a buying opportunity. The upper target is focused on 88-90 US dollars.
All my current transactions maintain 100% accuracy. If your account is still losing money, you can follow my signal trading and I will help your account make profits quickly!

Why Oil Bulls May Be Right: Signs of a Tightening MarketOil prices have experienced a volatile period in recent months, with concerns about global economic growth and geopolitical tensions battling it out with signs of a tightening physical market. However, for investors with a long-term perspective, recent developments suggest a potential bull run for oil, making it an attractive asset to consider.
Here's a deeper dive into why going long on oil could be a strategic move:
Tightening Physical Supplies: One of the most compelling arguments for a long position is the evidence of a tightening physical market. This is reflected in key timespreads, which compare the price of oil for immediate delivery to the price for delivery at a future date. In a healthy market with ample supply, the price of oil for immediate delivery would be lower than the price for future delivery (contango). However, when the physical market tightens, the opposite happens – the price of oil for immediate delivery becomes higher than the price for future delivery (backwardation). This phenomenon, currently observed in the oil market, suggests that there is a higher demand for oil right now than there is readily available supply.
OPEC+ Production Cuts: Adding fuel to the fire are the production cuts implemented by the Organization of the Petroleum Exporting Countries (OPEC) and its allies, collectively known as OPEC+. These cuts, aimed at supporting oil prices, have helped to restrict supply and contribute to the tightening market conditions. While OPEC+ is considering easing the cuts in the coming months, the extent of this easing and its impact on the market remain uncertain.
Geopolitical Instability: Geopolitical tensions around the world, particularly in major oil-producing regions, can also disrupt supply and push prices higher. Recent events, such as ongoing conflicts or threats to critical infrastructure, highlight the vulnerability of the global oil supply chain.
Limited Non-OPEC Growth: While concerns persist about a potential slowdown in global economic growth, particularly in China, the anticipated increase in oil production from non-OPEC members may be less pronounced than previously expected. This could further exacerbate supply constraints and bolster the case for oil bulls.
However, some headwinds remain: It's important to acknowledge the countervailing factors that could dampen oil prices. The persistent issue of inflation in the US, for instance, could lead to interest rate hikes by the Federal Reserve. This, in turn, could strengthen the US dollar and make oil, priced in dollars, more expensive for buyers using other currencies, potentially dampening demand.
Conclusion: Despite these headwinds, the evidence of a tightening physical market, coupled with OPEC+ production cuts, geopolitical uncertainties, and limited non-OPEC growth, paints a compelling picture for a potential oil price rally. For investors with a long-term perspective, strategically going long on oil could be a profitable decision. However, careful monitoring of factors that might impact supply and demand, such as global economic conditions and policy decisions, is crucial for managing risk and making informed investment choices.

Crude oil Crude oil is my new analysis.if u like it please hit like button. If not please write comments. Thanks,

WTI 84.330 - 84.440 SELL AREA !WTI 84.330 - 84.440 SELL AREA !
WTI 84.330 - 84.440 SELL AREA !
WTI 84.330 - 84.440 SELL AREA !
Lost sendiri tanggung ya !
tayor !

WTI Crude Oil: Analyzing Rebound PatternsThe WTI (West Texas Intermediate) crude oil market has shown resilience, staging a recovery subsequent to a pullback retracing between the key Fibonacci levels of 50% to 61.8% from the preceding major swing. Notably, the current price action exhibits a divergence pattern, notably intersecting with the levels of prior support. Moreover, a discernible confirmation pattern emerged following a retest of this support, serving as a pivotal factor in our decision to initiate a trade. Furthermore, it's noteworthy that the current price trajectory remains positioned above the 200-period Volume Weighted Average Price (VWAP), reinforcing our conviction in the potential for a sustained bullish impulse to unfold.

USOUSD, OILUSOUSD is in a correction period. The price has an opportunity to retest the 81.12 and 80.05 support zones. If the price cannot break through the 80.05 level, there is a chance that the price will rebound. Consider buying a red zone.
>>GooD Luck 😊
❤️ Like and subscribe to never miss a new idea!

USOIL again looking for upside Hey there on 1htF the USOIL has been touched our previous target 84 and now also moved some downside and again looking for buy side
oil patternsOil price is managed.
It trades in a range for decades until high inflation forces it to break out of that range.
Should the oil price break out of the current range. it will form a new range.

WTI Oil H4 | Falling to 61.8% Fibonacci supportWTI oil (USOIL) is falling towards a pullback support and could potentially bounce off this level to climb higher.
Buy entry is at 81.04 which is a pullback support that aligns with the 61.8% Fibonacci retracement level.
Stop loss is at 80.00 which is a level that lies underneath a pullback support.
Take profit is at 84.47 which is an overlap resistance.
High Risk Investment Warning
Trading Forex/CFDs on margin carries a high level of risk and may not be suitable for all investors. Leverage can work against you.
Stratos Markets Limited (www.fxcm.com):
CFDs are complex instruments and come with a high risk of losing money rapidly due to leverage. 66% of retail investor accounts lose money when trading CFDs with this provider. You should consider whether you understand how CFDs work and whether you can afford to take the high risk of losing your money.
Stratos Europe Ltd, previously FXCM EU Ltd (www.fxcm.com):
CFDs are complex instruments and come with a high risk of losing money rapidly due to leverage. 70% of retail investor accounts lose money when trading CFDs with this provider. You should consider whether you understand how CFDs work and whether you can afford to take the high risk of losing your money.
Stratos Trading Pty. Limited (www.fxcm.com):
Trading FX/CFDs carries significant risks. FXCM AU (AFSL 309763), please read the Financial Services Guide, Product Disclosure Statement, Target Market Determination and Terms of Business at www.fxcm.com
Stratos Global LLC (www.fxcm.com):
Losses can exceed deposits.
Please be advised that the information presented on TradingView is provided to FXCM (‘Company’, ‘we’) by a third-party provider (‘TFA Global Pte Ltd’). Please be reminded that you are solely responsible for the trading decisions on your account. There is a very high degree of risk involved in trading. Any information and/or content is intended entirely for research, educational and informational purposes only and does not constitute investment or consultation advice or investment strategy. The information is not tailored to the investment needs of any specific person and therefore does not involve a consideration of any of the investment objectives, financial situation or needs of any viewer that may receive it. Kindly also note that past performance is not a reliable indicator of future results. Actual results may differ materially from those anticipated in forward-looking or past performance statements. We assume no liability as to the accuracy or completeness of any of the information and/or content provided herein and the Company cannot be held responsible for any omission, mistake nor for any loss or damage including without limitation to any loss of profit which may arise from reliance on any information supplied by TFA Global Pte Ltd.
The speaker(s) is neither an employee, agent nor representative of FXCM and is therefore acting independently. The opinions given are their own, constitute general market commentary, and do not constitute the opinion or advice of FXCM or any form of personal or investment advice. FXCM neither endorses nor guarantees offerings of third-party speakers, nor is FXCM responsible for the content, veracity or opinions of third-party speakers, presenters or participants.

USOIL.. where is market top? What's next?#USOIL.. well guys market very well bounced back from 81 around.
Now we have 83.70 as market current resistance area.
Keep close eit because if market hold it then you can see a drop from here,
Otherwise not at all..
Good luck
Trade wisely

Crude oil trade analysis
The overall trend of crude oil hit the bottom yesterday, and the rebound did not break after testing 80.7 for the second time. It's still going strong. A positive hammer line collected on the daily chart. A close like this meant the market would rebound, and it has now. The key pressure level is 83.6. As long as the market does not break here, the market will continue to fluctuate at a low level. If it breaks through and stands firm, you can rest assured to be bearish and buy up. Friends who are stable can wait patiently after breaking through 83.6 and then buy up when approaching 82. Continue to watch for a breakthrough of 83.6 above!

USOIL BUY (Still valid)USOIL bought then consolidated created a false break out to the down side and went up(accumulation, manipulation, distribution, etc.). We still in strong bulls for USOIL FOREXCOM:USOIL FX:USOIL TVC:DXY . This is only a trade idea, use risk management. Happy trading

🔥🔥🔥100% profit signal!!!✅✅✅After a brief adjustment, crude oil is expected to resume its upward trend. It is advised to wait for opportune moments to continue taking long positions on crude oil, with upside targets focusing on the $88-90 range.
All signals I issued in April have resulted in profits, maintaining a consistent 100% accuracy rate. Weekly profits of at least 200% can be attained. Do not miss out on my accurate signals!

XTIUSD (US OIL/ WTI) : 1800+ Pips Opportunity| Setupsfx_ |Dear Traders,
Hope you are doing great, US OIL still has high chances of touching the 90.00 region and beyond. Price made correction after rejecting at 87.00, price dropped to 80.00 from where we think price is likely to continue the bullish momentum. However, it is crucial to keep next week news in mind as well.
Good Luck

USOIL BEST PLACE TO SELL FROM|SHORT
Hello,Friends!
We are targeting the 80.21 level area with our short trade on USOIL which is based on the fact that the pair is overbought on the BB band scale and is also approaching a resistance line above thus going us a good entry option.
✅LIKE AND COMMENT MY IDEAS✅

