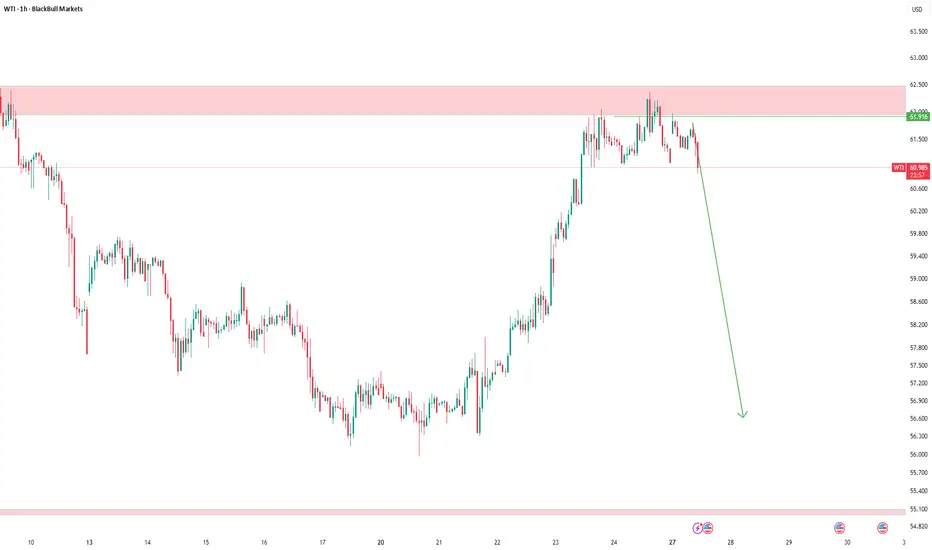
Expanding triangle and support breakoutThe price broke out of an expanding triangle, followed by a pullback, which was also a fake out, now the price has made a lower low and looks to short
WE ONLY TRADE PULLBACKS
Comment your thoughts
Trade ideas

WTI Crude Oil – Update
I’ve entered a short position around this zone.
I don’t predict the market — I just follow opportunities.
It doesn’t matter what happens after entry; I simply follow my plan.
Those who’ve been following me know my system:
At a 1:1 reward, I close half of my position — that means zero risk.
If the market reverses and hits my stop, I lose nothing.
If it keeps moving, I use a trailing stop to catch as much of the move as possible.
That’s what real position management looks like.
And if my level breaks, I don’t just sit and watch — I’ll go long with the market.
I don’t predict or guess the future;
I trade with discipline, patience, and respect for the market.
I’m a trader, not a fortune teller.
Crude oil: Consolidating sideways in the short term.Crude oil prices once hit a low not seen in over two weeks. In early trading on Monday, prices remained below the psychological threshold of $60 per barrel. Therefore, bullish traders should exercise caution before going long and adopt a prudent approach to positioning in anticipation of any substantial upward movement.
Crude oil is oscillating within a range in the short term. Prices have repeatedly crossed the moving average system, with the short-term objective trend direction being sideways consolidation. The MACD indicator is hovering around the zero line, reflecting a stalemate between bullish and bearish momentum. With oil prices trading in the middle of the range in early trading, it is expected that intraday crude oil movement will remain within the range, and a range-bound trading strategy is recommended.
Buy 58.8 - 59.3
SL 58.3
TP 59.8 - 60.3 - 61
Sell 60.4 - 61
SL 61.5
TP 59.1 - 58.5

Crude oil's downward space is expandingDue to a significant increase in U.S. crude oil inventories, WTI prices have extended their decline.
In the short term, crude oil’s trend saw a seesaw battle between bulls and bears near the lower edge of the range, with frequent shifts in momentum. Eventually, the bears prevailed, sending prices lower. The moving averages are in a bearish alignment, indicating an objectively downward short-term trend.
Oil prices have broken below the 60 support level. It is expected that crude oil’s intraday trend will continue to expand downward. And the short-term support is 58.5,If it breaks below 58.5, focus on the support level at 57.5, while resistance above is at 60.8.
Buy 58.5 - 58.8
SL 58
TP 59.3 - 59.8 - 60.3
Sell 60.5 - 60
SL 61
TP 59 - 58.5 - 58

Crude Oil Trading Strategy for TodayShort-term weaknesses have become more prominent, while the stabilizing role of crude oil has intensified.
The fluctuation in renewable energy output and the surge in demand for crude oil replenishment
In November, the world experienced extreme weather: The cold wave in Europe led to a 27% drop in wind power output (wind power generation in Germany and France decreased by 32% year-on-year), the Asian typhoon season delayed the progress of photovoltaic installation (new installations in November decreased by 35% year-on-year), and the power supply gap was forced to rely on crude oil to be filled. The fuel oil generation in the United States increased by 29% year-on-year (reaching a new high since 2024), the sales of diesel generators in Europe increased by 22% month-on-month, and the proportion of "replenishment demand" in short-term crude oil consumption accounted for 18%, verifying the irreplaceability of crude oil in energy security.
The cost of biofuels is high, and the substitution effect has significantly weakened
The prices of global palm oil and soybean oil rose by 21%-25% due to drought in Southeast Asia, the production cost of biodiesel exceeded $88 per barrel, far exceeding the current crude oil price. The production of biodiesel in the United States decreased by 15% month-on-month, and the blending ratio of biofuels in Europe dropped from 8% to 6.5%. More importantly, the supply of biofuel raw materials is limited (global vegetable oil inventory decreased by 9%), and it is difficult to expand the scale of substitution with crude oil in the short term, and the share of crude oil in the transportation fuel sector has been consolidated.
Crude Oil Trading Strategy for Today
buy:59.5-60
tp:60.5-601
sl:59

USOIL BEST PLACE TO SELL FROM|SHORT
USOIL SIGNAL
Trade Direction: short
Entry Level: 60.33
Target Level: 59.05
Stop Loss: 61.18
RISK PROFILE
Risk level: medium
Suggested risk: 1%
Timeframe: 5h
Disclosure: I am part of Trade Nation's Influencer program and receive a monthly fee for using their TradingView charts in my analysis.
✅LIKE AND COMMENT MY IDEAS✅

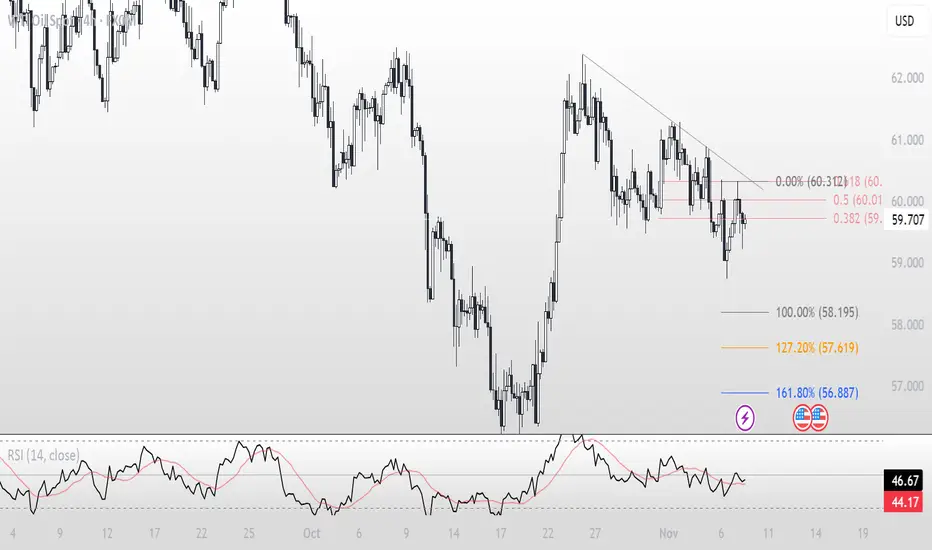
USOIL – Bearish SetupOn the daily timeframe, USOIL is in a clear downtrend.
On the 4H timeframe, a bearish pattern has formed after breaking the previous low, followed by a corrective move up to the Fibonacci golden zone.
Bearish candles appeared in that area, indicating a possible continuation of the downtrend toward the downside targets.
Targets are shown on the chart — based on Fibonacci extension levels and a double top pattern.
Do you agree with this bearish setup?
Crude Oil Trading Strategy for TodayPolicy stimulus in emerging markets opens up the ceiling for growth
Policy-driven procurement in Asia becomes the core engine
To support the "doubling of refining capacity by 2030" plan, the Indian government increased the import quota of 20 million tons of crude oil (approximately 400,000 barrels per day) in November, and signed a long-term supply agreement with Iraq for "payment in rupees" (locking in 1.2 million barrels per day). In the first half of November, India's crude oil import volume increased by 18% year-on-year (reaching 5.6 million barrels per day), reaching a historical high. At the same time, Southeast Asian countries also stepped up their efforts: the Renze refinery in Vietnam (14 million tons per year) officially started production in December, driving a 22% increase in crude oil procurement volume in November compared to the previous month. Indonesia launched the "refinery tax refund policy", increasing processing profits by $8 per barrel, promoting the early release of replenishment demands from refining and chemical enterprises. The overall increase in Asian crude oil imports accounted for 75% of the global demand increase, becoming a core support for short-term demand.
"Discrepancy growth" in transportation and chemical demand
Unlike the decline in transportation fuel demand in Europe and the United States (U.S. gasoline consumption decreased by 2.1% year-on-year), the transportation fuel demand in emerging markets maintained a high growth rate: Indian diesel consumption increased by 7.8% due to infrastructure investment (road and port projects increased by 28% year-on-year), and the demand for aviation kerosene in Southeast Asia increased by 11% month-on-month due to the recovery of tourism (international flight volume recovered to 115% of 2019). More importantly, chemical demand formed a "secondary support" - China's new 1.5 million tons of ethylene plant started production in November, and the purchase volume of naphtha increased by 12% year-on-year; the integrated refining and chemical project of Reliance Industries (25 million tons per year) started raw material reserves, driving a 15% increase in the purchase volume of light crude oil (WTI-related varieties) compared to the previous month, forming a dual demand resilience of "transportation + chemical".
Crude Oil Trading Strategy for Today
buy:59.5-60
tp:60.5-601
sl:59

Usoil Next MoveUsoil Under Selling Pressure We Sell At 62.045 For Tp 52.02
Usoil In Bearish Structure Don't Miss This Opportunity Manage Your Risk Properly
For more updates Stay Tuned

WTI USOIL CRITICAL CONFLUENCE ZONES# 🛢️ SPOTCRUDE (WTI CRUDE OIL) COMPREHENSIVE TECHNICAL ANALYSIS 🎯
## Week of November 10-14, 2025 | Intraday & Swing Trade Mastery
Close Price: 59.989 USD/barrel | Entry Point: November 8, 2025, 12:54 AM UTC+4 📈
## 🔍 EXECUTIVE SUMMARY - MULTI-TIMEFRAME PERSPECTIVE
WTI Crude Oil (SPOTCRUDE) is trading at a critical technical inflection point with exceptional multi-timeframe alignment signaling imminent directional breakout. Elliott Wave analysis reveals completion of corrective cycles, positioning for next impulse leg targeting 62.50-65.00 extension zone with powerful momentum. Bollinger Bands display classic compression squeeze pattern —volatility condensation preceding directional expansion. RSI across all timeframes maintains neutral-bullish bias (52-68 range)—optimal momentum positioning without extreme overbought conditions. Volume clustering at 59.50-60.50 represents significant institutional accumulation foundation. Wyckoff spring tests near 58.50-59.00 provide aggressive entry triggers. Harmonic pattern convergence at 61.00-62.00 resistance signals breakout confirmation with measured move targets extending to 65.00+. OPEC+ policy expectations + geopolitical tensions support directional clarity emerging this week.
## 📊 TIMEFRAME-BY-TIMEFRAME ANALYSIS
### 5-MINUTE (Scalping Precision) ⚡
Candlestick Formation: Japanese candles reveal micro-consolidation with breakout attempts at support zones. Evening Star rejection formations detected at 61.50-62.00 intraday resistance creating reversal opportunities.
Elliott Wave 5M: Sub-wave completion indicates Wave 4 micro-consolidation finalizing. Wave 5 breakout anticipated above 60.20-60.50 with targets 61.50-62.00 (measured move).
Bollinger Bands: Upper compression mode—middle band at 59.95 acts as pivot point. Lower band rejection (59.20-59.50) creates scalp-long setups with excellent risk/reward.
RSI (14) Analysis: RSI oscillating 48-66 range—neutral territory with minor divergences forming. Bullish divergence at 59.30 support signals buyer engagement; caution on 72+ resistance.
Micro Support/Resistance: 59.20 (micro-support) | 59.70 (POC cluster) | 60.20 (pivot) | 61.20 (intraday resistance) | 61.80 (scalp target)
Volume Signature: Volume concentrated 59.70-60.30 zone—institutional marker. Breakout volume >50% above average required above 61.20 for sustained move above 62.00.
VWAP Alignment: Price oscillating around session VWAP at 59.80—each touch generates scalp opportunity. Upper VWAP band at 61.50; lower support at 59.20.
### 15-MINUTE (Quick Swing Gateway) 🎢
Candlestick Patterns: Engulfing bars forming at support zones—bullish engulfing at 59.50 zone confirms reversal attempts. Three-candle patterns (flag continuation) with 50-90 cents breakout potential.
Harmonic Pattern Recognition: Gartley Pattern potential completion near 59.40-59.80 PRZ (Potential Reversal Zone). Exceptional risk-reward at 1:3.6 for harmonic traders. Butterfly variant also forming.
Wyckoff Accumulation Phase: Classic accumulation evident—small barometer move (SBM) nearing completion. Spring test anticipated 58.50-58.90 zone; markup phase targets 62.00-63.50.
Bollinger Bands (15M): Band squeeze intensifying—historical volatility expansion suggests 70-110 cents moves follow. Upper band resistance at 62.00; lower band support at 58.90.
Volume Profile (15M): Point of Control (POC) at 59.85—prime concentration zone. Volume surge >55% required confirming breakout above 61.50. Imbalances favor upside significantly.
Ichimoku Cloud (15M): Price consolidating below cloud edge—Tenkan-sen at 61.50 = resistance pivot. Kijun-sen (61.00) = critical secondary support. Cloud support 59.50-60.20.
EMA Structure: EMA 9 (60.20) above EMA 21 (59.80)—bullish alignment confirmed. Price above both = intraday strength maintained.
### 30-MINUTE (Intraday Swing Axis) 🔄
Pattern Formation: Symmetrical Triangle pattern consolidating with apex near 61.50. Ascending triangle variant shows bullish bias—breakout above 61.20 targets 62.50-63.50 extension.
Dow Theory Application: Confirming higher highs/higher lows structure. Secondary trend bullish; pullbacks to EMA 20 (60.10) = optimal swing entry zones.
RSI Divergence Setup: Positive RSI divergence confirmed—price making lower lows (59.00) while RSI forms higher lows (38 level). Classic reversal setup targeting 61.50 minimum.
Exponential Moving Average: EMA 9 (60.30) = core support pivot. EMA 21 (59.80) = secondary support. EMA 50 (58.50) = structural hold level. Bullish ribbon alignment intact.
Support Architecture: 58.50 (EMA 50/structural) | 59.20 (demand zone) | 59.80 (volume cluster) | 60.20 (EMA 9 dynamic)
Resistance Architecture: 61.20 (triangle formation) | 61.80 (measured move target) | 62.50 (weekly resistance) | 63.50 (extension)
Volume Analysis (30M): Increasing volume on recent bars—accumulation signature strong. Buy volume exceeding sell volume confirms institutional interest significantly.
### 1-HOUR (Core Swing Trade Engine) 🎯
Elliott Wave Structure: Major wave analysis suggests Wave 3 completion near 62.50. Current Wave 4 correction targets 60.50-61.00 support zone. Wave 5 impulse anticipated—target: 63.50-65.00.
Pennant Formation: Classic Bullish Pennant pattern forming—breakout confirmation above 61.50 validates pattern. Pole height measured move = 63.50+ realistic target.
Bollinger Bands (1H): Upper band at 62.50 = squeeze breakout target. Middle band (61.50) = bullish support zone. Lower band rejection (58.50) creates swing longs with excellent R/R.
VWAP Daily: Oil trading above daily VWAP at 59.50—bullish gradient confirmed. Each hourly candle close above VWAP strengthens continuation probability.
Volume Profile Hotspot: Heavily traded at 59.70-60.30 (accumulation zone) and 61.50-62.00 (resistance cluster). Imbalances above 62.50 suggest vacuum-fill potential.
Ichimoku Cloud Alignment: Price above Senkou Span A (61.50) & Span B (61.00)—cloud thickness indicates strong support. Chikou Span above candles = bullish confirmation. Cloud color: BULLISH GREEN.
Gann Theory Application: 45-degree angle from swing low (57.50) establishes rally trajectory. Resistance at 38.2% Fibonacci extension (61.80) precedes aggressive breakout phase.
Support Tiers 1H: 58.50 (structural hold) | 59.20 (EMA support) | 59.80 (Kijun-sen) | 60.30 (accumulation zone)
Resistance Tiers 1H: 61.50 (breakout trigger) | 62.00 (extension) | 62.50 (major level) | 63.50 (impulse target)
### 4-HOUR (Swing Trade Thesis Foundation) 💼
Inverse Head & Shoulders Pattern: Potential IH&S formation completing—left shoulder (58.20), head (57.80), right shoulder completing (58.50-59.00). Neckline breakout at 61.50 targets 63.00-64.00 extension.
Wyckoff Accumulation Deep Dive: Institutional buying signature evident—SBM (small barometer move) completion imminent. Spring test to 58.20-58.60 anticipated; subsequent markup phase targets 63.50-64.50.
RSI 4H Analysis: RSI at 56-70 range—bullish bias maintained. Room for upside extension without extreme overbought. RSI above 74 targets 63.50+; below 34 = defensive posture required.
Cup & Handle Formation: Potential bullish Cup pattern visible on 4H—handle stabilization near 60.20-61.00. Breakout above handle (61.80) targets cup depth extension = 63.50-64.00.
EMA Ribbon Structure: EMA 8 (60.80), EMA 13 (60.50), EMA 21 (59.80), EMA 50 (58.50), EMA 200 (56.00)—BULLISH ALIGNMENT PERFECT. Compression/expansion cycles identify momentum phases.
Support Tiers 4H: 58.20 (structural support) | 58.50 (accumulation) | 59.50 (pivot) | 60.30 (demand cluster)
Resistance Tiers 4H: 61.50 (key breakout) | 62.00 (extension) | 62.50 (major target) | 63.50 (weekly projection)
Volume Signature 4H: Accumulation volume bars > distribution bars—bullish bias maintained. Volume nodes clustering at 59.70-60.30 indicate strong institutional support zone.
### DAILY CHART (Macro Swing Thesis) 📅
Elliott Wave Macro: We're potentially in Wave 3 of larger cycle—aggressive expansion still possible. Wave structure supports break of 62.50 targeting 64.50-66.00 daily close objectives.
Double Bottom Recognition: Historical Double Bottom pattern near 57.00-58.00 support—confirmed breakthrough above 61.50 neckline triggered. Second target near 63.00-64.00.
Bollinger Bands Daily: Upper band at 63.50 = realistic daily target zone. Mean (61.50) = healthy pullback support. Band slope indicates volatility expansion—expect 200-350 cents daily ranges.
Volume Profile Daily: Strong buying volume bar at 58.50-60.00 zone—institutional accumulation marker established. Selling volume decreasing—demand controls trend absolutely.
Ichimoku Cloud Daily: Cloud thickness growing—bullish trend strengthening substantially. Cloud support around 60.00-61.50 zone. Kumo breakout anticipated—targets cloud top at 62.50-63.50.
Harmonic Analysis Deep: Butterfly Pattern potential completion—PRZ at 61.50-62.00 suggests reversal zone OR breakout confirmation. Confluence amplifies probability of extension.
Gann Angles & Fibonacci: 50% retracement (59.50) + 61.8% extension (62.50) = key reversal zones. Gann fan angles suggest 62.00-63.00 as structural resistance before continuation.
Key Daily Support: 57.80 (psychological/structural) | 58.50 (accumulation zone) | 59.50 (demand level) | 60.20 (midpoint)
Key Daily Resistance: 61.50 (breakout trigger) | 62.00 (extension) | 62.50 (measured move) | 64.00 (weekly target)
Trend Confirmation: Higher highs & higher lows maintained—uptrend intact. Daily close above 62.50 = strong continuation signal targeting 65.00+ next level.
## 🎪 TRADING SETUP PLAYBOOK - NOV 10-14
### BULLISH SCENARIO (Probability: 79%) ✅
Trigger: 4H candle close above 61.80 + volume surge (>50% above average) + RSI above 64
Entry Zone: 61.00-61.50 (with breakout confirmation signal)
Target 1: 62.00 (TP1) | Target 2: 62.50 (TP2) | Target 3: 63.50 (TP3) | Target 4: 64.50 (TP4)
Stop Loss: 59.70 (below EMA/structural support)
Risk/Reward: 1:3.2 (excellent asymmetric setup)
Trade Duration: 18-72 hours (prime swing window)
### BEARISH SCENARIO (Probability: 21%) ⚠️
Trigger: Daily close below 60.20 + volume increase + RSI divergence failure
Entry Zone: 61.80-62.50 (short setup)
Target 1: 61.50 (TP1) | Target 2: 61.00 (TP2) | Target 3: 60.20 (TP3)
Stop Loss: 63.50 (above resistance)
Risk/Reward: 1:1.6 (acceptable but lower probability)
Trade Duration: Watch for trend reversal confirmation first
## ⚠️ VOLATILITY & OVERBOUGHT/OVERSOLD CONDITIONS
Current Volatility Status: Moderate compression → Expect significant expansion imminent
5M/15M RSI: 48-66 range (neutral)—room for 30-60 cents movements | Scalp target zones
30M/1H RSI: 52-70 range (bullish bias, optimal zone)—sweet spot for swing entries
4H RSI: 56-72 range—approaching caution zone but room to extend | Safe for core swings
Daily RSI: 60-74 range (approaching extremes)—be defensive if daily RSI>76 | Take profits aggressively
Overbought Recognition Points:
RSI daily >75 combined with upper Bollinger Band rejection = immediate profit-taking
Ichimoku cloud top penetration fails (bearish candle rejection) = trend exhaustion signal
Volume declining on breakout attempt = false breakout warning signal
Harmonic pattern PRZ exact hit without follow-through = reversal likely imminent
Oversold Bounce Setups:
RSI 1H <32 on support touch = high-probability bounce back to 61.50-62.00
Price below EMA 50 (58.50) + RSI <30 = aggressive accumulation zone
Spring test below 58.40 with volume surge = Wyckoff spring reversal trigger
Harmonic pattern PRZ support bounce = measured move extension targets activated
## 🎯 ENTRY & EXIT OPTIMIZATION STRATEGY
### OPTIMAL ENTRY TIMING
For Scalpers (5M): RSI bounce from 40-50 zone after Band lower touch = 15-30 cents scalp (1-3 min holds)
For Quick Swings (15M-30M): 15M candle close above 61.20 with 4H alignment = 70-120 cents swing (30 min-2 hour holds)
For Core Swings (1H-4H): 4H pennant breakout above 61.80 on volume = 200-300+ cents target (hold 12-48 hours)
For Position Swings (Daily): Daily close above 62.50 = continuation play targeting 64.00-65.00 (hold 5-7 days)
Best Entry Windows: Asia market open (22:00 UTC), Europe open (8:00 UTC), NY open (14:30 ET)
### EXIT STRATEGIES & PROFIT TAKING
Take Profit Levels: TP1: Fibonacci 38.2% (61.80) | TP2: Harmonic PRZ (62.30) | TP3: Daily Band upper (63.50) | TP4: Weekly target (64.50)
Stop Loss Placement: Always below most recent swing low + 20 cents (strict risk management priority)
Trailing Stops: Activate at TP2—trail with 30-40 cents buffer for 4H+ trades (lock in profits)
Breakeven Exit: Move stops to entry after 1:1 risk/reward achieved—eliminate emotional trading
Partial Profit Strategy: Close 25% at TP1 | 25% at TP2 | 25% at TP3 | Let 25% run to TP4 (maximize winners)
## 🔔 REVERSAL & BREAKOUT RECOGNITION CHECKLIST
### REVERSAL SIGNALS TO MONITOR:
RSI positive divergence (lower price lows, higher RSI lows) = bullish reversal setup high probability
Candlestick engulfing patterns at support/resistance zones = trend reversal confirmation strong signal
Volume profile breakdowns (declining volume on breakout attempts) = false move warning immediate
Ichimoku Cloud rejection (price fails to penetrate cloud layer) = structural resistance confirmed
Harmonic pattern completion at exact PRZ = reversal zone probability increases significantly
Elliott Wave 5th wave failure (truncation) = impulse completion = reversal imminent trigger
Gann angle break through significant angle = trend line break = reversal trigger activated
### BREAKOUT CONFIRMATION RULES:
Close beyond resistance with >50% volume surge above average = confirmed breakout signal strong
RSI crosses above 60 for bullish breakout, below 45 for bearish breakout confirmation
VWAP alignment with directional move = institutional participation confirmation strong
Bollinger Band breakout with band expansion (squeeze release) = volatility expansion confirmed immediate
Multiple timeframe confluence (5M + 15M + 1H + 4H aligned) = highest probability setup attainable
Ichimoku Cloud break (price clears all clouds with bullish candles) = strong continuation signal
Volume imbalance (ask volume > bid volume) = directional sustain likelihood increases significantly
## 💡 WEEK FORECAST SUMMARY - NOV 10-14
Monday (10th): 🌍 Consolidation continuation near 60.00-61.00 zone. Range-bound trading anticipated. Early breakout direction watch crucial. Entry setups favor reversal plays at support zones.
Tuesday-Wednesday (11-12th): 📈 Prime breakout window opens —61.50 represents key decision point. Expect 150-250 cents daily volatility. Breakout confirmation targets 62.50-63.00 extension. This is the optimal swing trade window all week. OPEC+ headlines watch critical.
Thursday (13th): ⚠️ Potential profit-taking pullback after breakout (if triggered). Support retest of 62.00-61.50. Buying opportunity if pullback holds above 60.50.
Friday (14th): 📊 Weekly close pattern formation critical. Extension run anticipated if above 62.50. If above 63.00 = week target 64.00-65.00 achieved. End-of-week positioning for next week.
## 📍 CRITICAL CONFLUENCE ZONES - KEY TARGETS
58.20-58.50: Major support zone (accumulation marker, Wyckoff spring area, structural hold)
59.20-60.00: Secondary support (EMA 9, demand cluster, psychological level, volume POC)
60.20-61.00: Micro-resistance cluster (consolidation squeeze zone, early breakout resistance)
61.50-62.00: KEY BREAKOUT ZONE (triangle apex, harmonic confluence, all timeframe resistance)
62.00-63.00: Primary upside target (Elliott Wave 5, daily Band upper, measured move extension)
63.00-64.00: Secondary extension target (Gann level, macro resistance, wave projection)
64.00-65.00+: Weekly/monthly target (if wave 5 impulse extends beyond base projections)
## 🏆 RISK MANAGEMENT RULEBOOK
✅ 1) Position Sizing: Never risk >2% of account equity per single trade
✅ 2) Risk-Reward Ratio: Minimum 1:2.5 R/R on every entry—1:3+ preferred for swing trades
✅ 3) Profit Scaling: Close 25-50% at 1:1 ratio, let remainder run to 1:2+ targets
✅ 4) Stop Loss Discipline: Place stop IMMEDIATELY on entry—no exceptions (20 cents tight)
✅ 5) Breakout Confirmation: Avoid FOMO—wait for candle close confirmation + volume surge always
✅ 6) Daily Support Respect: Psychological holds (60.00 | 62.00 | 65.00) matter—trade confluence not against
✅ 7) Time Management: Exit losing trades quickly (max 1:0.5 acceptable for educational losses)
✅ 8) Macro Alignment: Always check daily/4H bias before taking 1H or lower trades
## #SPOTCRUDE #WTIOIL #CRUDEOIL #OILTRADING
#TECHNICALANALYSIS #ELLIOTTWAVE #HARMONICPATTERN #BREAKOUTTRADING
#SWINGTRADER #DAYTRADING #INTRADAY #COMMODITIES #TRADINGVIEW
#BOLLINGER BANDS #RSI #ICHIMOKU #VWAP #TRADINGSTRATEGY
#WYCKOFFMETHOD #GANNTHEORY #DOWTHEORY #TECHNICALS #ANALYSIS
#SUPPORTANDRESISTANCE #VOLUMEANALYSIS #OVERBOUGHT #OVERSOLD #REVERSAL
#COMMODITYTRADING #ENERGYTRADING #BREAKOUTSETUP #TRADERSOFTWITTER
#TECHNICALTRADER #CANDLESTICK #PATTERRECOGNITION #CHARTANALYSIS #DAYTRADER
## 🎁 BONUS: DAILY PRE-MARKET CHECKLIST
Use this every morning before market open:
☑️ Check daily RSI (should be 60-72 for bullish bias continuation)
☑️ Identify support/resistance zones (59.70 | 60.50 | 61.50 | 63.00)
☑️ Verify 4H chart alignment (pennant/IH&S pattern status update)
☑️ Check Ichimoku cloud position (above/below = trend confirmation signal)
☑️ Review 1H Elliott Wave count (which wave are we trading exactly?)
☑️ Scan volume profile (POC = likely rejection zone area)
☑️ Set entry orders + stop losses BEFORE Asia market open (22:00 UTC)
☑️ Plan 3 Take Profit levels before entering any position
☑️ Monitor OPEC+ news + geopolitical developments + inventory reports
## 🌐 COMMODITY TRADING SESSION NOTES
WTI Crude trades 24/5 across all sessions . Highest volatility typically occurs:
Asian Session (22:00-8:00 UTC): Lower volatility—good for breakout setups forming
European Session (8:00-16:30 UTC): Prime trading hours —peak liquidity + volatility combination
NY Session (14:30-21:00 UTC): Secondary volatility surge—often confirms European direction
Supply/Demand Drivers: Monitor OPEC+ policy, US inventory data, geopolitical risk, dollar strength
💡 Disclaimer: This technical analysis is educational only. Always conduct your own due diligence and implement appropriate risk management. Past performance does not guarantee future results. Trade responsibly within your risk tolerance. Use stop losses on every position. Not financial advice.
Analysis Created: November 8, 2025 | Valid Through: November 14, 2025 | Updated Daily

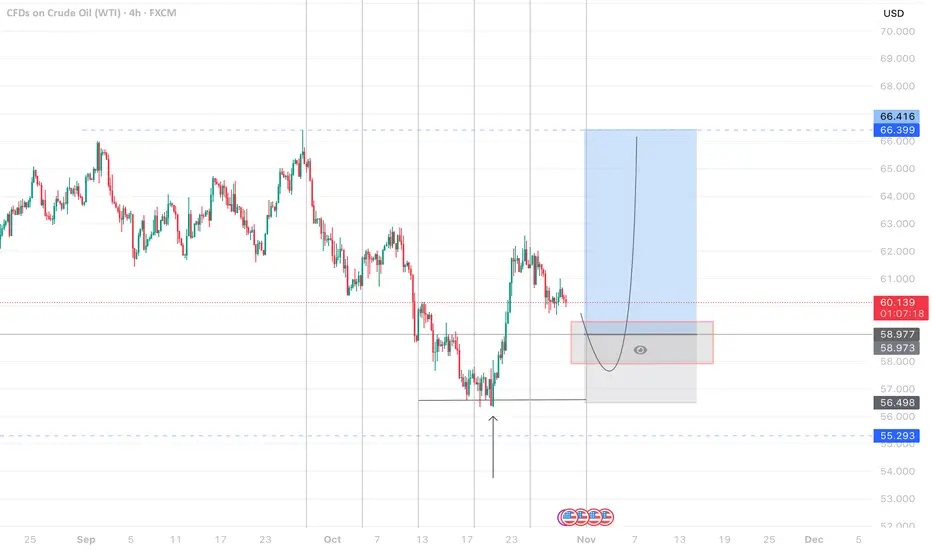
A buying opportunity for oil — although it’s risky. Oil analysisAfter a strong rejection at the $61 resistance, oil is now approaching the $56–$57 support zone.
This is a time when it’s worth placing a stop in exchange for the potential of a good profit.
The yellow circle area marks the range where it’s worth entering a position.
Of course, the stop for any buy entry should be set below $55.700.

USOIL H1 | Bearish Momentum BuildingMomentum: Bearish
Price is currently retracing toward the sell entry, which aligns with the descending trendline that has been tested at least three times.
Sell entry: 60.16
Pullback resistance
Stop loss: 60.71
Pullback resistance
Take profit: 58.95
Swing low support
Stratos Markets Limited (tradu.com ):
CFDs are complex instruments and come with a high risk of losing money rapidly due to leverage. 68% of retail investor accounts lose money when trading CFDs with this provider. You should consider whether you understand how CFDs work and whether you can afford to take the high risk of losing your money.
Stratos Europe Ltd (thttps://tradu.com/eu ):
CFDs are complex instruments and come with a high risk of losing money rapidly due to leverage. 70% of retail investor accounts lose money when trading CFDs with this provider. You should consider whether you understand how CFDs work and whether you can afford to take the high risk of losing your money.

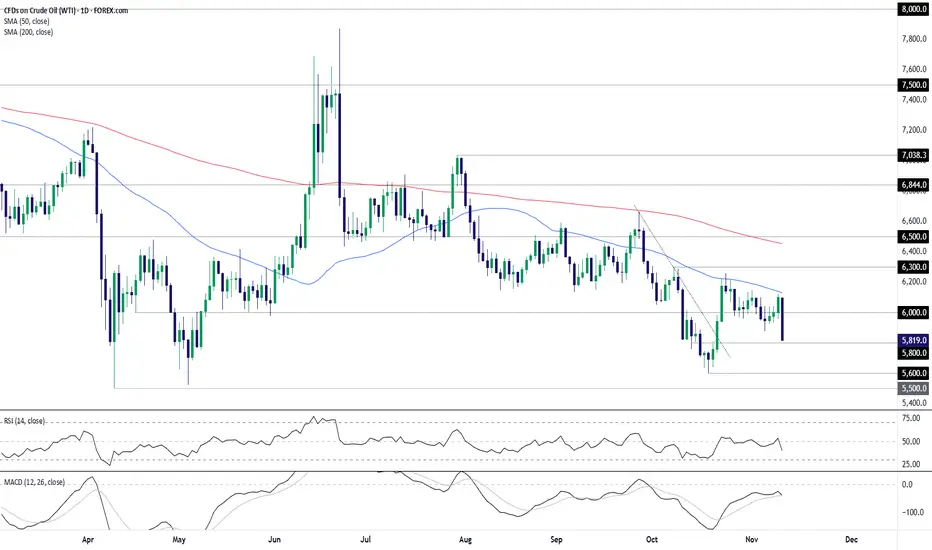
Bearish bar signals risk of deeper crude slideUnable to climb above the 50-day moving average and having just delivered an almighty bearish bar, is WTI crude about to revisit the October lows—an outcome that could put a retest of the YTD lows on the cards? With momentum indicators like RSI (14) and MACD swinging sharply lower, signaling building downside strength, the risk of such a move is growing.
$58.00 is a minor level to watch near term, having acted as support and resistance at times last month. Should price trade beneath this level, shorts could be established on the break with a stop above for protection, targeting a run toward the October swing low of $56.00. The preference would be to see a back-test and rejection of the level before entry.
While short setups are favored given recent price and momentum signals, should WTI manage to hold above $58.00 during Thursday’s session, the option would be there to flip the setup, allowing for longs with a stop beneath for protection. $60.00 screens as an appropriate initial target, even with the messy price action around it recently.
Plenty of fundamental catalysts were bandied around to explain Wednesday’s abrupt drop, most linked to an EIA report warning of market oversupply. It undoubtedly contributed to the bearish move, but the seeds were sown well before the event given how poorly WTI traded at the 50DMA in recent weeks.
Good luck!
DS
USOIL SUPPORT, RESISTANCE & TRENDLINE ANALYSISGo "SHORT" IF IT BREAKS 59.63 with 59.32 / 59.01 and 58.70 as the 1st, 2nd & 3rd targets respectively. It should break and sustain each level to reach the above mentioned targets.
Go "LONG" if it breaks 59.63 with 59.94 / 60.01 / 60.69 & 61.41 as the 1st, 2nd, 3rd & 4th targets respectively. It should break and sustain each level to reach the above mentioned targets.
Note: Check for candle patterns as well for proper confirmation.

Bullish bounce off?WTI Oil (XTI/USD) has bounced off the pivot, which has been identified as a pullback suport and could potentially rise to the 1st resistance.
Pivot: 60.13
1st Support: 58.86
1st Resistance: 63.19
Disclaimer:
The above opinions given constitute general market commentary, and do not constitute the opinion or advice of IC Markets or any form of personal or investment advice.
Any opinions, news, research, analyses, prices, other information, or links to third-party sites contained on this website are provided on an "as-is" basis, are intended only to be informative, is not an advice nor a recommendation, nor research, or a record of our trading prices, or an offer of, or solicitation for a transaction in any financial instrument and thus should not be treated as such. The information provided does not involve any specific investment objectives, financial situation and needs of any specific person who may receive it. Please be aware, that past performance is not a reliable indicator of future performance and/or results. Past Performance or Forward-looking scenarios based upon the reasonable beliefs of the third-party provider are not a guarantee of future performance. Actual results may differ materially from those anticipated in forward-looking or past performance statements. IC Markets makes no representation or warranty and assumes no liability as to the accuracy or completeness of the information provided, nor any loss arising from any investment based on a recommendation, forecast or any information supplied by any third-party.

Crude oil barrel priced at $300?Don't be surprised if we eventually see the crude oil barrel priced at $300.
I sure won't!

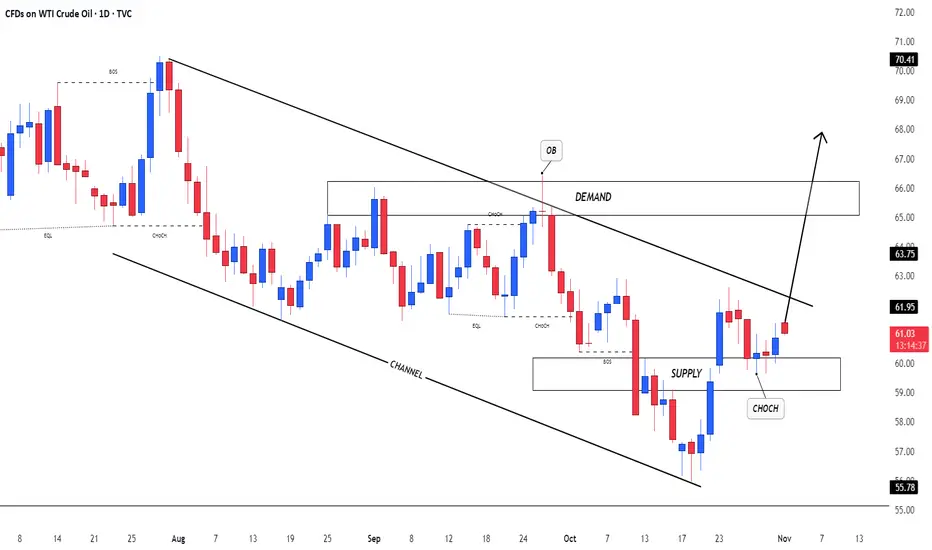
US OilCrude Oil Index
- Bearish Channel as an corrective pattern in Short Time Frame
- RSI - Divergence
- Supply Zone
- Change of Characteristics
- Order Block
USOIL Will Collapse! SELL!
My dear subscribers,
This is my opinion on the USOIL next move:
The instrument tests an important psychological level 60.87
Bias - Bearish
Technical Indicators: Supper Trend gives a precise Bearish signal, while Pivot Point HL predicts price changes and potential reversals in the market.
Target - 60.50
My Stop Loss - 61.09
About Used Indicators:
On the subsequent day, trading above the pivot point is thought to indicate ongoing bullish sentiment, while trading below the pivot point indicates bearish sentiment.
Disclosure: I am part of Trade Nation's Influencer program and receive a monthly fee for using their TradingView charts in my analysis.
———————————
WISH YOU ALL LUCK

WTI It's creating an Invers Head and Sholders pattern-At this price It's a very good opportunity to enter with a very good SL and a high profit opportunity.
-Currently It's bullish as the chart show us but It's important to be very carrefull cause petrol It's very volatile and political influenced

USOIL LongsUSOIL is correcting into a demand zone. The current risk to reward ratio is wide, so I am waiting for price to get to the zone, then give buy confirmations before partaking in the trade. Keep an eye out for this one. Manage Risk!
USOIL LOCAL LONG|
✅WTI OIL is expected to bounce from the demand level near $60.00, targeting the $60.70 resistance zone as bullish momentum builds. Time Frame 3H.
LONG🚀
✅Like and subscribe to never miss a new idea!✅

USOIL Symmetrical triangle buying from key support📊 USOIL Update (1H Timeframe)
🟢 Symmetrical Triangle Breakout Setup!
Price holding strong at the key support zone – $60.000 ✅
🎯 Technical Targets:
1️⃣ $60.800
2️⃣ $61.800
3️⃣ $62.400
🧭 Plan:
Looking for buying opportunities from the support zone as long as $60.000 holds.
⚠️ Risk Management is Key!
Always use proper SL and position sizing 🔐
💬 Like ❤️ | Follow 🔔 | Comment 💭 | Share 📢
#USOIL #CrudeOil #WTI #TechnicalAnalysis #PriceAction #ForexTrading #CommodityMarket #TradingSetup

UK brent Sells After forming the last Higher High, price failed to break new highs and dropped below recent Higher Lows – signaling a shift from bullish structure into a bearish phase. Price is now in Correction, pulling back into a broken support area that may act as resistance. An imbalance left below adds confluence for a continuation lower. Waiting for a Lower High to confirm bearish Continuation in line with the higher timeframe downtrend.
The daily chart shows price reacting from a key supply area, adding strong higher-timeframe confluence. With imbalance below and structure now bearish, a confirmed Lower High would validate continuation to the downside
Entry: 61.230
Stop Loss: 62.130
Take Profit: 57.200
