USOIL Oil prices are heavily influenced by supply/demand dynamics, geopolitical tensions, OPEC production policies, economic growth indicators, and inventory data.
Trading Tips:
Monitor OPEC announcements, especially decisions on quotas and production cuts.
Watch for geopolitical events in oil-producing regions like Iran, Venezuela, and the Middle East.
Keep an eye on US crude inventory reports, dollar strength, and macroeconomic data affecting demand.
Head of OPEC: Haitham Al-Ghais, Kuwait.
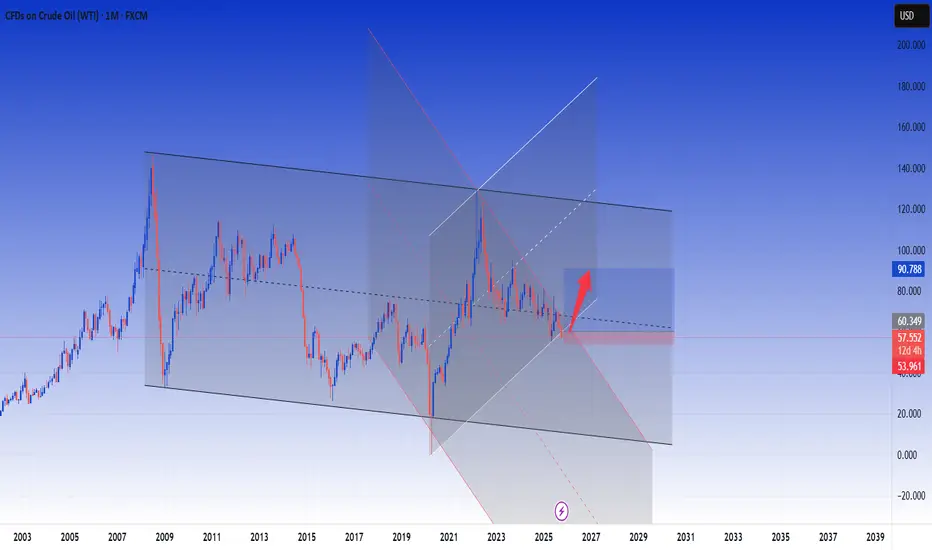
USOIL MARKET STRUCTURE .
WATCH KEY DEMAND FLOOR 55.932-55.899
BREAK AND CLOSE NEXT WATCH WILL BE 50.499-50.78$
WEEKLY SUPPORT ON DEMAND WILL BE 44.7%-45$ ZONE
KEY RSISTANCE 66.219-65.567
layer by layer ...we are looking at oil sell position and i will communicate soon on any potential position.
GOODLUCK
#OIL #USOIL #USD #DOLLAR #US1OY #DXY
Trade ideas

USOIL Trading IdeaBased on Simple Technical Analysis ( Trendline + Support & Resistance )
Risk Disclaimer:
Please be advised that I am not telling anyone how to spend or invest their money. Take all of my analysis as my own opinion, as entertainment, and at your own risk. I assume no responsibility or liability for any errors or omissions in the content of this page, and they are for educational purposes only. Any action you take on the information in this analysis is strictly at your own risk. There is a very high degree of risk involved in trading. Past results are not indicative of future returns. Good luck :-)
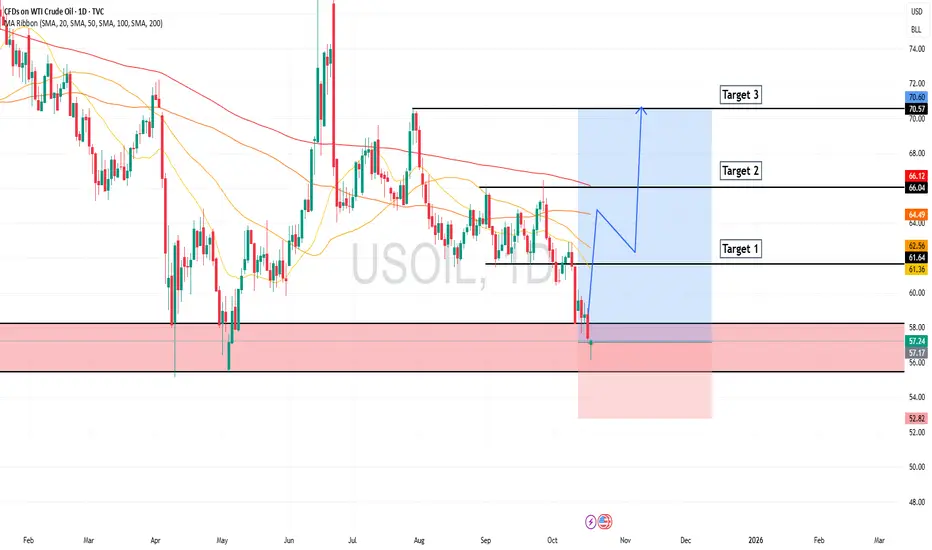
WTI Crude Nears Yearly LowsOver the past three trading sessions, WTI crude has fallen by more than 3.5%, as bearish sentiment has regained control of the market. Uncertainty over global oil demand has heightened investor caution, particularly amid the escalation of trade tensions between the United States and China, which has reignited fears of a slowdown in global trade. This scenario could directly impact the consumption of energy products such as oil, leading to a further decline in demand in the short term. As this atmosphere of concern persists, selling pressure is likely to continue strengthening in the coming sessions.
Strong Bearish Bias
Persistent selling pressure has reinforced the downward trendline that has remained in place throughout 2025, with no significant bullish corrections indicating a potential structural shift in market strength in the short term. As a result, the bearish bias continues to dominate, consolidating the market’s downward trajectory. As the price approaches key support levels, it will be crucial to determine whether current selling pressure remains a decisive force in upcoming price movements.
RSI
The RSI line continues to fall below the neutral 50 level, signaling that bearish momentum remains dominant on average over the past 14 sessions. However, it’s worth noting that the price is approaching a key support area, while the RSI nears the 30 level, considered the oversold zone. This could suggest a potential imbalance in market forces and open the door to short-term technical rebounds in the sessions ahead.
MACD
The MACD histogram remains below the neutral line (0), confirming that the short-term moving averages continue to show bearish momentum. If this pattern persists, it could result in stronger selling pressure extending into the medium term.
Key Levels to Watch:
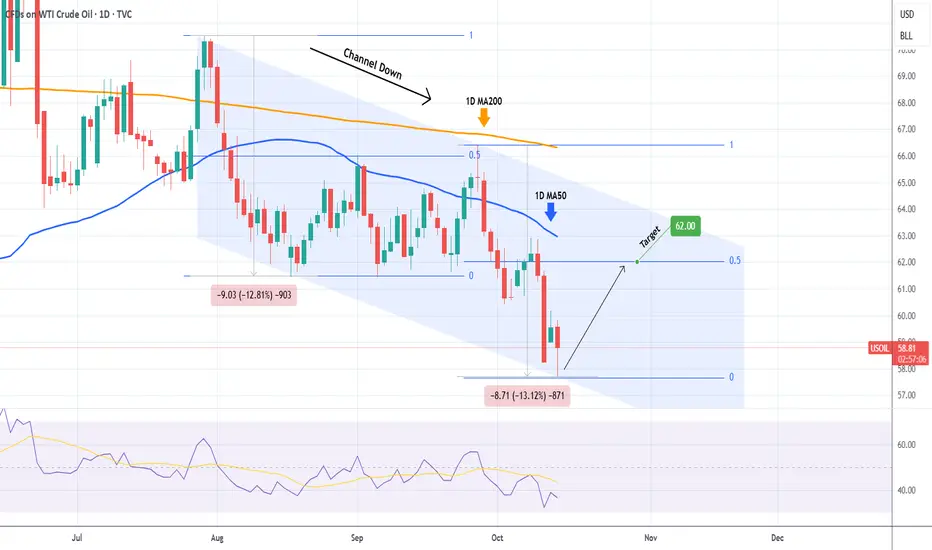
$66 – Major Resistance: Aligns with the 200-period moving average. A bullish move reaching this level could trigger a temporary buying bias and challenge the prevailing downtrend line.
$62 – Near-Term Resistance: Corresponds to the 50-period moving average. If the price stabilizes around this area, it could lead to a neutral sentiment and a period of sideways consolidation in the short term.
$57 – Critical Support: Represents the lowest price levels of the year for WTI. A break below this level could intensify bearish pressure, although it may also serve as a support barrier, allowing for short-term technical corrections to the upside.
Written by Julian Pineda, CFA – Market Analyst

WTI crude oil Wave Analysis – 17 October 2025
- WTI crude oil reversed from strong support level 56.00
- Likely to rise to resistance level 58.00
WTI crude oil recently reversed from the support area between the strong support level 56.00 (which reversed the price in April and May, as can be seen below) and the lower daily Bollinger Band.
This support area was further strengthened by the support trendline of the daily down channel from August.
Given the strength of the support level 56.00 and the oversold daily Stochastic, WTI crude oil can be expected to rise to the next resistance level 58.00.

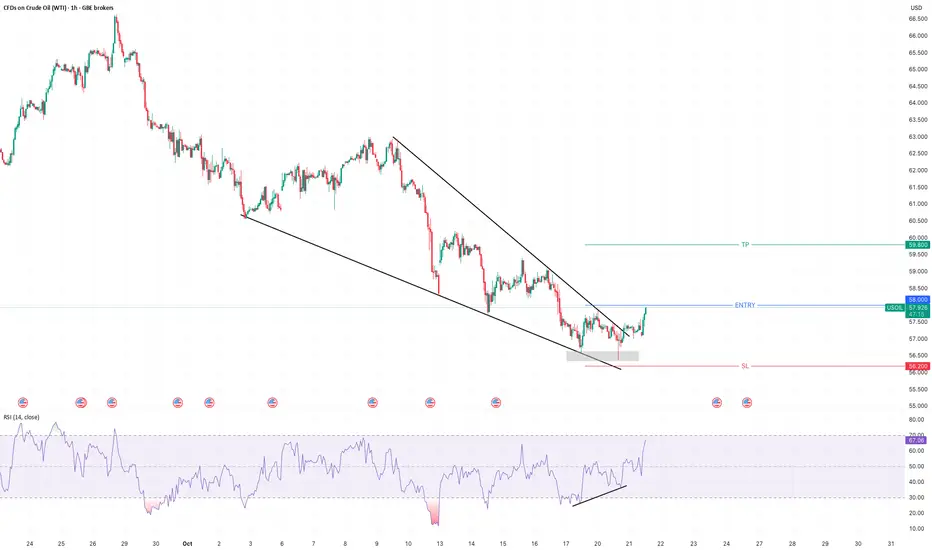
US Oil RSI Bullish Divergence, Buy Trade SetupUS Oil is showing Bullish Divergence on 4H...
On 1H timeframe, we've placed a Buy-Stop order. The TP in this trade setup is below Resistance so it looks like we should be able to take our profit in this 1:1 setup. Let's see how it goes.

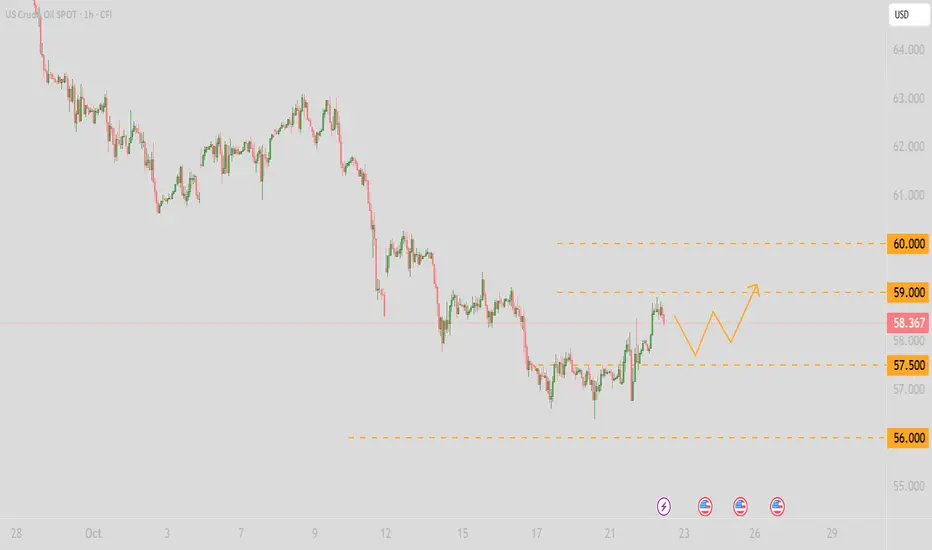
The US-Oil will jump from the historic Support LevelHello Traders
In This Chart US-OIL HOURLY Forex Forecast By FOREX PLANET
today US-OIL analysis 👆
🟢This Chart includes_ (US-OIL market update)
🟢What is The Next Opportunity on US-OIL Market
🟢how to Enter to the Valid Entry With Assurance Profit
This CHART is For Trader's that Want to Improve Their Technical Analysis Skills and Their Trading By Understanding How To Analyze The Market Using Multiple Timeframes and Understanding The Bigger Picture on the Charts
Crude Oil Outlook: Pressure Mounts as 2025 Lows Come Into ViewCrude oil prices are tracing another plunge back to yearly lows amid mounting oversupply, weak demand, and tariff concerns. New 2025 lows may be reached in the short-term horizon, aligning with the lower boundaries of a 3-year down trending channel
From a weekly time frame perspective, crude oil is facing the lower border of a three-year descending channel extending from the 2022 highs. The $55 support currently holds as the 2025 low, but a clean break below it could extend losses toward the $49 zone, aligning with the channel’s bottom boundary — a potential area of support. If this level fails, a deeper selloff could extend toward the $37 region.
On the upside, should prices recover above the $58 mark, a bullish rebound may extend toward $60, $63, and $66, respectively. However, for a sustainable bullish outlook on crude, a breakout above both the three-year downtrend and the $70 resistance is required.
Looking closely at the daily RSI, it is nearing oversold levels last seen in April 2025, suggesting that downside momentum could be approaching exhaustion.
In line with the recent movements of U.S. indices, will we see another dip-and-rebound scenario on crude oil — not identical, but perhaps reminiscent of April 2025?
- Written by Razan Hilal, CMT

USOIL - Bullish ReversalUSOIL has formed falling wedge and double bottom and currently testing the neckline. Entry above last lower high.

USOIL – Downtrend Still IntactUSOIL remains fundamentally weak with technical confirmation of a prevailing downtrend. Short-term pullbacks are likely corrective and may provide better short-entry setups.
Resistance levels:
59.14
60.36
61.91 (Ultimate)
Support levels:
54.81
53.13
51.95 (Ultimate)

Today's crude oil strategy, hoping to be helpful to you.Although the current broader context of the international crude oil market is "excess supply and weak demand", from the perspective of short-term and potential opportunities, there are three key points that support us to attempt a long position. We should not be deterred by the broader "weak market" trend:
Potential "Flashpoints" in Geopolitical Conflicts
Ukraine has not stopped using drones to attack Russia's oil facilities, and Russia's oil refining volume has now hit its lowest level in over two years. If key pipelines are attacked next, or if conflicts between Israel and Qatar in the Middle East escalate further, affecting crude oil transportation, the market will definitely rush to buy oil out of panic. In this case, oil prices will most likely surge suddenly. For example, back in June, when Israel launched an air strike on Iran's nuclear facilities, oil prices rose by 6.9% in a single day. We must seize such opportunities.
Possible "Hitches" in OPEC+ Production Increase
Although OPEC+ plans to increase supply by an additional 137,000 barrels per month in October and November, many oil-producing countries actually have little extra oil to produce. As early as May, the actual production increase was more than half lower than the planned amount. If OPEC+ announces "no more production increases" in subsequent meetings, or even resumes production cuts, the pressure from excess supply will be reduced significantly, and oil prices will naturally be able to hold steady or even rise.
Crude Oil Trading Strategy for Today
usoil @buy 57.50-58.00
pt:58.50-59
sl:57

WTI Technical Forecast: Critical Juncture at Multi-Month SupportSPOTCRUDE (WTI) Technical Forecast: Critical Juncture at Multi-Month Support
Analysis as of 18th Oct 2025 (Close: 57.715)
Market Context: Crude oil sits at a pivotal technical level. Geopolitical tensions provide a bullish fundamental backdrop, but the technical picture shows a market at a make-or-break support zone.
Multi-Timeframe Analysis (Top-Down View)
Swing Bias (D1/4H): Bearish Below $59.00
The daily chart paints a concerning picture. Price is trapped below all key EMAs (50 & 200), confirming a bearish trend structure. We are testing a major Wyckoff Accumulation Zone and a potential Bearish Bat Harmonic pattern completion near $57.50. The RSI is in bearish territory but approaching oversold, hinting at potential for a relief rally.
Intraday Bias (1H/30M): Neutral to Cautious Bullish
The 4H and 1H charts show consolidation after a sharp decline. The Ichimoku Cloud is thick resistance overhead, while the Anchored VWAP from the recent high confirms strong selling pressure. A break above the $58.20 level is needed to signal any short-term strength.
Key Chart Patterns & Theories in Play
Elliott Wave: The decline from the highs appears to be a clear 5-wave impulse down, suggesting we are completing Wave 5. This often precedes a significant corrective (A-B-C) rally.
Gann Analysis: The Square of 9 identifies $57.50 as a major harmonic support level. A break below targets $56.00 next.
Head and Shoulders? A large-scale pattern on the weekly chart has met its minimum target. The current price action could be the final leg of this move.
Bull Trap Risk: A swift bounce to $58.50-$59.00 that fails could trap eager bulls before the next leg down.
Actionable Trade Setups
🟢 Swing Trade (Counter-Trend Long)
Entry: $57.40 - $57.70 (Confluence with Harmonic & Gann Support)
Stop Loss: $56.90
Take Profit 1: $59.00
Take Profit 2: $60.00
🔴 Swing Trade (Momentum Short)
Trigger: A decisive 4H close below $57.30.
Entry: On retest of $57.50 as resistance.
Stop Loss: $58.10
Take Profit: $56.00
⚫ Intraday Long (Bounce Play)
Trigger: Bullish reversal candle (e.g., Hammer/Bullish Engulfing) on the 1H chart at $57.50 support.
Entry: On trigger candle close.
Stop Loss: $57.20
Take Profit: $58.40
Key Levels
Resistance 3: $60.00 (Psychological / 50 EMA)
Resistance 2: $59.00 (Ichimoku Cloud Base)
Resistance 1: $58.20 - $58.50 (Immediate Supply Zone)
Support 1: $57.50 - $57.70 (CRITICAL SUPPORT)
Support 2: $56.90 (Breakdown Trigger)
Support 3: $56.00 (Next Gann Target)
Conclusion
WTI is at a critical inflection point. The high-probability play is a bounce from the $57.50 support for a swing towards $59.00. However, a break below this level would signal a resumption of the broader downtrend. Trade the breakout/breakdown with clear confirmation.
Risk Warning: Trading crude oil involves high risk due to volatility and leverage. This analysis is for educational purposes and does not constitute financial advice. Always manage your risk and conduct your own due diligence.

USOIL fluctuates higher💡The situation for USOIL today is relatively optimistic, showing a fluctuating and moderately strong trend. Here is the detailed analysis:
📈Price Trend: As of midday in the Asian session on October 22, WTI crude oil prices have edged higher in the short term, trading around $58.1, up from the previous day's closing price. WTI crude closed 1.14% higher at $57.962 the previous day.
♦Influencing Factors:
Supply Side: The U.S. Department of Energy announced a tender to purchase 1 million barrels of crude oil to replenish the Strategic Petroleum Reserve. This news boosted sentiment in the energy sector and provided support for oil prices.
♦Demand Side:
API data showed a decline in U.S. inventory levels last week, which improved market sentiment toward demand and also supported higher oil prices.
♦Macroeconomy: Expectations of a Federal Reserve rate cut continue to rise, with a 98.9% probability of a 25-basis-point rate cut in October. Capital has been flowing back into risk assets, providing some impetus to crude oil prices.
♦Geopolitics:
Europe and Ukraine have drafted a 12-point ceasefire plan. Expectations of eased geopolitical tensions temporarily weakened safe-haven demand, indirectly supporting a stronger U.S. dollar and thus exerting some pressure on oil prices. However, factors such as the U.S. oil purchase news and the drop in API crude inventories have provided more significant support for oil prices.
♦Technical Analysis:
Short-term moving averages show signs of flattening, indicating that the crude oil price trend may be stabilizing. Oil prices are inclined to fluctuate with moderate strength in the short term today. The short-term resistance level above is around 59.0-60.0, while the short-term support level below is around 56.0-55.0.
💎Trading Strategy:
Sell 58.00 SL 58.60 TP 57.00
Buy 57.5 SL 56.8 TP 58.5
Daily-updated accurate signals are at your disposal. If you run into any problems while trading, these signals serve as a reliable reference—don’t hesitate to use them! I truly hope they bring you significant assistance
Crude Oil: Mainly Expected to Oscillate DownwardCrude oil has been in a continuous downward trend recently. Both the daily chart movement and the moving average system show a downward divergence pattern, and a new descending channel has been officially formed.
In terms of operation, we need to continue to follow the bearish trend. Today, we can take the opportunity of a rebound at the 58 level to set up short positions.
Special attention should be paid to the fact that crude oil is about to enter the contract delivery period. We need to focus on whether the delivery situation will disrupt the current trend. From the perspective of the current fundamentals and news, the long and short factors are clearly one-sided, and the overall situation still mainly depresses crude oil prices.
Sell 58.8 TP 58 - 55 SL 60.2
Daily-updated accurate signals are at your disposal. If you run into any problems while trading, these signals serve as a reliable reference—don’t hesitate to use them! I truly hope they bring you significant assistance

Us oil possible Wyckoff accumulation?This count is based on my assumptions so anything can happen not a trading or financial advice just for educational purposes only kindly do your own ta thanks trade with care good luck.

Oil stays pressured by a looming OPEC+ hike and US–China strainsOil stays pressured by a looming OPEC+ hike and U.S.–China strains
Fundamental Analysis
1. Oil prices remain under pressure from an upcoming OPEC+ production increase next month, even though they paused their decline over the past two days on news that India may stop buying Russian crude.
2. U.S.–China trade tension, especially tariffs threats, export restrictions, and port charges on both sides are likely weighing on global demand.
3. India has not confirmed a halt to purchases yet, but reports say some refiners may reduce imports of Russian oil.
4. Markets are awaiting EIA data, which could indicate the price direction, after the API reported a large build in crude inventories and gasoline, while distillates fell.
Technical Analysis
5. USOIL keep falling, breaking below the previous low. Price move below diverging bearish EMAs, signaling strengthening bearish momentum, signalling for further declines.
6. If USOIL breaks below the previous low at 58.00, it could test the lowest level in four and a half years at 55.00 and potentially break lower.
7. However, price could first rebound to retest the 60.00 area before resuming the longer-term downtrend.
Analysis by: Krisada Yoonaisil, Financial Markets Strategist at Exness

OilPrice is trying to break out of a downtrend channel after forming a base around $56.5–$57.
Resistance: $58 (short-term), $59.8, and $63 (major).
Support: $56.5–$57 zone.
Volume shows buying interest near the lows — early sign of accumulation.
If price holds above $58, it could aim for $59.8–$63.
If it fails, a pullback toward $56.2–$55.5 is likely.
➡️ Bias: Mildly bullish if $57.8–$58 holds; otherwise, range-bound to bearish continuation.

USOIL Market Direction: Bearish Tilt Amid Downward Momentum?USOIL Market Direction: Bearish Tilt Amid Downward Momentum?
Current Price Snapshot
As of October 15, 2025, USOIL (WTI Crude Oil) is trading around $58.20 per barrel, reflecting a modest intraday uptick of approximately 0.9% from yesterday's close at $58.66. This follows a 1.39% decline on October 14, extending a broader monthly drop of over 7%. The price has been consolidating in a descending channel, with recent lows testing the $57.29–$57.60 support zone, prompting a short-term corrective bounce.
Technical Indicators
- **Trend Structure**: USOIL remains below a key descending trendline on shorter timeframes (H1–H4), signaling sustained downward pressure. A breakdown below $57.65 could accelerate the slide toward $56.00 or lower, aligning with a potential descending flag pattern.
- **Momentum Oscillators**: The RSI (14-period) is climbing from oversold territory around 31, currently near 35–40, suggesting a temporary relief rally but lacking conviction for a full reversal. The ADX at 41.78 confirms a strong prevailing downtrend.
- **Moving Averages**: Price is below the 50-day SMA ($61.55) and 200-day EMA ($59.15), with bearish crossovers reinforcing the negative bias. Key resistance clusters at $60.44–$60.75 (Fibonacci retracement levels) cap upside potential.
- **Support/Resistance**: Immediate support at $57.29–$57.80; breach targets $56.00. Overhead resistance at $60.75, with a pivot at $61.50. A close above $60.75 would invalidate the bearish setup, but current action shows rejection at these levels.
Fundamental Drivers
- **Supply Dynamics**: OPEC+ is gradually unwinding production cuts, adding ~0.6 million barrels per day (b/d) in 2025, while non-OPEC output (led by the US at 13.5 million b/d) surges by 2.0 million b/d. This floods the market, driving global inventories higher and exerting downward force on prices. Recent US inventory builds (e.g., +1.8 million barrels in commercial crude) further signal softening demand.
- **Demand Outlook**: Resurfacing US-China trade tensions are clouding economic recovery prospects, capping industrial fuel needs. Global growth slowdowns, coupled with accelerated renewable energy investments, are projected to weaken crude consumption through 2026.
- **Geopolitical Factors**: While sanctions on Russia and Middle East risks provide occasional support, they are outweighed by ample supply. EIA forecasts Brent (closely correlated to WTI) averaging $62/bbl in Q4 2025, dropping to $52/bbl in 2026, implying further WTI weakness toward $56–$59 by year-end.
- **Macro Influences**: A strengthening USD (amid Fed hawkishness) makes oil less attractive to non-US buyers, adding to the bearish case. Broader forecasts from Reuters and LongForecast see WTI averaging $64.65 for 2025 but ending October near $52.76, a 15.5% monthly decline.
Sentiment from Market Chatter
Real-time discussions on platforms like X highlight mixed but predominantly cautious views. Some traders eye short-covering bounces toward $60, citing oversold RSI and potential OPEC data surprises, but consensus leans bearish, with calls for sub-$60 targets due to inventory builds and trade war fears. Retail signals show sporadic buy setups, but institutional positioning favors shorts.
Overall Direction and Outlook
**Bearish** – USOIL's trajectory today points downward, with the corrective uptick likely fizzling at $60 resistance. Expect continued pressure toward $57–$56 unless a decisive break above $60.75 emerges, which would shift bias to neutral.
Monitor upcoming EIA inventory data and US-China headlines for volatility spikes. Position sizing should account for low ATR (0.40), indicating subdued near-term swings. This assessment draws from a synthesis of price action, indicators, supply-demand fundamentals, and market sentiment for a comprehensive view.

WTI OIL hit the Channel Down bottom. Buy Signal.WTI Oil (USOIL) has been trading within a Channel Down since the July 30 High and today it hit its bottom (Lower Lows trend-line). The decline from the recent Lower High was around -13%, similar to the previous Bearish Leg.
When that bottomed (Lower Low), it rebounded towards its 1D MA50 (blue trend-line) and peaked (Lower High) marginally above the 0.5 Fibonacci retracement level. As a result, we expect a new Bullish Leg to start now, with our Target at $62.00.
-------------------------------------------------------------------------------
** Please LIKE 👍, FOLLOW ✅, SHARE 🙌 and COMMENT ✍ if you enjoy this idea! Also share your ideas and charts in the comments section below! This is best way to keep it relevant, support us, keep the content here free and allow the idea to reach as many people as possible. **
-------------------------------------------------------------------------------
💸💸💸💸💸💸
👇 👇 👇 👇 👇 👇

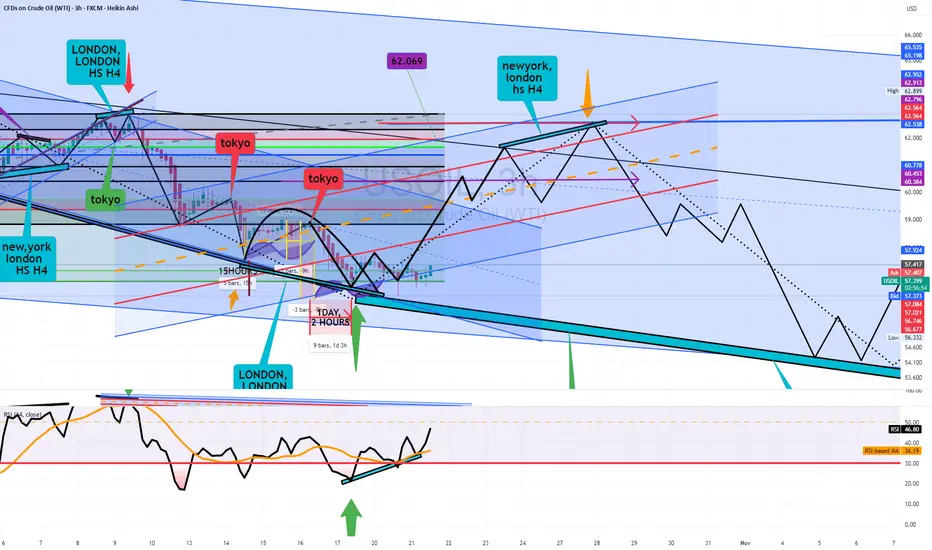
US, OILHI GUYS,
We are still bullish on us oil
NOTE NOTHING HAS CHANGED, JUST LIQUIDITY GRABS IN LOWER TIME FRAMES. HOWEVER H4 IS STILL BULLISH
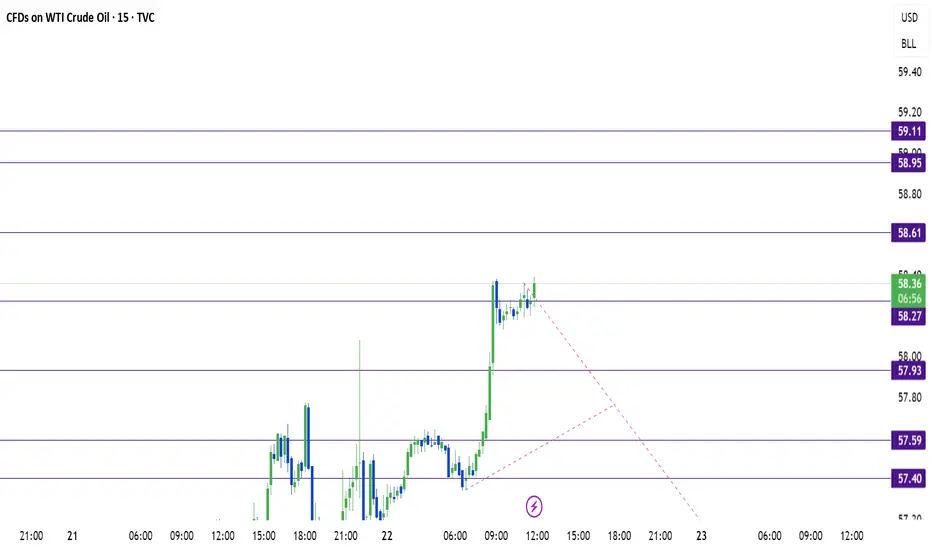
US OIL SUPPORT, RESISTANCE & TRENDLINE ANALYSISKindly check my previous levels "Perfect" Long position captured.
Go "SHORT" if it breaks 57.93 with target as 57.59 and breaking that will lead to 57.40 and further that will lead to 56.92 and the final breakout will lead to 56.42.
The 58.37 mark is acting as a strong resistance since quiet long.
Go "LONG" if it breaks 58.27 which shall lead to 58.61 and breaking that will lead to 58.95 and 59.11 and if it breaks this as well then might be a possibility of a good upside move till 60.09
WTI Crude Oil – Buy SetupPrice is holding near intraday support after a strong sell-off. A potential short-term rebound could target the upper resistance zone.
Buy Entry: 57.45
Stop Loss: 57.25
Take Profit: 58.60
📈 Bias: Intraday Bullish Reversal
⚠️ Note: This analysis is for educational purposes only. Always confirm entries with your own strategy and manage risk accordingly.
#WTI #CrudeOil #XTIUSD #Scalping #TradingSetup #BuySignal
