Short-term bullish core logic: 3 immediate signals resonatePolicy aspect: OPEC+ halts production increase takes effect, $60 defense line is firmly established
On November 3rd, OPEC+ officially announced a 2026 first-quarter production pause, with only a 12-month maintenance increase of 137,000 barrels per day. This decision precisely hedged against the "2 million barrels per day supply surplus in the first quarter" risk warned by IEA. Historical data shows that when OPEC+ voluntarily curbs production during the demand slack period, oil prices often receive a policy support premium of 1-2 weeks. Currently, $60.91 is at the stabilization stage after policy support, and $60, as the marginal cost line for US shale oil, forms a double support.
Inventory aspect: Unexpected continuous inventory reduction, demand resilience exceeds expectations
As of the week ending October 24th, US commercial crude oil inventories dropped by 6.86 million barrels (expected only a 200,000 barrel reduction), gasoline and distillate inventories decreased by 5.94 million barrels and 3.36 million barrels respectively, and all three oil product inventories were below the five-year average by 3%-8%. Although the inventory in the Cushing region increased by 1.334 million barrels month-on-month, the overall commercial inventory has cumulatively decreased by 15.9 million barrels, coupled with the import volume dropping to a 2021 low (510 million barrels per day), the short-term supply-demand tight balance pattern has not changed, providing substantial support for oil prices.
Technical aspect: Bottom formation begins, rebound momentum starts
$60.91 is at the upper edge of the "56.93-61.65" oscillation range, the daily line presents a "hammer pattern + bullish engulfing" combination pattern, and since late October, a clear bottom reversal signal has been formed;
Momentum indicators improve simultaneously: RSI has rebounded from the oversold range to 41, the MACD red bar begins to expand, and after the price stabilizes at the $60 key level, speculative long positions have returned 38,000 contracts in a week, the financial support has strengthened.
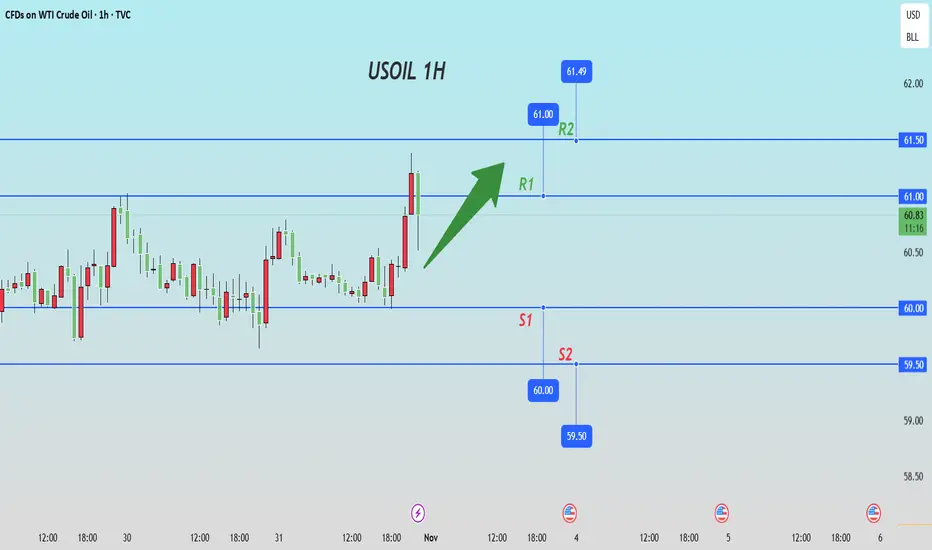
Crude Oil Trading Strategy for Today
sell:61-61.5
tp:60.5-60
sl:62
Trade ideas
WTI Crude Oil | Flag Breakout Faces Macro ResistanceCrude broke out of its short-term flag, but momentum has been softer than expected — a possible hint of a broader consolidation phase. OPEC+’s pause on supply hikes through Q1’26 aligns with surplus projections, but fresh U.S. sanctions on Russia could flip that narrative fast.
Technical Lens:
Price broke above a descending channel, yet upside follow-through stalled beneath the $62–65 resistance band (former breakdown zone). RSI is mid-range near 55, showing balance between buyers and sellers. A larger flag may be forming within the broader $58–65 structure.
Scenarios:
If $65 holds as resistance → price could drift back toward $58–59 support to reset momentum.
If $65 breaks cleanly → opens scope toward the $68–70 handle, aligning with prior supply zone.
Catalysts:
OPEC+ output guidance revisions, U.S. sanctions enforcement on Russian crude, and global demand indicators heading into winter.
Takeaway:
WTI sits in a technical crossroads between breakout continuation and macro restraint — $62–65 remains the decision zone to watch this week.

BUY USOILOur trade for today is on OIL, as you can see, we bought to target the Daily LQ.
Follow for more trades!

Next week's crude oil trading strategyFundamentals: Inventory liquidation continues + OPEC + production increase debate, support margin strengthens
1.Inventory data remains positive, demand resilience verified
The latest EIA data shows that U.S. crude oil inventories have continued to deplete unexpectedly for two consecutive weeks, gasoline inventories have recorded the largest decline in the past 5 years on a year-on-year basis, and the inventories of the three major oil products are all below the 5-year average by 10%-15%, significantly easing the inventory pressure. Although inventories in the Cushing region have slightly increased, the overall de-accumulation trend has not changed. In addition, China's petrochemical plants' purchase volume in November is expected to increase by 5%-8% compared with the previous month, and terminal demand provides rigid support for oil prices.
1.OPEC + production increase debate intensifies, supply constraint not eased
OPEC + has obvious differences in the pace of production increase: Saudi Arabia hopes to expand production to regain market share, while Russia advocates maintaining a moderate increase of 137,000 barrels per day to avoid supply过剩 suppressing oil prices. The fulfillment rate of production increase in November was less than 60%, and the UAE has a 9.500 barrels per day gap due to oilfield maintenance, and Russia has not fully released idle production capacity. In addition, Saudi Arabia's "voluntary reduction of 1 million barrels per day" policy continues until the end of 2025, the supply side's protection for oil prices exceeds market expectations. Institutions predict that this week, OPEC + may maintain a small increase in production or suspend the increase, further limiting the supply increase.
1.Refinery profit supports processing demand
Although the diesel crack spread in the New York port has declined, it is still 40% higher than the same period in 2024, and the gasoline crack spread remains at a high level, supporting the stable operation of U.S. refineries at 87.2% and the daily crude oil processing volume at 17.3 million barrels, providing stable support for procurement demand.
Next week's crude oil trading strategy
buy:60-60.5
tp:61.5-62
sl:59

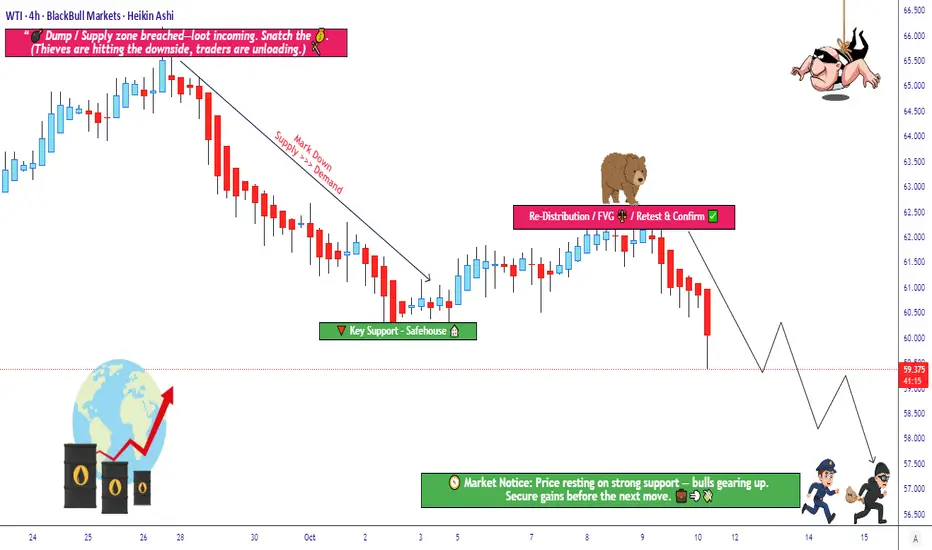
Is Crude Oil Setting Up for a Major Bearish Reversal?🛢️ XTI/USD “WTI” – Bearish Redistribution Zone Incoming (Thief Strategy Inside)
📉 Setup Overview
Market: XTI/USD (WTI crude oil)
Bias: Bearish confirmed — we’re looking for re-distribution / supply pressure to take control
Trade Type: Swing / Day Trade hybrid
🎯 Entry Plan (Thief-Layer Strategy)
I use a layering / multiple limit order approach (aka “Thief Strategy”). You may use any price level as entry, but here’s my preferred ladder:
Sell Limit @ 61.500
Sell Limit @ 61.000
Sell Limit @ 60.500
Sell Limit @ 60.000
Sell Limit @ 59.500
(You may extend more layers if you like)
You don’t need to hit all layers — just get partial fills, ride the move downward.
🚫 Stop Loss
Thief’s SL: 62.500
⚠️ Note to Thief OG’s: I’m not forcing you to follow my SL. You choose what works. Make money, take money — at your own risk.
🎯 Target
We see police barricade as a strong support zone + oversold trap possibility.
So primary target: 57.000
⚠️ Note to Thief OG’s: Don’t blindly hold to my TP. If price gives you your gains early, escape with your money — don’t wait for perfection.
🔍 Related Pairs & Correlations
AMEX:USO or USOIL (oil ETFs / indices) – real-world crude correlation
$BRENT/USD – watch for strength or weakness divergence
AMEX:XOP / AMEX:OIH (oil & gas sector indices) – sentiment in energy names
Key point: if Brent weakens while WTI breaks down, it reinforces the bias.
📌 Key Technical Notes
We’re waiting for ** redistribution / supply zone** to hold — a retest or failure bounce is ideal setup.
Oversold conditions + a “trap” candle (fake breakout) strengthen the move.
Use layering to average in, not “all-in” at once.
Be ready for whipsaws around support zones; partial exits can help.
✨ “If you find value in my analysis, a 👍 and 🚀 boost is much appreciated — it helps me share more setups with the community!”
Disclaimer: This is Thief-style trading strategy just for fun. I am not giving financial advice. Trade at your own decision and risk.
#WTI #CrudeOil #XTIUSD #EnergyTrading #OilStrategy #Layering #SwingTrade #DayTrade #BearishBias #ThiefStrategy
USOIL BEARS WILL DOMINATE THE MARKET|SHORT
USOIL SIGNAL
Trade Direction: short
Entry Level: 60.87
Target Level: 55.71
Stop Loss: 64.31
RISK PROFILE
Risk level: medium
Suggested risk: 1%
Timeframe: 1D
Disclosure: I am part of Trade Nation's Influencer program and receive a monthly fee for using their TradingView charts in my analysis.
✅LIKE AND COMMENT MY IDEAS✅

Expecting decrease in supply by end of yearBased on the current OPEC's report (October 2025) there is an increase in supply.
The supply will be reduced by the end of year.
In relation to the MFE and MAE we are getting closer to MAE.
We're heading to a discount price (ICT)
Add long position below 44USD

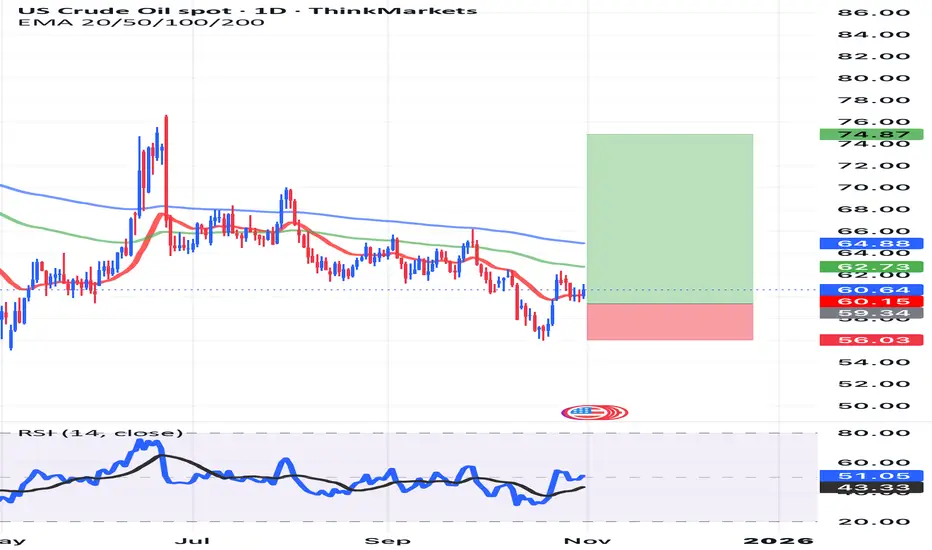
WTI OIL TECHNICAL OUTLOOK
WTI OIL CLOSING PRICE 60.87$ per barrel
WTI OIL defended price at 56.45 per barrel and found a new weekly support at 59.62$ per barrel.
if oil break out of the descending trendline on its current support from 59.62$ per barrel ,it could hit 66.57$ per barrel resistance roof .
key supply zone 70.32$ per barrel
key supply roof 74,3$ per barrel
WTI FUNDAMENTAL OUTLOOK .
OPEC+ policies continuing with moderate production increases, balancing supply with steady but not surging global demand.
Demand in emerging markets, especially in Asia, remains resilient despite global economic uncertainties.
Geopolitical risks are present but largely priced in, with no immediate large supply disruptions expected.
Inventories and stockpiles are stable, and US shale production remains a key swing factor.
Shifts in energy transition policies and investment in renewables create a backdrop for gradual demand growth for oil, sustaining fundamental support for prices.
US oil inventory levels and the Strategic Petroleum Reserve (SPR) have a significant impact on oil prices, including WTI crude:
US oil inventories represent the stockpiles of crude oil held by commercial entities. When inventories decline, it signals tighter supply, which tends to push oil prices higher. Conversely, rising inventories indicate excess supply, weighing on prices. Recent trends show US commercial crude inventories dropping below seasonal norms, supporting upward pressure on oil prices despite global supply concerns.
The Strategic Petroleum Reserve (SPR) is a government-controlled emergency stockpile. Releases from the SPR increase available supply in the market temporarily, usually putting downward pressure on prices. Conversely, when SPR drawdowns slow or reserves are rebuilt, it diminishes this supply cushion, which can support higher prices. The SPR has been at historically low levels recently following government releases, limiting its impact on immediate weekly inventory reports but remains a key factor in market confidence.
Overall, tight US inventories combined with limited SPR releases create a supply-constrained environment that supports oil prices. However, global supply dynamics, including OPEC+ production targets and non-OPEC supply growth, also play critical balancing roles. Market participants closely monitor US inventory reports and SPR announcements as near-term price catalysts due to their direct impact on available crude supply and market sentiment.
In summary, falling US crude oil inventories generally push WTI prices higher as they signal tighter market supply, while SPR drawdowns or replenishments modulate this effect by adjusting emergency stock availability. Both are key components in oil price dynamics and important for traders and analysts assessing near-term supply-demand balance.
#usoil #wtioil #crude

USOILHow to become successful in forex and stock trading:
1.Master fundamentals and technical analysis.
2.Build and follow a solid trading plan.
3.Apply strict risk management (4–6% rule).
4.Stay disciplined—control fear and greed.
5.Record and analyze every trade.
6.Focus on high-quality setups only.
7.Diversify across assets and markets.
8.Keep evolving—study, adapt, and grow daily.
Crude Oil Trading Strategy for TodayThe cooling of inflation data strengthens the logic of a rate cut.
The core PCE price index in the United States rose by 2.8% year-on-year in October (lower than the expected 3.0%), reaching a new low since March 2023 and remaining below 3% for three consecutive months, confirming that inflation is approaching the Fed's 2% target. The probability of a 25BP rate cut in December has risen from 65% to 82%, and the cumulative rate cut expectation for 2026 has reached 125BP. In a liquidity-lean environment, the valuation attractiveness of crude oil as a risky asset has significantly increased - historical data shows that the average increase in WTI oil prices during the rate-cut cycle is 12%-15%, and the current price of $61.21 is still in the early stage of valuation recovery.
The US dollar index is under pressure, and the expectation of non-US demand release is expected.
The US dollar index has fallen by 3.2% from its October high and is currently stabilizing below the 92.5 mark. The purchasing power of non-US currencies has rebounded. The purchasing costs of oil-importing countries such as India and China have decreased. In November, India's oil imports are expected to increase by 6% month-on-month (to 5.2 million barrels per day), and China's refineries have received new quotas in November (an additional 12 million tons), and the policy-driven replenishment demand will directly support oil purchases, forming a positive cycle of "weak US dollar - increased purchases - oil price rise".
Crude Oil Trading Strategy for Today
buy:60.5-61
tp:61.5-62
sl:60

USOIL Is Very Bullish! Buy!
Please, check our technical outlook for USOIL.
Time Frame: 6h
Current Trend: Bullish
Sentiment: Oversold (based on 7-period RSI)
Forecast: Bullish
The market is trading around a solid horizontal structure 60.808.
The above observations make me that the market will inevitably achieve 62.277 level.
P.S
Overbought describes a period of time where there has been a significant and consistent upward move in price over a period of time without much pullback.
Like and subscribe and comment my ideas if you enjoy them!

US OILHI GUYS,
We are still selling as illustrated months ago, nothing has changed , no correction on technical just a clean update on sell entries H4, H3 CHART and price patterns for speed on entry

US OILHI GUYS,
US OIL , we are still selling on weekly chart to area of interest as we expect RT DAILY SOON.

USOIL: Short Trading Opportunity
USOIL
- Classic bearish setup
- Our team expects bearish continuation
SUGGESTED TRADE:
Swing Trade
Short USOIL
Entry Point - 60.87
Stop Loss - 61.10
Take Profit - 60.44
Our Risk - 1%
Start protection of your profits from lower levels
Disclosure: I am part of Trade Nation's Influencer program and receive a monthly fee for using their TradingView charts in my analysis.
❤️ Please, support our work with like & comment! ❤️

Crude Oil Trading Strategy for TodayExcess inventory reduction exceeded expectations, and the resilience of demand was continuously verified
The latest EIA data shows (as of the week ending October 31), U.S. crude oil inventories decreased by 4.5 million barrels on a month-on-month basis (expected - 1.8 million barrels), and inventories have exceeded expectations for two consecutive weeks of reduction; gasoline inventories decreased by 3.2 million barrels (the largest decline in the same period since November, nearly 5-year low), refined oil inventories decreased by 2.8 million barrels, and inventories of the three major oil products were all below the 5-year average by 10%-15%. The inventory in the Cushing region increased by 800,000 barrels, but the overall reduction trend did not change, and the marginal tight balance feature of supply and demand was prominent.
Increased risk of Red Sea transportation, intensified supply chain disruptions
The Houthi armed group has recently intensified attacks on Red Sea merchant ships. Since November, 5 oil tanker ships have been attacked, and some oil tankers were forced to take a detour around the Cape of Good Hope (the voyage increased by 30%, transportation cost increased by 200,000 US dollars per ship). Currently, Red Sea crude oil transportation accounts for 12% of the global total. If the situation worsens, it may add 50-80 thousand barrels per day of supply disruptions.
The expectation for Fed rate cuts has risen again, and the US dollar is under pressure, which benefits oil prices
The U.S. 10-month CPI increased by 3.2% (lower than the expected 3.3%), and the core CPI increased by 2.9% (the lowest since January 2023), and the probability of the Fed cutting interest rates by 25 basis points in December from 55% rose to 78%. The US dollar index fell below the 93 threshold, the cost of purchasing non-US currencies decreased, and China and India's crude oil imports are expected to increase by 5%-8% month-on-month in November.
Crude Oil Trading Strategy for Today
buy:59.5-60
tp:61-61.560
sl:58.5
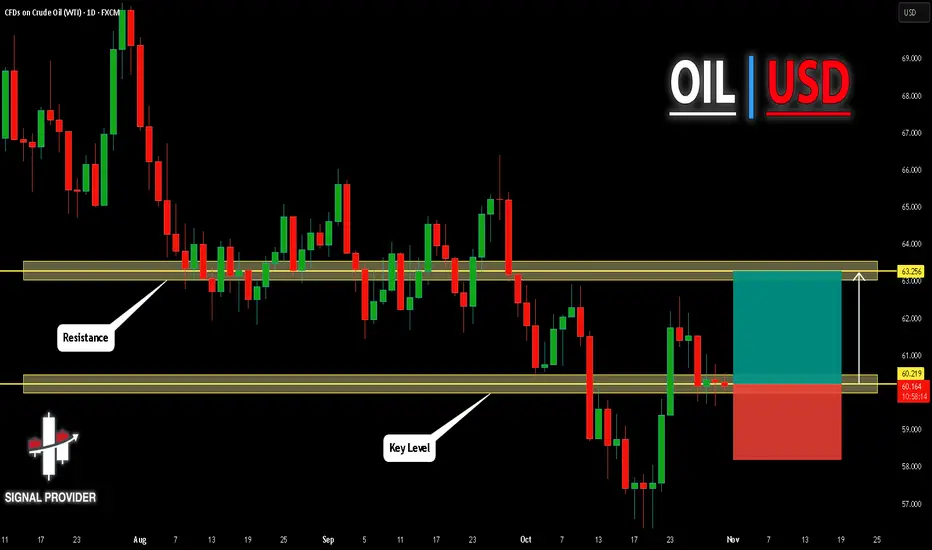
USOIL Is Very Bullish! Long!
Please, check our technical outlook for USOIL.
Time Frame: 1D
Current Trend: Bullish
Sentiment: Oversold (based on 7-period RSI)
Forecast: Bullish
The market is approaching a significant support area 60.219.
The underlined horizontal cluster clearly indicates a highly probable bullish movement with target 63.256 level.
P.S
Please, note that an oversold/overbought condition can last for a long time, and therefore being oversold/overbought doesn't mean a price rally will come soon, or at all.
Like and subscribe and comment my ideas if you enjoy them!
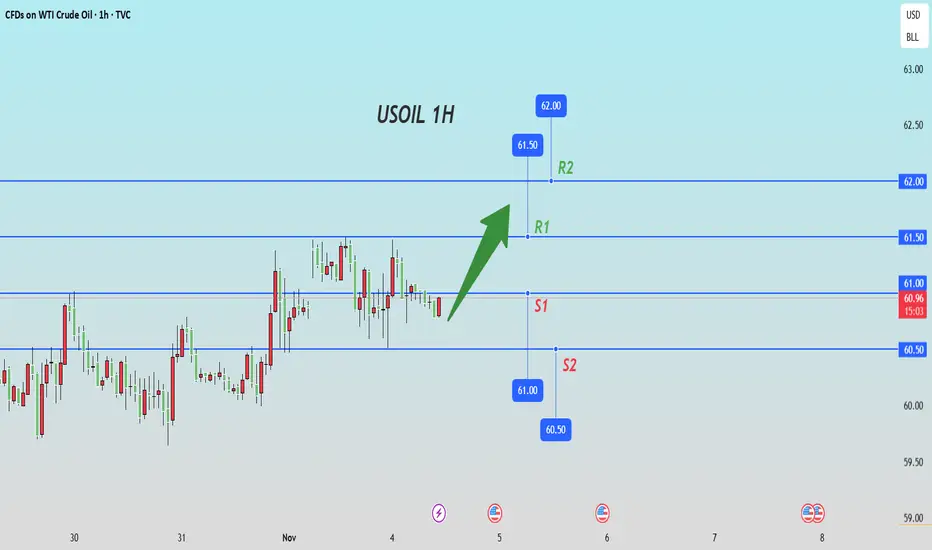
US CRUDE OIL (WTI): Bullish Move from Key LevelI am quite pleased with how 📈USOIL reacted on a significant horizontal support level on a 4-hour time frame.
Following this test, the pair started to consolidate and form a horizontal range.
A breakout above the resistance of this range provided a strong bullish signal.
We are currently seeing a positive bullish reaction and can anticipate further growth when the market opens.
Our target levels are 61.53 and 62.06.

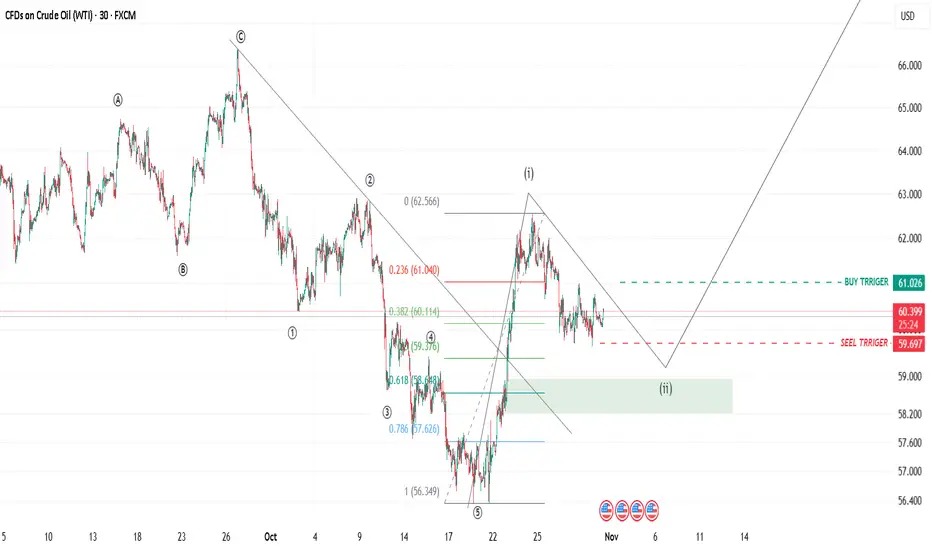
WTI – Wave 2 correction nearing completionWave 2 appears to be in its final stage of correction.
The buy and sell triggers are clearly marked on the chart.
There’s still a possibility for a slightly deeper pullback toward the highlighted zone before we see the start of a new bullish wave 3.
USOIL H4 | Bearish Drop OffUSOIL is reacting off the sell entry, which is a pullback resitance that aligns with the 38.2% Fibonacci retracement and could drop from this level to the downside.
Sell entry is at 60.77, whichis a pullback resistance that lines up with the 38.2% Fibonacci retracement.
Stop loss is at 62.09, which is a swing high resistance that lines up with he 78.6% Fibonacci retracement.
Take profit is at 58.74, which is a pullback support that aligns with the 61.8% Fibonacci retracement.
Stratos Markets Limited (tradu.com ):
CFDs are complex instruments and come with a high risk of losing money rapidly due to leverage. 68% of retail investor accounts lose money when trading CFDs with this provider. You should consider whether you understand how CFDs work and whether you can afford to take the high risk of losing your money.
Stratos Europe Ltd (tradu.com ):
CFDs are complex instruments and come with a high risk of losing money rapidly due to leverage. 70% of retail investor accounts lose money when trading CFDs with this provider. You should consider whether you understand how CFDs work and whether you can afford to take the high risk of losing your money.

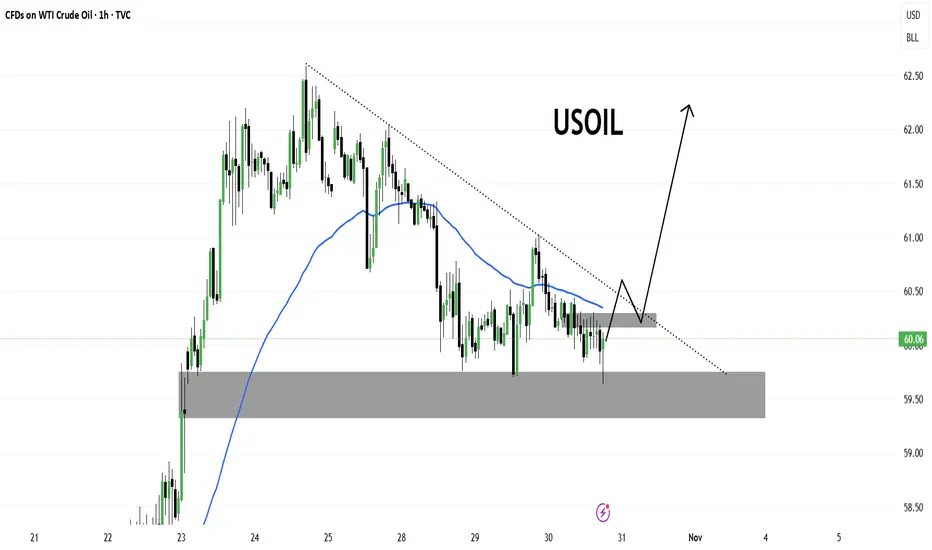
USOILCrude oil is currently trading around the $60.00 level, consolidating after a recent bearish phase. Price has respected the support zone near $59.50–59.80, forming a potential accumulation base.
A descending trendline is acting as dynamic resistance, while the 50-period moving average is flattening—indicating that bearish momentum is losing strength.
The projection suggests a possible breakout above the trendline, followed by a retest of the breakout zone before a potential rally toward the $62.00–62.50 area.
As long as the price holds above the support zone, the bullish scenario remains valid. A breakdown below $59.50 would invalidate this setup.
Crude oil may bounce higherThe today's potential idea is a technical long for Crude oil.
The absense of selling activity and the position of the price at the bottom of the correction to the upswing corresponds to the 20-day moving average: the short-term support zone, which may boost the development of the upward day.
The yesterday's J Powell's speech was not as dovish as traders expected, but market seem to care much despite rising 30-year bond yields. Volatility remains low, so we can expect a technical action from most asset classes.
That's not a signal, that's just the idea. Always consider your own reseach and manage your risk at all times!

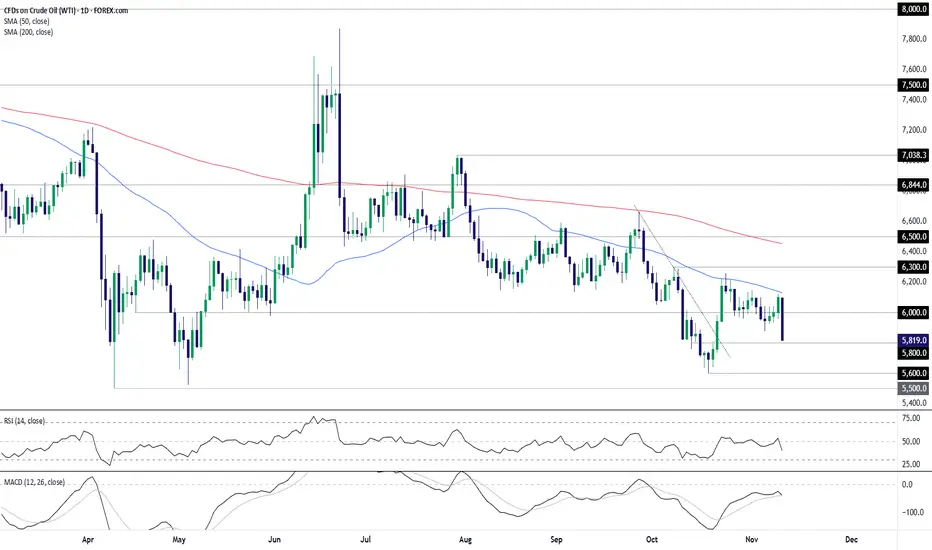
Bearish bar signals risk of deeper crude slideUnable to climb above the 50-day moving average and having just delivered an almighty bearish bar, is WTI crude about to revisit the October lows—an outcome that could put a retest of the YTD lows on the cards? With momentum indicators like RSI (14) and MACD swinging sharply lower, signaling building downside strength, the risk of such a move is growing.
$58.00 is a minor level to watch near term, having acted as support and resistance at times last month. Should price trade beneath this level, shorts could be established on the break with a stop above for protection, targeting a run toward the October swing low of $56.00. The preference would be to see a back-test and rejection of the level before entry.
While short setups are favored given recent price and momentum signals, should WTI manage to hold above $58.00 during Thursday’s session, the option would be there to flip the setup, allowing for longs with a stop beneath for protection. $60.00 screens as an appropriate initial target, even with the messy price action around it recently.
Plenty of fundamental catalysts were bandied around to explain Wednesday’s abrupt drop, most linked to an EIA report warning of market oversupply. It undoubtedly contributed to the bearish move, but the seeds were sown well before the event given how poorly WTI traded at the 50DMA in recent weeks.
Good luck!
DS
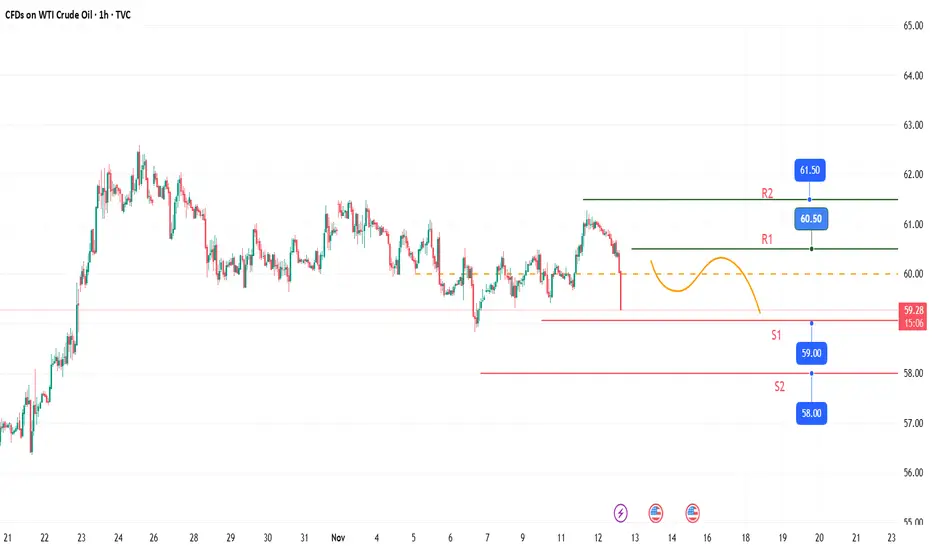
USOIL: Fluctuating declineCrude oil showed a trend of fluctuating decline today, breaking through key support levels, with a clear bearish dominance.
Key support below: In the short term, attention should be paid to the $59.00 integer mark. If this level is breached, oil prices may further drop to $58.00.
Resistance levels for rebound: If there is a technical rebound in oil prices, the first resistance level is at $60.50, and the second resistance level is at $61.50, with limited rebound space.
Trading Strategy:
Buy 59 - 59.5
SL 58.5
TP 60 - 60.5 - 61
Sell 60.5 - 61
SL 61.5
TP 59.1 - 58.5